IDENTIFICATION DES ASSEMBLAGES DE KYSTES DE
DINOFLAGELLÉS DANS LES PORTS DE LA CÔTE EST
CANADIENNE
ANALYSE DE L'INFLUENCE DU TRANSPORT MARITIME
ET
DU
DEVERSEMENT D'EAU ET DE SEDIMENTS CONTENUS DANS
LES
BALLASTS
Mémoire présenté
dans le cadre du programme de maîtrise en océanographie en vue de l'obtention du grade de maître ès Sciences
PAR
©
OLIVIA LACASSE
UNIVERSITÉ DU QUÉBEC À RIMOUSKI Service de la bibliothèque
Avertissement
La diffusion de ce mémoire ou de cette thèse se fait dans le respect des droits de son auteur, qui a signé le formulaire « Autorisation de reproduire et de diffuser un rapport, un mémoire ou une thèse ». En signant ce formulaire, l’auteur concède à l’Université du Québec à Rimouski une licence non exclusive d’utilisation et de publication de la totalité ou d’une partie importante de son travail de recherche pour des fins pédagogiques et non commerciales. Plus précisément, l’auteur autorise l’Université du Québec à Rimouski à reproduire, diffuser, prêter, distribuer ou vendre des copies de son travail de recherche à des fins non commerciales sur quelque support que ce soit, y compris l’Internet. Cette licence et cette autorisation n’entraînent pas une renonciation de la part de l’auteur à ses droits moraux ni à ses droits de propriété intellectuelle. Sauf entente contraire, l’auteur conserve la liberté de diffuser et de commercialiser ou non ce travail dont il possède un exemplaire.
Composition du jury :
Chris McKindsey, président du jury, ISMER-UQAR, Institut Maurice-Lamontagne André Rochon, directeur de recherche, ISMER-UQAR
Suzanne Roy, codirectrice de recherche, ISMER-UQAR
Vera Pospelova, examinateur externe, Université de Victoria, Colombie Britannique
Dépôt initial le 19 avril 20 Il Dépôt final le 13 septembre 20 Il
REMERCIEMENTS
Ouf! Je n'en reviens pas que ce chapitre de ma vie tire à sa fin car ce fût toute une aventure ... du début à la fin. Une aventure, oui, mais ô combien enrichissante à bien des égards. Une aventure qui m'a fait voir du pays et le monde, mais qui m'a aussi fait grandir intérieurement. Je n'aurais jamais pensé qu'un jour je me serais intéressée au monde microscopique et extrêmement diversifié et intéressant des kystes de dinoflagellés. Il faut dire que pour une biologiste marin de formation et de cœur s'intéresser à la micropaléontologie relevait du domaine du défi.
Je tiens à remercier André Rochon pour sa patience, mais aussi pour m'avoir donné l'opportunité de relever ce défi. Merci de m'avoir fait découvrir ce monde particulier qui est celui des dinoflagellés. Merci à André et Suzanne Roy de m'avoir donné la chance, grâce au financement du Canadian Aquatic Invasive Species Network (CAISN), de voir le Canada d'un océan à l'autre en passant par les Rocheuses canadiennes, mais aussi de faire un voyage au bout du monde afin de travailler avec prof. Gustaaf Hallegraeff de l'Université de Tasmanie en Australie. Merci aussi à André et Suzanne pour votre patience et vos judicieux conseils lors du long travail de rédaction qu'est ce mémoire.
Merci à Chris McKindsey pour m'avoir donné la chance d'aller collecter mes échantillons et ceux des autres équipes de CAISN. J'ai vraiment passé un bel été et j'ai beaucoup appris. Merci à Étienne Faubert pour les coups de main au labo, pour ta bonne compagnie, mais aussi pour ton écoute attentive lors de nos longues conversations, chacun les yeux dans nos microscopes respectifs. Sans le savoir, tu as été d'une aide précieuse pour ce qui est du support moral.
Merci à ma famille et à mes amis, ici à Rimouski mais aussi ailleurs au Québec, au Canada ou dans le monde. Votre support et compréhension lors des moments plus difficiles ont été et sont toujours fort appréciés.
Maintenant que cette aventure tire à sa fin je peux dire que j'ai appris énormément et que je ne regrette absolument pas de l'avoir entreprise. Encore une fois, MERCI À VOUS TOUS AMIS, PARENTS, PROFESSEURS, COLLÈGUES! Sans vous cette aventure n'aurait pu être possible.
RÉSUMÉ
Le transport d'organismes marins dans les réservoirs de ballasts de navires est maintenant reconnu comme étant un vecteur important pour l'introduction d'organismes nuisibles dans un nouvel environnement. Les dinoflagellés, de par leur faculté de produire des floraisons d'algues nuisibles (HAB), constituent une menace réelle lorsqu'ils sont introduits dans un nouvel environnement. En effet, alors que certaines espèces sont capables de produire une prolifération massive de cellules qui peut causer des dommages à la vie marine, d'autres produisent des toxines dangereuses pour les organismes marins et les humains. De plus, 15% de tous les dinoflagellés sont reCOillms comme étant capable de produire des kystes de résistances dans le cadre de leur cycle vital. Ces kystes peuvent facilement être transportés d'un environnement à un autre dans les ballasts de navires et peuvent ainsi aboutir, lors du déballastage, dans les ports des régions côtières. Cette étude porte sur les assemblages de kystes de dinoflagellés retrouvés dans les dépôts sédimentaires de surface de certains ports de la Nouvelle-Écosse. Les sédiments ont été récoltés lors du mois de juillet 2008 à l'aide d'une benne benthique d'Ekman. Les concentrations moyennes varient entre 1346 et 83 351 kystes g-I de sédiment sec alors que la diversité spécifique varie entre 14 et 40. Les résultats ont démontré la présence de trois groupes distincts d'assemblages de kystes de dinoflagellés qui diffèrent selon la concentration de kystes et la composition spécifique: groupe 1 (Yarmouth et Liverpool), groupe 2 (Shelburne, Halifax et Sheet Harbour) et groupe 3 (détroit de Canso, Little Narrows et Sydney). Les concentrations moyennes de kystes de dinoflagellés dans les ports ont démontré une augmentation significative en fonction du nombre de navires fréquentant ces pOlis et du volume d'eau de ballast provenant de navires qui n'ont pas effectué d'échange d'eau de ballast. Un important lit de kystes du complexe d'espèces Alexandrium tamarense, dinoflagellés potentiellement toxiques et capable de former des HAB, a été découvert dans le bassin de Bedford du port d'Halifax (concentrations maximales : 220 872 ± 148 086 kystes g-Iséd. sec). Cette étude constitue le premier effort pour examiner les relations entre le trafic commercial maritime et les concentrations de kystes de dinoflagellés dans les ports de la Nouvelle-Écosse.
Mots clés: Kystes de dinoflagellés, assemblages, distribution, Nouvelle-Écosse, ballasts, navires, espèces non indigènes, HAB
ABSTRACT
The transport of marine organisms in ballast tanks of cargo ships is now recognized as an important vector for the introduction of marine pests in the environrnent. With their ability to produce Harmful Aigai Blooms (HAB), dinoflagellates represent a serious threat when they are introduced to new environrnents. Indeed, while sorne species are able to produce massive algal proliferation that may cause coasta1 anoxia threatening marine life, others generate a variety of toxins that can cause harm and even death to marine organisms and humans. AIso, 15% of aIl dinoflagellates produce resistant dormant cysts as part of their life cycle. These cysts can easily be transported from one environrnent to another in ships ballasts and the y can be discharged in ports during deballasting. This study focuses on identifying the dinoflagellate cyst assemblages found in the surface sediment deposits of selected ports of Nova Scotia. Samples were collected in July 2008 from eight ports in Nova Scotia using an Ekman bottom grab sampler. The average concentrations range from 1346 to 83 351 cysts g-I dry sed. and the species richness index ranges from 14 to 40. Results show that there are three distinct groups of dinoflagellate cyst assemblages: group 1 (ports of Yarmouth and Liverpool), group 2 (ports of Shelbume, Halifax and Sheet Harbour) and group 3 (ports of Canso Strait, Little Narrows and Sydney). Dinoflagellate cyst concentrations averaged over each port showed a statistically significant increase with the number of ships visiting these ports and with the volume of ballast water from ships that did not undertake a ballast water exchange. High cyst concentrations (220 872 ±
148 086 cysts g-l dry sed.) of the potentially toxic and bloom forming Alexandrium tamarense species complex were found in Bedford Basin of the port of Halifax. This study constitutes the first attempt to examine the relationships between shipping and dinoflagellate cysts concentrations in ports of Nova Scotia.
Keywords: Dinoflagellate cysts, assemblages, distribution, Nova Scotia, ballasts, ships, non-indigenous species, HAB
TABLE DES MATIÈRES
REMERCIEMENTS ... VIII RÉSUMÉ ... X ABSTRACT ... XII T ABLE DES MATIÈRES ... XIV LISTE DES TABLEAUX ... XVII LISTE DES FIGURES ... XX LISTE DES ANNEXES ... XXIII INTRODUCTION GÉNÉRALE ... 1 CHAPITRE 1 LES ASSEMBLAGES DE KYSTES DE DINOFLAGELLÉS
DANS LES SÉDIMENTS DE SURFACE DES PORTS DE LA
NOUVELLE-ÉCOSSE, CANADA: EXISTE-T -IL UNE INFLUENCE PROVENANT DU TRAFIC MARITIME? ... 5 1.1 RÉSUMÉ EN FRANÇAIS DU PREMIER ARTICLE ... 5 1.2 DINOFLAGELLATE CYST ASSEMBLAGES IN SURFACE SEDIMENTS FROM
PORTS OF NOVA SCOTIA, CANADA: Is THERE AN INFLUENCE OF SHlPPING TRAFFIC? ... 7 CHAPITRE 2 CONCENTRATION ÉLEVÉE DE KYSTES DU
DINOFLAGELLÉ POTENTIELLEMENT TOXIQUE
ALEXANDRIUM TAMARENSE DANS LE BASSIN DE BEDFORD,
HALIFAX, NOUVELLE-ÉCOSSE, CANADA ... 58 2.1 RÉSUMÉ EN FRANÇAIS DU DEUXIÈME ARTICLE ... 58
2.2
HIGH CYST CONCENTRATIONS OF THE POTENTIALLY TOXICDINOFLAGELLATEALEXANDRJUM TAMARENSE SPECIES COMPLEX IN
BEDFORD BASIN, HALIFAX, NOVA SCOTIA, CANADA ...•...• 59 CHAPITRE 3 CONCLUSION GÉNÉRALE. ...•.•... 76 RÉFÉRENCES BIBLIOGRAPHIQUES ...•...•...•...•.•....••...•.. 79
LISTE DES TABLEAUX
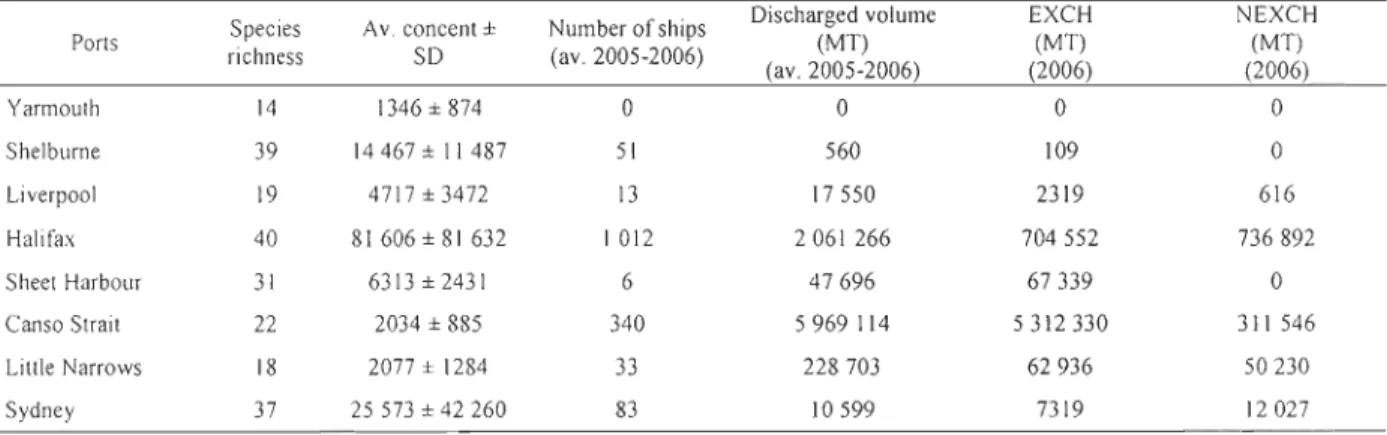
Table 1.1. Dinoflagellate cyst species richness (number of species observed), average cyst concentrations (cysts g-l dry sed.), average number of ships and volume of discharged ballast water (in metric tons, MT) for the years 2005-2006 in the eight ports of Nova Scotia examined in this study. The volumes of discharged ballast water which were exchanged (EXCH) and non-exchanged (NEXCH) (in metric tons, MT) are only available for the year 2006. The information on ships and ballast water come from the Canadian Ballast Water Database for 2005 and from M.G. Deneau and S.A. Bailey, DFO for 2006 (unpublished data). Please refer ta appendix VII for values of SST, SSS, nutrients and sea-ice caver for the Scotian Shelf.. ... 12 Table 1.2. Dinoflagellate cyst average concentration (cysts g-l of dry sed.) with standard deviation (SD) and relative abundance (%
= (number of cysts for a given species
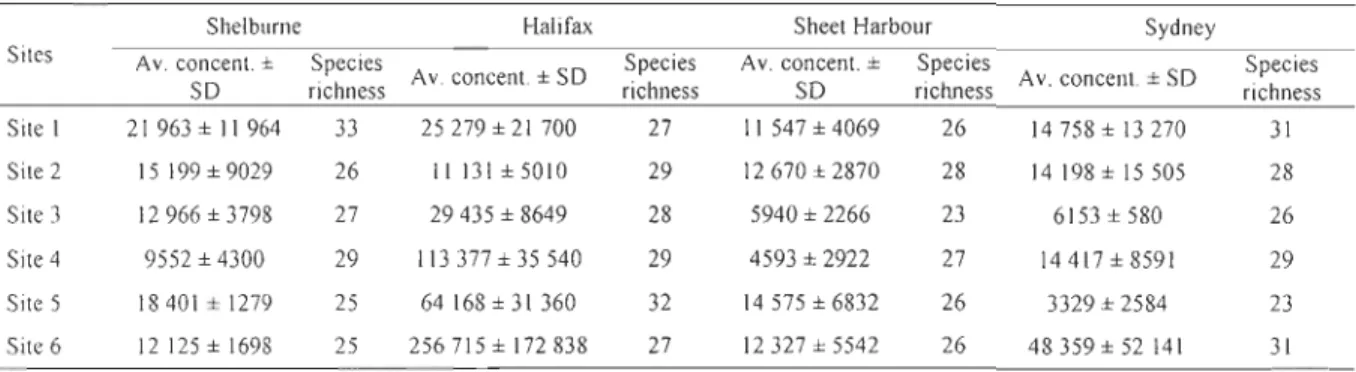
/total number of cysts for a given port)* 100)) in the eight Nova Scotia ports with the number (n) of cysts counted for a given port. (*Harmful/toxie speeies. tPotentially exotie and/or toxie speeies) ... 17 Table 1.3. Within-port cyst information: average concentration (cysts g-l dry sed.) with standard deviation (SD) and species richness (number of species observed) per sampling site for the ports of Shelburne, Halifax, Sheet Harbour and Sydney ... 26 Table 1.4. Within-port cyst information: relative abundance (% = (number of cysts for agiven species/total number of cysts for a given site)* 1 00) of dinoflagellate cysts within four ports of Nova Scotia with the number (n) of cysts counted for a given site. (*Halmful/toxie speeies. tPotentially exotie and/or toxie speeies) ... 29
Table 2.1. Average concentrations of cysts of Alexandrium tamarense species complex and of aIl dinoflagellate cysts found in the six sampling sites of the port of Halifax. Values are given as average of triplicate subsamples (in cysts g-! dry sed.) with standard deviation (SO) and the relative abundance (%) of Alexandrium tamarense species complex ... 64
LISTE DES FIGURES
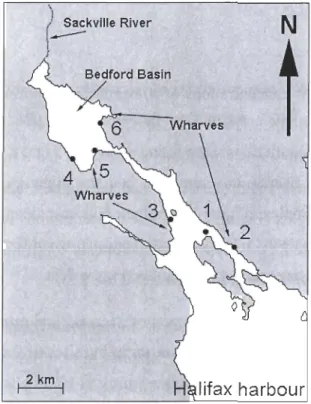
Figure 1.1. Location of the eight sam pied ports in Nova Scotia, Canada ... 11 Figure 1.2. Location of the six sites randomly selected from the eight sampled ports. Note
differences in scale for Halifax and Canso Strait.. ... 13 Figure 1.3. A) nMDS results using a Bray Curtis similarity index for the dinoflagellate cyst
assemblages of the eight sampled ports after a fourth root transformation; B) relative abundances (5) of the dominant dinoflagellate cysts for the 3 groups of ports ... 21 Figure lA. Results from the linear regressions between A) the number of ships and the
average concentration of dinoflagellate cysts (cysts g'l dry sed.), and B) the volume of non-exchanged discharged ballast water in metric tonnes (MT) and the average concentration of dinoflagellate cysts (cysts g,l dry sed.). Note that the scales of the x axis are different. ... 24 Figure 1.5. nMDS results using a Bray Curtis similarity index for the dinoflagellate cyst assemblages for the ports of Halifax (T), Sydney (.), Shelburne (0) and Sheet Harbour (6) (6 sites ports'l) after a fourth root transformation ... 25 Figure 1.6. Relative abundances (%) of the dominant dinoflagellate cyst taxa for each site
in the port of Shelburne, Halifax, Sheet Harbour and Sydney ... 27 Figure 2.1. Location of the six sampling sites randomly selected from the port of Halifax, Nova Scotia, Canada ... 63
Figure 2.2. A) Cysts of the Alexandrium tamarense species complex; B) vegetative cell of
Alexandrium tamarense. Scale bar
=
1 0 ~m. Arrow pointing to the pore located on theLISTE DES ANNEXES
APPENDIX 1. 1) Cyst of the Alexandrium tamarense species complex, 2) Ataxiodinium choane, 3) Bitectatodinium tepikiense, 4) lmpagidinium spp., 5) cf Gymnodinium impudicum, 6) Nematosphaeropsis labyrinthus, 7) Operculodinium centrocarpum, 8) cyst of Pentapharsodinium daleL Scale bar
=
1 0 flm ... 50APPENDIX II. 1) Cyst of Scrippsiella sp. 1 (with cellular content), 2) cyst of Scrippsiella sp. 1
(without cellular content), 3) cyst of Scrippsiella lachrymosa, 4) Spiniferites spp., 5) Spiniferites spp., 6) Spiniferites bulloideus, 7) Spiniferites delicatus, 8) Spiniferites frigidus, 9) Spiniferites ramosus. Scale bar
=
1 0 flm ... 51APPENDIX III. 1) Brigantedinium spp., 2) Brigantedinium simplex, 3) Brigantedinium
irregulare, 4) Cochlodinium sp. 1 (with cellular content), 5) Cochlodinium sp. 1 (without cellular content), 6) Cochlodinium sp. 2, 7) Dubridinium lenticulatum, 8) Dubridinium sp. 1 (with cellular content), 9) Dubridinium sp. 1 (without cellular content). Scale bar
=
10 flm ... 52APPENDIX IV. 1) Echinidinium sp. 1, 2) Echinidinium sp. 2, 3) lslandinium minutum,
4) Lejeunecysta cf. sabrina, 5) cyst of Polykrikos kofoidii, 6) cyst of Protoperidinium americanum, 7) cyst of Protoperidinium nudum, 8) cyst of Protoperidinium stellatum, 9) Selenopemphix quanta. Scale bar
=
10 flm ... 53APPENDIX V. 1) Votadinium calvum, 2) unidentified cyst A, 3) unidentified cyst B,
4) unidentified cyst C, 5) unidentified cyst D. Scale bar = 10 flm ... 54 APPENDIX VI. Complete list of the dinoflagellate cyst species found in Nova Scotia,
APPENDIX VII. Values of SST, SSS, nutrients and sea-ice cover for the Scotian Shelf for the year 2007 ... 56
INTRODUCTION GÉNÉRALE
Le transport des organismes aquatiques par les navires commerciaux transocéaniques et domestiques est devenu un vecteur dominant pour l'introduction d'espèces exogènes envahissantes (EEE) au Canada depuis le début des années '60 (Duggan et al. 2005). Chaque année, des milliers de navires en provenance de l'extérieur circulent dans les eaux portuaires canadiennes, offrant de nombreuses opportunités à ces espèces de s'installer. Ainsi, depuis l'ouverture de la voie maritime du Saint-Laurent, environ 170 espèces non indigènes se sont établies dans la région des Grands Lacs (Duggan et al. 2005).
Ces organismes sont, pour la majeure partie, transportés dans les eaux et les sédiments des réservoirs de lest ou ballast ('ballast tanks') des navires. La présence d'espèces exogènes dans ces réservoirs ne signifie toutefois pas qu'il y aura automatiquement un établissement de celles-ci dans le nouvel environnement. En ce qui concerne les kystes de dinoflagellés, huit étapes sont nécessaires afin que l'introduction soit un succès (Hallegraeff 1998). Ces étapes peuvent être résumées en quatre grands points, dont le premier consiste en la prise d'eau et potentiellement de sédiments dans les réservoirs de ballast lors d'un bloom saisonnier de plancton dans le port d'origine. Toutefois, la probabilité que des dinoflagellés toxiques soient pris lors de la prise d'eau dans les réservoirs de ballasts est fortement dépendante : Cl) des habitudes de navigation (i.e. des routes fréquemment empruntées), (2) de la saisonnalité des blooms de phytoplancton dans les ports où la prise d'eau de ballast s'effectue et, (3) de la présence locale d'un lit de kystes dans les sédiments (Hallegraeff 1998). Les organismes doivent par la suite survivre aux processus de ballastage, aux longs voyages à l'obscurité et à des conditions de transport généralement difficiles (Lavoie et al. 1999). La troisième étape comprend le transfert du navire au milieu côtier du port d'arrivée, suivi de la germination des kystes, la croissance et la reproduction du dinoflagellé dans le nouvel environnement
(Hallegraeff 1998). Finalement, suite à l'établissement les organismes peuvent se propager
régionalement via les courants côtiers ou le transport domestique, causant potentiellement de sérieux problèmes écologiques, économiques et même de santé publique (Carlton and Geller 1993, Hallegraeff 1998).
Il ne faut toutefois pas se fier au nombre d'espèces introduites pour évaluer la gravité
du problème. En effet, une seule espèce peut causer des dommages importants et souvent
irréversibles à l'environnement (Bourgeois et al. 2001). L'introduction d'une espèce phytoplanctonique capable de produire des floraisons nuisibles (( harmful algal blooms », HAB) dans un nouvel environnement en constitue un bon exemple. Ce type de floraison est
devenu un fléau à l'échelle mondiale suite à l'accroissement de leur dispersion
géographique dû, notamment, au transport des microorganismes dans les eaux de ballast (Hallegraeff et al. 1997, Vila et al. 2001).
Les espèces d'algues toxiques sont nuisibles pour l'environnement, soit par la production de toxines ou à travers d'autres effets nocifs comme l'obstruction des branchies de poisson ou la réduction d'oxygène liée aux accroissements de biomasse algale. La plupart des espèces impliquées dans les HAB sont des algues photo synthétiques ainsi que quelques espèces de protozoaires hétérotrophes (Anderson et al. 2002). Les dinoflagellés
comptent environ 100 taxons capables d'engendrer des proliférations d'algues nuisibles (Soumia 1995, Smayda 1997). Pam1i ceux-ci, seulement un petit nombre sont capables de
produire des kystes de résistance, les plus connus étant Gymnodinium catenatum et
Alexandrium spp. La plupart de ces espèces peuvent produire des substances toxiques pour l'Humain et les animaux (Doblin and Dobbs 2006).
Un intérêt particulier doit donc être porté aux dinoflagellés potentiellement toxiques qui forment des kystes de résistance pouvant être transportés dans les sédiments de ballast. En effet, ces kystes peuvent demeurer viables dans le sédiment pendant de nombreuses
années (Doblin and Dobbs 2006). Ils sont extrêmement résistants aux conditions difficiles (obscurité prolongée, faibles concentrations d'02) des réservoirs de ballast dans lesquels ils peuvent se retrouver (Hallegraeff 1998). En effet, des kystes de dinoflagellés ont été
3
observés dans les sédiments des réservoirs de ballasts de navires arrivant dans les ports d'Australie, de la Nouvelle-Zélande, des États-Unis, du Canada, de l'Écosse et de l'Angleterre (Hamer et al. 2000 et références citées). Lors de la vidange des réservoirs avant le chargement de marchandises au port, les kystes peuvent être relâchés et potentiellement s'établir dans un nouvel environnement. De nombreuses espèces ont pu être ainsi introduites dans plusieurs ports (Carlton and Geller 1993).
Il n'est cependant pas facile de démontrer qu'une population de dinoflagellés a récemment été introduite dans une nouvelle zone. Pour ce faire, il faut d'abord prouver que cette population est effectivement nouvelle dans cette zone (Lilly et al. 2002), tâche qui peut s'avérer très ardue. Ceci se fait généralement au moyen de carottes de sédiment, par l'examen des populations de dinoflagellés présentes dans le passé (Hallegraeff et al. 1997) afin d'établir si une nouvelle espèce a pu s'installer à cet endroit. Toutefois, des quelques 2000 espèces de dinoflagellés marins, seulement 15 % des espèces produisent des kystes au cours de leur cycle vital (Head 1996). II sera donc possible de prouver l'introduction d'une nouvelle espèce seulement si cette dernière produit un kyste qui se conservera quelques dizaines ou centaines d'années.
Très peu d'études ont été effectuées sur la diversité des espèces de kystes et de formes végétatives de dinoflagellés retrouvées dans les zones portuaires canadiennes (Bérard-Therriault et al. 1999, Carver and Mallet 2001). Il y a donc peu d'information concernant la composition des espèces retrouvées à ce jour. L'obtention de ce type d'information devient essentielle pour contrôler l'arrivée de nouvelles espèces dans les eaux canadiennes et ainsi déterminer si les mesures prises pour enrayer ce problème sont efficaces.
Cette étude vise à déterminer les assemblages de kystes de dinoflagellés présents dans les sédiments de surface des ports de la côte est canadienne et d'examiner l'influence du trafic maritime (i.e. navires marchands) sur ces assemblages. Pour ce faire, la distribution des assemblages de kystes de dinoflagellés a premièrement été observée à l'intérieur des huit ports sélectionnés selon un gradient croissant du nombre de navires et du volume d'eau
déchargée pour ces ports. Par la suite, la distribution à l'intérieur des ports a été établie afin de déterminer si elle est homogène à l'intérieur d'un même port. Finalement, l'influence du
trafic maritime sur la composition des assemblages de kystes a été déterminée en analysant le nombre de navires visitant chaque port ainsi que la quantité d'eau de ballast déversée sur l'abondance moyenne ainsi que le nombre d'espèces de kystes de dinoflagellés retrouvées dans cette étude. Ce projet fait partie du réseau canadien sur les espèces marines envahissantes (Canadian Aquatic Invasive Species Network ou CAISN). Le texte qui suit est présenté sous la forme de deux publications scientifiques (un article et une note) qui seront soumis au journal Marine Ecology Progress Series.
CHAPITRE 1
LES ASSEMBLAGES DE KYSTES DE DINOFLAGELLÉS DANS LES
SÉDIMENTS DE SURFACE DES PORTS DE LA NOUVELLE-ÉCOSSE,
CANADA: EXISTE-T-IL UNE INFLUENCE PROVENANT DU TRAFIC MARITIME?
1.1 RÉSUMÉ EN FRANÇAIS DU PREMIER ARTICLE
Dans le but de vérifier si le trafic commercial maritime influence la concentration et la composition des assemblages de kystes de dinoflagellés de la côte est canadienne, des échantillons de sédiments de surface ont été prélevés dans les ports de la Nouvelle-Écosse en juillet 2008. Les ports ont été choisis selon la fréquence du trafic maritime (de 0 à plus de 1 000 navires annuellement). Les résultats ont démontré la présence de trois groupes distincts d'assemblages de kystes de dinoflagellés qui diffèrent selon la concentration de kystes et la composition spécifique: groupe 1 (Yarmouth et Liverpool), groupe 2 (Shelbume, Halifax et Sheet Harbour) et groupe 3 (détroit de Canso, Little Narrows et Sydney). Les concentrations moyennes dans les ports ont varié entre 1 346 et 83 351 kystes g-l de séd. sec et l'indice de richesse spécifique a varié entre 14 et 40. Les concentrations moyennes de kystes de dinoflagellés dans les ports ont démontré une augmentation significative en fonction du nombre de navires et du volume d'eau de ballast provenant de navires qui n'ont pas effectué d'échange d'eau de ballast. Ces résultats suggèrent que les navires semblent jouer un rôle dans le transport et le transfert des kystes de dinoflagellés dans les ports où l'eau de ballast est déchargée. Ces relations sont toutefois fOliement influencées par les résultats d'un port en particulier, Halifax, qui est le port qui reçoit le plus grand nombre de navires (dominé par le trafic local qui ne nécessite pas d'échange d'eau de ballast avant d'entrer dans le port). La distribution des assemblages de kystes de dinoflagellés à l'intérieur des ports était assez homogène (six sites par port). Cette étude constitue le premier effort pour examiner les relations entre le trafic commercial maritime et les concentrations de kystes de dinoflagellés dans les ports canadiens.
Mots clés: Kystes de dinoflagellés, distribution en surface, transport maritime, eau de ballast, sédiment de ballast, Canada, côte est
Ce premier article, intitulé
« Dinoflagellate cyst assemblages in surface
sediments from pOltS of Nova Scotia, Canada: Is there an influence of shipping traffic?», fut co-rédigépar moi-même ainsi que par les professeurs André Rochon et Suzanne Roy. Il sera soumis
dans quelques jours à la revue Marine Ecology Progress Series. En tant que premier auteur,
ma contribution à ce travail fut l'essentiel de la recherche sur les assemblages de kystes de dinoflagellé, l'échantillonnage, l'exécution du travail de laboratoire, les analyses statistiques et la rédaction de l'article. Les professeurs André Rochon et Suzanne Roy, second et troisième auteur, ont fourni l'idée originale et ont contribué à la révision de l'article. Une version abrégée de cet article a été présentée lors de la réunion annuelle du
1.2 DINOFLAGELLATE CYST ASSEMBLAGES IN SURFACE SEDIMENTS FROM PORTS OF
NOVA SCOTIA, CANADA:
Is
THERE AN INFLUENCE OF SHIPPING TRAFFIC?7
Manuscrit en préparation pour une publication dans la revue Marine Ecology Progress Series
Olivia Lacasse, André Rochon* and Suzanne Roy
Institut des Sciences de la Mer, Université du Québec à Rimouski, 310 Allée des Ursulines,
Rimouski, Québec, G5L 3Al, Canada
1.2.1. ABSTRACT
We collected surface sediment samples from eight ports in Nova Scotia in July 2008 in order to obtain basic information on the dinoflagellate cyst assemblages in the sedimentary deposits from ports on Canada's East coast and examine if shipping activity influences the nature and abundance of the dinoflagellate cyst assemblages in this environment. These ports coyer a gradient from low to high shipping traffic. Results show that there were three distinct groups of dinoflagellate cyst assemblages: group 1 (Yarmouth and Liverpool), group 2 (Shelbume, Halifax and Sheet Harbour) and group 3 (Canso Strait, Little Narrows and Sydney), which differed based on the dinoflageUate cyst concentrations and species composition. Average concentrations over aU ports ranged from 1346 to 83 351 cysts g-l dry sed and the species richness index ranged from 14 to 40. Dinoflagellate cyst concentrations averaged over each port showed a statistically significant increase with the number of ships and the volume of ballast water from ships that did not undertake a ballast water exchange, suggesting that ships may play a role in the transportation and seeding of dinoflagellate cysts in receiving pOlis. However, these relations were influenced strongly by the results from one port: Halifax, which receives the greatest number of ships among aU the ports considered here (dominated by domestic ships with no ballast water exchange). The within-port distribution of the dinoflagellate cyst assemblages was quite homogeneous (six sites per port). This study constitutes the first attempt to examine the relationships between shipping and dinoflageUate cysts concentrations in Canadian ports.
Keywords : Dinoflagellate cysts, surface distribution, shipping traffic, ballast water, ballast sediment, Canada, East coast
9
1.2.2. INTRODUCTION
The transport of marine organisms in ships' ballast tanks has been recognized as an
important vector for the introduction of marine pests in the environrnent (e.g. Hallegraeff
and Bolch 1992, Carlton and Geller 1993, Subba Rao et al. 1994, Niimi 2004, Kipp et al. 2010). The impacts of these introduced organisms are numerous, and the y can either be
economical, ecological or even public health-related. Dinoflagellates are microscopie algae with their ability to pro duce Harmful Aigai Blooms (HAB) and present a serious threat
because they can impact aIl three sectors mentioned above. lndeed, while sorne species are able to produce massive algal proliferations that may cause anoxia and ceIl death, others generate a variety of toxins that can cause harm and even death to marine organisms and humans.
Dinoflagellates are either autotrophic, heterotrophic, mixotrophic or even parasitic (Gaines and Elbrachter 1987). Together with the diatoms and coccolithophorids, they play an important role in the primary production of aquatic ecosystems (e.g. Rochon et al.
1999). About 200 species of dinoflagellates, which represent approximately 15% of living
dinoflagellate species, produce a hypnozygote or organic-walled resting cyst as part of their life cycle (Head 1996). Once the cysts are formed in the water column, they behave as fine silt particles and sink to the seafloor (Dale 1976). They then remain dormant for a
mandatory period after which the cells will excyst and start a new life-cycle (Evitt 1985). The cell wall of most of these resting cysts is composed of dinosporin, a resistant material that allows the cyst to be preserved in the sediments for long periods of time (Fens orne et al. 1993). The cysts can survive in unfavourable environrnental conditions and thus play an essential role in the dispersal and survival of the species (Anderson and Wall 1978).
These dinoflagellate cysts can easily be transported across oceans in ships ballast
water and sediments. With their ability to survive in harsh conditions and their long
viability in sediments (months to years: Anderson et al. 2004), cysts of dinoflagellate
species that are known to pro duce HABs constitute a serious threat for coastal marine environments. It is thus important to monitor their introduction from shipping activities.
Determining if a new cyst-producing algal species has been introduced normally requires the analysis of time series from sediment cores, which is beyond the scope of the present
study. However, we can examine if differences have taken place among ports with different
shipping traffic, assuming that ships can be a source of dinoflagellate cysts (e.g. Hallegraeff
and Bolch 1992). Previous studies have suggested that increases in the number of ships
visiting a port and the volume of ballast water discharged could influence the
concentrations of marine organisms and species diversity in ports (Bourgeois et al. 2001,
Ruiz and Carlton 2003 and references therein, Lawrence and Cordell 2010). To examine this, we used eight ports from Nova Scotia that differ in terms of shipping traffic. This
study, which is part of the Canadian Aquatic Invasive Species Network (CAISN) prograrn, will also provide information on the dinoflagellate cysts assemblages in local ports,
including their within-port spatial distribution. In addition, it establishes a baseline for the recognition of newly introduced dinoflagellate cysts in the future. The main objective of this work was thus to identify the dinoflagellate cysts assemblages present in the recent
sedimentary deposit of the eight ports chosen along a gradient from low to high shipping
traffic and assess the potential influence of commercial shipping traffic on the cyst
assemblages.
1.2.3. MATERIAL AND METHODS 1.2.3.1. Study area
Sampling was done during the port sarnpling campaign of the Canadian Aquatic Invasive Species Network (CAISN) pro gram in July 2008. Surface sediments were collected in triplicate from 48 stations located in eight different ports (6 stations port-I
)
located along the south and eastem shores of Nova Scotia and Cape Breton, Canada
(Figures 1.1 and 1.2). The distance between each port was at least 50 km. The ports were chosen according to the number of ships visiting each of them and the amount of ballast
water being discharged. They were selected to reflect a gradient from low to high shipping
traffic for the average of the years 2005 (data from the Canadian Ballast Water Database) and 2006 (M.G. Deneau and S.A. Bailey, DFO, unpublished data). Yarmouth represents the
Il
port at the lower end of the gradient (i.e., no commercial ship debaUasting) and Halifax the
upper end member with 1012 ships visiting from the US and other countries (Table 1.1).
N
Liverpool"'-'T
1 3~km1
-6'JOW -5ÇYJWTable 1.1. Dinoflagellate cyst species richness (number of species observed), average cyst concentrations (cysts g-I dry sed.), average number of ships and volume of discharged ballast water (in metric tons, MT) for the years 2005-2006 in the eight ports of Nova Scotia examined in this study. The volumes of discharged ballast water which were exchanged (EX CH) and non-exchanged (NEXCH) (in metric tons, MT) are only available for the year 2006. The information on ships and ballast water come from the Canadian Ballast Water Database for 2005 and from M.G. Deneau and S.A. Bailey, DFO for 2006 (unpublished data). Please refer to appendix VII for values of SST, SSS, nutrients and sea-ice cover for the Scotian Shelf.
Species Av. coneent ± Number of ships Discharged volume EXCH NEXCH
Ports richness SD (av. 2005-2006) (MT) (MT) (MT) (av. 2005-2006) (2006) (2006) Yarmouth 14 1346 ± 874 0 0 0 0 Shelburne 39 14467 ± Il 487 51 560 109 0 Liverpool 19 4717 ± 3472 13 17550 2319 616 Halifax 40 81606 ± 81632 1 012 2061 266 704552 736892 Sheet Harbour 31 6313 ± 2431 6 47696 67339 0 Canso Strait 22 2034 ± 885 340 5969114 5312330 311 546 Little Narrows 18 2077 ± 1284 33 228703 62936 50230 Sydney 37 25 573 ± 42 260 83 ID 599 7319 12027 1.2.3.2. Sediment sampling
We randomly collected sediment samples in triplicate at six stations in each port (Figurel. 2). Samples were collected using an Ekman bottom grab sampler (12.5 x 12.5 x 22 cm). In order to collect the most recent cysts we collected only the sediment that was in the oxic layer (when present), i.e. approximately the top 2 cm layer or less, which represents roughly the past 20 years based on a sediment accumulation rate of 1 cm per 10 years for Bedford Basin, Halifax, N.S. (Miller et al. 1982). The sediment was put into plastic bags and tagged with GPS coordinates, time and date. The overlying seawater in the grab was also transferred by pipette with the sediments because cysts may get resuspended
13
from surface sediments during sampling. Samples were refrigerated (4°C) and kept in the dark untillaboratory processing (from a few months to a year).
N
i
Little Narrows
I
H"'
I
Figure 1.2. Location of the six sites randomly selected from the eight sampled ports. Note differences in scale for Halifax and Canso Strait.
1.2.3.3. Sam pie processing and analysis
Whole sediment samples were first homogenized by gently stirring the sediment in the bag with a spatula. A volume of 1 cm3 of sediment was then collected by displacement
of an equal volume of seawater in a graduated cylinder. A second subsample of sediment was weighed and dried to calculate the proportion of water using the following equations:
(1) C
=
B/A(3) G
=
(F/D) x 100 (4) H=
C x (lOO-G)1100where A is the volume of the first sediment subsample (cm\ B is the weight of the volume of the first sediment subsample (g), C is the wet weight of the first sediment subsample per volume (g cm-3), D and E are the wet and dry weights of the second sediment subsample
(g), F is the actual weight of the water contained in the sediment (g), G is the percentage of water (%) and H is the dry weight of sediment per volume (g dry sed. cm-3). Finally, in
order to present the results in cysts per g of dry sediment (cysts g-l dry sed.), the cysts cm-3 value was divided by the fourth equation (H). We also present the cyst relative abundances (%
=
(number of cysts for a given species per total number of cysts for a given port)*
1 00)).The subsamples were placed into an ultrasonic bath (VWR international model SOT) for two minutes to deflocculate the sediment before sieving, following the method described by Matsuoka and Fukuyo (2000). Samples were then sieved onto 100 and 20 !-lm Nytex membranes with filtered seawater (0.45 !-lm). The coarse fraction (> 100 !-lm) was discarded and the 20-100 !-lm fractions was kept and transferred into a 50 ml beaker using a wash bottle. Fine particles were suspended and concentrated by gentle swirling motions. The supernatant was poured on a 20 !-lm mesh Nytex membrane then transferred into a Petri dish (Fisherbrand, 60 x 15 mm). The 20-100 !-lm fractions was observed under an inverted microscope (Nikon Eclipse TE2000-U) at 100X magnification and all the cysts present were counted. Identification was made at 400X magnification with the help of several references from the literature (Rochon et al. 1999, Matsuoka and Fukuyo 2000, Head et al. 2001, Marret and Zonneveld 2003, Matsuoka et al. 2009) or with the use of a scanning electron microscope (SEM). When possible, the cysts were identified to the species level. Unknown cysts were isolated and incubated in multi-well plates (COSTAR®3524, Corning Incorporated) with f/2 medium without silica (Guillard and Ryther 1962, Guillard 1975) to try to identify the vegetative form of the unidentified cyst.
15
1.2.3.4. Statistical analysis
Prior to the laboratory analysis, all samples (i.e. 3 replicates (A, B, C) x 6 sites x
8 ports) were randomly divided into three groups, each group containing one of the three
replicates from each sample site. In order to obtain an estimate of the dinoflagellate cyst concentrations and species richness in the ports we did a preliminary analysis of the first group. This preliminary analysis revealed that 4 ports had the highest cyst concentrations: Sheet Harbour, Shelburne, Sydney, and Halifax (ranging between 10275 and 83 351 cysts g_1 dry sed.) (Table l.2). Since microscopy is time-consuming, we decided to examine all three replicates only for samples from these 4 ports. Results of the preliminary
analysis from the eight ports were used to compare the diversity and specific abundances
between the ports. Results from the 4 selected ports were used to evaluate the variation in diversity and specific abundances within a given port.
Non-metric multidimensional scaling (nMDS) and cluster analyses were used to examine
the cyst assemblages between and within the ports. nMDS results were done with a Bray Curtis similarity index for the dinoflagellate cyst assemblages after a fOUlih root transformation. These analyses were do ne with PRIMER · 6 with PERMANOVA+
(PRIMER-E ltd 2008). A linear regression was used to test the influence of shipping traffic
(i.e. number of ships and volume of ballast water discharged) on the average concentrations and species richness of dinoflagellate cysts. Alllinear regressions were performed in JMP 7 (SAS Institute 2007).
1.2.4. RESULTS
A total of 53 dinoflagellate cyst taxa were observed throughout the eastern and south-eastern coast of Nova Scotia, including Cape Breton, 36 of which were identified to
the species level. Two of these species are from dinoflagellates known to produce toxins:
the cysts of the Alexandrium tamarense complex (i.e., Alexandrium tamarense, A.
shellfish pOlsomng (PSP), and Operculodinium centrocarpum (= Protoceratium reticulatum) can pro duce yessotoxin (YTX) (Satake et al. 1997). AIso, Scrippsiella trochoidea is known to produce hannful algal blooms (HAB). In addition, we identified 10
taxa to the genus level (e.g. Brigantedinium spp.) and 7 taxa remain unidentified (labelled
unidentified cyst A, B, C, etc.). Table 1.2 gives the complete list of the dinoflagellate cyst
species with their average abundance in cysts per gram of dry sediments (cysts
il
dry sed.) and their relative abundance (%) found in this study.17
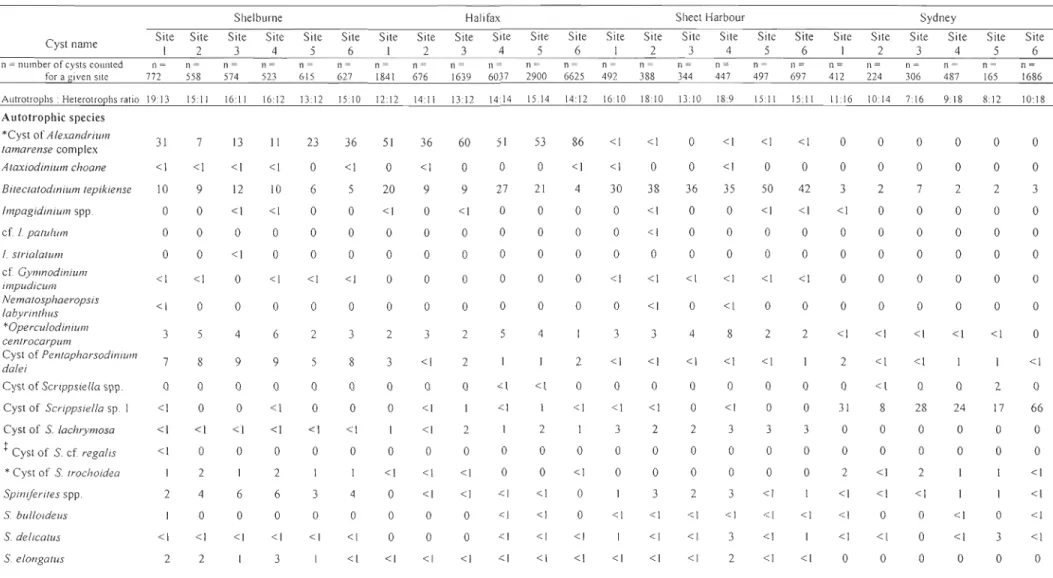
Table l.2. Dinoflagellate cyst average concentration (cysts g-I of dry sed.) with standard deviation (SD) and relative abundance (%
=
(number of cysts for a given species/total number of cysts for a given port) * 1 00)) in the eight Nova Scotia ports with the number (n)
of cysts counted for a given port. (*Harmful/toxie speeies. tPotentially exotie and/or toxie speeies)
Cyst name Il = number of cysts counted for a given site
Autotrophs : Heterotrophs ratio Autotrophic species 'Cyst of A/exandrium tamarense complex Ataxiodinium choane Bilectalodinium lepikiense Impagidinium spp. cf 1. palu/um 1. stria/alum cf Gymnodinium impudicum Nematosphaeropsis labyrinthus 'Opercu/odinium cenlrocarpum Cyst of Pen.tapharsodin.ium da/ei
Cyst of Scrippsiella spp. Cyst of Scrippsiella sp. Cyst of S. /achrymosa tCyst of S. cf. regalis 'Cyst of S. trochoidea Spiniferites spp. S. bulloideus S. de/icatus Yarmouth Av. conc. ±SO Rel. abund. (%) Il = 1199 4:7 108 ± 50 8 O± 0 0 O±O 0 O±O 0 o±o 0 O±O 0 o ± 0 0 o ± 0 0 8 ± 12 < 1 o ± 0 0 O± 0 0 1±2 <1 O±O 0 O±O 0 ll±ll O±O O±O O±O < 1 o o o Shelburne Av. conc. ± SO Rel. abund. (%) n = 4030 21 : 16 3197 ± 2322 28 ± 20 1298 ± 569 2±3 O±O 1±2 20± 19 2±4 560 ± 184 1096±265 O±O 13 ± 24 43 ± 28 2±4 216± 61 563 ± 123 54 ± 132 60 ± 52 <1 9 < 1 o <1 <1 <1 4 7
o
< 1 <1 <1 4 <1 <1 Liverpool Av. conc. ± SO Rel. abund. (%) n = 1414 12: 10 9 ± 14 O±O I±O O±O O±O O±O O±O O±O 51±117 O±O O±O O±O 5 ± 12 O±O 67 ± 91 O±O 5 ± 12 O±O < 1 o o o o o o o oo
o < 1 o o <1 o Halifax Av. cone. ± SO Il = 14460 18: 17 57959 ± 82 072 Rel. abund. (%) 70 Sheet Harbour Av. cone. ± SO n = 1851 20: II 28 ± 28 Rel. abulld. (%) < 1 3±4 <1 3±6 < 1 10659 ± 10962 13 4057 ± 2089 39 4±6 < 1 3±4 < 1 O±O 0 2±3 < 1 O±O 0 O±O 0 o ± 0 0 42 ± 36 < 1 O±O 0 4±9 <1 2068±2140 2 320±72 3 1300 ± 1463 2 84 ± 50 < 1 27 ± 56 < 1 0 ± 0 0 516 ± 522 < 1 5 ± 5 < 1 1139 ± 1192 254 ± 117 2 O±O 0 O±O 0 21 ± 28 42 ± 50 10±24 19± 27 < 1 < 1 <1 <1 O±O 176 ± 80 32 ± 27 102 ± 56 o 2 <1 <1Canso Strait Little Narrows Av. cone. ±SO Rel. abund. (%) Av. conc. ±SO Rel. abund. (%) n = 1319 n = 516 Il : 8 8±22 O±O 104 ± 96 O±O O±O O±O O±O O±O O±O 10 ± 13 50± 50 50 ± 24 O±O O±O 483 ± 748 15 ± 22 5±9 II ±21 8:9 < 1 O±O o 0 ± 0 5 322± 168
o
O±O o 0 ± 0o
0 ± 0 o O±O o 14 ± 17 o O±O < 1 O± 0 2 O± 0 2 268 ± 491o
O±O o 0 ± 0 24 II ± 18 o o 15o
o o o < 1 o o o 13 oo
< 1 < 1 < 1 159 ± 207 8 15 ± 31 < 1 < 1 7±11 <1 Sydney Av. conc. ± SO n = 4375 13: 19 O±O Rel. abund. (%) o O±O 0 492 ± 453 3 O±O < 1 o ± 0 0 o ±O 0 O±O 0 o ± 0 0 17± 17 < 1 133 ± 109 < 1 12 ± 25 < 1 7230 ± 12202 43 O±O 0 O±O 0 162 ± 128 92± 55 6±6 43 ± 38 <1 < 1 < 1 < 1counted for a given port. (*Harmful/toxic species. tPotentially exotic and/or toxic species) CyS! name n ~ number of cysts counted for a given site S elongatus Sfrigidus S hyperaeanlhus S membranaceus S mirabilis S ramosus Heterotrophic species Brigantedinium spp. B. eariaeoense B. irregu/are B. simplex tCoeh/odinium sp. tCoeh/odinium sp. 2
Dubridinium len/ieu/alum Dubridinium sp. 1 t Eehinidinium sp. t Eehinidinium sp. 2 1. minutum Lejeunecysta cf. sabrina CyS! of Po/ykrikos kofoidii CyS! of Proloperidinium spp. Yarmouth Av. conc. ±SD Rel. Abund. (%) n= 1199 O±O O±O O±O O±O O±O O±O 797±518 112± 83 O±O 253 ± 187 O±O O±O 1 ±3 35 ± 35 O±O 15 ± 12 O±O O±O O±O O±O o
o
o oo
o 59 8 o 19 o o < 1 3 o o oo
o Shelbume Av. conc. ± SD Rel. abund. (%) n = 4030 265 ± 130 599 ± 480 O±O 107 ± 76 14 ± 13 95 ± 31 2769 ± 1207 242 ± 117 O±O 2079 ± 691 O±O O±O 226 ± 60 44 ± 33 22±27 320 ± 85 12± 17 6±8 58 ± 52 O±O 2 4 o < 1 < 1 < 1 18 2 o 14 o o <1 < 1 2 < 1 < 1 <1 o Liverpool Av. conc. ± SD Rel. abund. (%) n= 1414 I±O 2±0 3±0 4±0 3±8 II ±20 2491 ± 1672 556±451 O±O 1439 ± 1394 O±O O±O 3±7 22 ± 55 O±O II ± 13 O±O 3±8 3±7 O±O o o o o <1 < 1 53 12o
31 o o <1 <1 o < 1 o < 1 < 1 o Halifax Av. COIlC. ± SD n = 14460 150± 162 356 ± 366 O±O 15 ± 18 87 ± 90 57 ± 56 3175 ± 1371 892 ± 425 2±5 1047 ± 623 1±3 12 ± 18 45 ± 37 821 ± 685 7 ± 16 439 ± 215 100± 184 162± 171 720 ± 887 O±O Rel. abllnd. (%) < 1 < 1 o < 1 < 1 <1 4 <1 < 1 < 1 < 1 <1 < 1 < 1 < 1 < 1 < 1 o Sheet Harbour Av. cone. ± SD Rel. abund. (%) n = 1851 66 ± 30 165 ± 66 O± 1 817 ± 602 40±29 96 ± 52 1405±519 144 ± 57 O±O 1523 ± 408 O±O O±O 71 ±29 185 ± 118 196 ± 116 289± 101 O±O 6±8 21 ± 23 O±O < 1 2 < 1 8 < 1 < 1 14 o 15 o o < 1 2 2 3 o < 1 <1 o Canso Strait Av. cone. ±SD Rel. abllnd. (%) n = 1319 O±O O±O O±O 2±6 O±O 19± 17 310±221 55 ±47 o o o < 1 o <1 15 3 2±4 <1 530 ± 493 26 2± 5 < 1 O±O 0 19 ± 18 O±O O±O 12±24 O±O O±O O±O O±O < 1 o o <1o
oo
o Little Narrows Rel. Av. eone. abllnd. ± SD (%) n = 516 O±O O±O O±O O±O O±O 2±6 170± 149 26 ± 36 O±O 12± 15 36 ± 63 O±O 18 ± 30 O±O O±O O±O 3±8 O±O O±O O±O o o o o o < 1 8 o < 1 2 o < 1 o o o <1 o o o Sydney Av. eone. ± SD n = 4375 O±O O±O O±O 1±9 8±9 23±23 2755 ± 1629 144± 129 O±O 1062 ± 519 186± 206 6±6 181 ± 130 92± 39 35 ± 32 2333 ± 1766 214± 150 57 ± 55 5±8 II ±26 Rcl. abund. (%)o
o
o < 1 < 1 < 1 16 < 1o
6 < 1 < 1 < 1 14 < 1 < 1 < 119
Table 1.2 (continued). Dinoflagellate cyst average concentration (cysts g-I of dry sed.) with standard deviation (SD) and relative abundance (% = (number of cysts for a given species/total number of cysts for a given port) * 100)) in the eight Nova Scotia ports with the number (n) of cysts counted for a given port. (*Harmful/toxic species. tPotentially exotic and/or toxie speeies)
Cyst name
n = number of cysts counted
for a given site
Cyst of P. americanum Cyst of P. nudum
Cyst of P. stellatul11 Quinquecuspis concreta Se/enopemphix nephroides
S. quanta
Votadinium calvum V spinosum
Unidcntificd cysts
Unidentified cyst A
Unidcntified cyst B
Unidentified cyst C
Unidentified cyst D
Unidentified cyst E Unidentified cyst F
Unidentified cyst G Yarmouth Av. conc. ±SD Rel. abund. (%) n = 1199 O±O O±O O±O O±O O±O 2±4 O±O O±O 3±6 O±O O±O 1±2 O±O 1 ± 1 O±O o o o o o <1 o o <1 o o <1 o <1 o Shelbume Av. conc. ± SD Rel. abund. (%) n = 4030 529 ± 254 3±5 6 ± Il 2±4 O±O 469 ± 103 4± 10 O±O 3±8 O±O O±O O±O O±O O±O O±O 4 < 1 <1 < 1 o 3 <1 ·0 <1 o o o o o <1 Liverpool Rel.
Av. conc. ± abund.
SD (%) n = 1414 II ± 13 O±O O±O O±O O±O 22±39 O±O O±O O±O O±O O±O 5 ± 12 O±O 1±2 O±O < 1 o o o o <1 o o o o o <1 o <1 o Halifax Av. conc. ± SD n = 14460 241 ± 204 69 ± 102 1 ± 1 O±O O±O 699 ± 623 o±o o±o 84 ± 187 38 ± 47 O±O 349 ± 566 10 ± 23 4± 10 O±O Rel. abund. (%) <1 < 1 < 1 o o <1 o o <1 < 1 o < 1 <1 <1 o Sheet Harbour Av. conc. ± SD Rel. abund. (%) n = 1851 73 ± 47 O±O O±O O±O O±O 64 ± 31 O±O O±O O±O O±O O±O O±O O±O O±O O±O < 1 o o o o < 1 o o o o o o o o o Canso Strait Av. conc. ± SD Rel. abund. (%) n = 1319 19± 16 O±O o±o o±o o±o o±o o±o o±o 165 ± 87 o±o 157 ± 91 O±O O±O o±o 5±6 < 1 o
o
o o o o o 8 o 8 o o o < 1 Little Narrows Av. conc. ±SD Rel. abund. (%) n = 516 O±O 3±8 2±6 o±o o±o O±O 7 ± 18 o±o 480 ± 645 O±O 520 ± 395 O±O O±O O±O O±O o < 1 <1 o o o < 1 o 23 o 25 o o o o Sydney Av. conc. ± SD n = 4375 63 ± 64 29 ± 33 4±7 O±O 32± II 43 ± 29 23 ± 33 O±O 1047 ± 1225 O±O 137±109 16± 16 o±o o±o 171±381 Rel. abund. (%) < 1 < 1 < 1 o < 1 < 1 < 1 < 1 6 o < 1 < 1 o oMDS ordination of dinoflagellate cyst assemblages among the ports included in this
survey shows that there were three distinct groups of ports: group 1 (Yarmouth and
Liverpool), group 2 (Shelburne, Halifax and Sheet Harbour) and group 3 (Canso Strait,
Little Narrows and Sydney) (Figure 1.3). Apart from Sydney, aIl the other ports shared a
60% similarity level. Only the ports of Shelburne and Sheet Harbour shared a 70%
similarity between their cyst assemblages. The low stress value of 0.01 indicates that the ordination respects relatively weIl the distances between the different assemblages. In group 1 (Yarmouth and Liverpool), the average cyst concentration is 3032 ± 2383 cysts g-I
dry sed. (Table 1.1) and the cyst assemblages were dominated by the Brigantedinium
group. In Yarmouth, the cyst of the Alexandrium tamarense complex represented the most important accompanying species. The dinoflagellate cyst assemblages in the second group
of ports (Shelburne, Halifax and Sheet Harbour) were characterized by the presence of four
dominant generalspecies: the Brigantedinium group, the cyst of the Alexandrium tamarense
complex, Bitectatodinium tepikiense and the Spiniferites group. The average dinoflagellate
cyst concentration for this group was 34128 ± 41 318 cysts g-I dry sed. FinaIly, in the third group of ports (Canso Strait, Little Narrows and Sydney), the average cyst concentration was 15 193 ± 13 578 cysts g-I dry sed. and the dinoflagellate cyst assemblages were mainly
composed of the Brigantedinium group, the cysts of Scrippsiella group, the unidentified cysts (unidentified cyst A, C, D and G) group and B. tepikiense. Ali of these, with the
exception of the cysts of Scrippsiella group (undetectable with standard palynological
methods - see above) have been found in other studies from the same region (e.g. de Vernal et al. 1997, Rochon et al. 1999, Devillers and de Vernal 2000).
A)
B)
Unidentified cysts group
/
2
/
/H~i~;x"
.
./ \ / / ,-'/·
···~·~e
l
bU;
;~
·~
//
.Jo'
1 : ..-1 ShÉ\etlHarbour ,... ... ; < •. " ... . . . .. .. . . :;, •• :./ 1 1 1 . 1 IYBI'moutl) \ . '. ... ,_. / Group 1 • Yarmouth-
, / Sydney ( -"-"-" -Group 2 • Shelburne o Halifax 20 Stress: 0,01 SimiJarily --503
"'\
\
1 --_ .. 60 ··· .. ···70 21 Group 3 • Canso Strait SpÎniferites group GJLiverpool o Little Narrows
o Sheet Harbour
III
QJ
SeJenopemphix quanta o Sydney
,) QJ 0. III
-
III >. Scrippsiela group Cyst of Protoperidinium americanum U Cyst of Pentapharsodinium ~ dalei ~ru Operculodinium centrocarpum
Cl ra
'l5 Echinidinum delicatum c: ë5 Dubn'dinium sp. 1 Briganfedinium group Bilectatodinium tepikiense Alexandrium spp. o 20 40 60 80 1000 20 40 60 80 100 0 20 40 60 Relative abundances (%)
Figure 1.3. A) nMDS results using a Bray Curtis similarity index for the dinoflagellate cyst
assemblages of the eight sampled ports after a fourth root transformation; B) relative
abundances (5) of the dominant dinoflagcllate cysts for the 3 groups ofports.
Dinoflagellate cyst assemblages found in the eight ports (Table 1.2) shows sorne general trends when it cornes to the dominant (i.e. single species or group of species representing more than 90% of the assemblage) and accompanying species (i.e. species representing more than 1% but less than 90% of the assemblage) (see Figure 1.3B). For example, the Brigantedinium group, which comprises Brigantedinium spp., B. cariacoense, B. irregulare and B. simplex, was part of the dominant group in 6 of the 8 ports (Yarmouth, Shelbume, Liverpool, Sheet Harbour, Canso Strait and Sydney). Sorne species were also found in all the ports. For instance, the Brigantedinium spp. group represented 6 to 95% of the dinoflagellate cyst assemblages in all of the ports. The cysts of Scrippsiella spp. group (Scrippsiella spp., Scrippsiella sp. 1,
S.
lachrymosa,S.
cf. regalis andS.
trochoidea) were also present in alI the ports. Their relative abundance ranged from <1 % to 44% in the ports of Yarmouth and Sydney respectively. However, the maximum relative abundances for that group were found in Cape Breton: Canso Strait (29%), Little Narrows (13%) and Sydney (44%). Another species found throughout Nova Scotia, with the exception of Yarmouth, was Bitectatodinium tepikiense. Its relative abundance ranged from <1% to 39% in the ports of Liverpool and Sheet Harbour respectively. Finally, although found at a relatively low abundance in a few ports «1% in Liverpool, Sheet Harbour and Canso Strait), the cysts of the Alexandrium tamarense complex were present throughout the eastem and south-eastem shores of Nova Scotia, with the exception of the ports of Little Narrows and Sydney.The number of dinoflagellate cyst taxa found in each port ranged from 14 to 40. The highest values of species richness were found for the ports of Shelbume (39) and Halifax (40) (Table 1.1). The average concentration of dinoflagellate cysts in the ports ranged from 1346 to 83 351 cysts g-l dry sed., and the highest concentrations were found in Sydney (16869 cysts g-l dry sed.) and Halifax (83351 cysts g-l dry sed.) (Table 1.1). Table l.1 also gives the number of ships visiting each port as well as the volume in metric tonnes (MT) of ballast water being discharged in the ports, including volumes of non-exchanged and exchanged ballast water (for the year 2006).
23
To examine the influence of shipping traffic, the average cyst concentrations were regressed against the number of ships visiting the ports studied. Linear regression shows that there was a highly significant influence of the number of ships on the average concentrations of dinoflagellate cyst (average cyst concentrations
=
3829.6 - 69.89*
number of ships; r2 = 0.89; ANOV A model: F 1,6 = 24.27 ; p = 0.003) (Figure l.4a) but not between the number of ships and the number of dinoflagellate cyst species (species richness) observed in the ports (species richness = 24.86
+
0.01*
number of ships; r2 = 0.21; ANOVA model: F1,6 = 1.60; P = 0.25) (Table 1.1). Results also show that there wasno influence of the discharged volume of ballast water (irrespective of whether ballast water was exchanged or not during the trip) on the average cyst concentrations (average cyst concentrations
=
15 502.92+
0.001*
discharged ballast volume; r2=
0.01; ANOVA model: F1,6 = 0.07; P = 0.80) nor on the species richness index (species richness = 27.80 -2.92e-7*
discharged ballast volume; r2 = 0.003; ANOVA model F1,6 = 0.02; P = 0.89) (Table 1.1). There was no influence of the discharged volume of ballast water from ships that undertook a ballast water exchange on the average dinoflagellate cyst concentrations or the species richness index (Table 1.1). However, when considering only the ships that did
not undertake a ballast water exchange (domestic traffic), there was a highly significant influence of the discharged volume of ballast water on the average dinoflagellate cyst concentrations (average cyst concentrations
=
4585.77+
0.09*
non-exchanged ballast volume; r2 = 0.86; ANOVA model: F1,6 = 13.55; P = 0.01) (Figure l.4b) but not on the
species richness index. However, these significant relations were influenced strongly by the results from one port: Halifax, which receives the greatest number of domestic traffic ships among aIl the ports considered here, and had the highest cyst concentrations.
Al Bl 110' 1 10' ....,. - -y = 4585.77 + 0.09x c' = 0.86 P = 0.01 ....,. - y = 3829.6 -69.89x r' = 0.82 P = 0.003 "0 "0 ID ID (/) ~ 810'
•
(/) ~ 810'•
"0 "0 ~ .!?' (/) U) 610' U) 610' >- >-oS. oS. ë 410' ë 410' ID ID U U C c 8 0 u•
U) 210· U) 210· >- >-U U ,; ,; <{ <{ 0..
1•
1 1 1 200 400 600 800 1000 1200 0 250 500 750 1006 210' 410' 610' 810'Number of ships (years 2005-2006) Volume of non-exchanged ballast water (MT)
Figure 1.4. Results from the linear regressions between A) the number of ships and the
average concentration of dinoflagellate cysts (cysts g-l dry sed.), and B) the volume of non-exchanged discharged ballast water in metric tonnes (MT) and the average concentration of dinoflagellate cysts (cysts g-l dry sed.). Note that the scales of the x axis are different.
The spatial distribution of dinoflagellate cysts within ports was examined only for the
four ports that had the highest species richness index as weil as the highest cyst
concentrations: Shelbume, Halifax, Sheet Harbour and Sydney. The average concentration
of dinoflagellate cysts (cysts g-l dry sed.) and the species richness for each of the sites and ports are found in Table 1.3 while the relative abundances of cyst species are shown in
Table 1.4. Figure 1.5 gives the c1uster results from the non-metric MDS ordination of
dinoflagellate cyst assemblages. It shows that the similarity between the sites within ports varies between 65% (for Sydney, station lying outside the 70% similarity outline in Figure 1.5) and 80%. The relatively low stress value of 0.07 indicates that the ordination
+
•
•
25
2D Stress: 0,07 Ports
Il. Sheet Harbour
T Halifax
o
Shelburne • Sydney Similarity - - - -70 ---80Figure 1-5. nMDS results using a Bray Curtis similarity index for the dinoflagellate cyst
assemblages for the ports of Halifax (T), Sydney (+), Shelburne (0) and Sheet Harbour (,6.)
(6 sites ports-1) after a fourth root transformation.
Within the port of Shelburne, the average cyst concentrations ranged between 9552
and 21 963 cysts g-l dry sed. for sites 4 and 1 respectively; species richness ranged between
25 and 33 for sites 5, 6 and 1 respectively (Table 1.3). The similarity between sites 2, 3, 4,
5 and 6 reached 85% (not shown in Figure 1.5); site 1 shares an 80% similarity with the
other sites. The differences between the sites reside in the difference between the
assemblages, either in the cyst concentrations or the species diversity. For example, the
cysts of the Alexandrium tamarense complex are not part of the dominant species at site 2
and Bitectatodinium tepikiense is not considered a dominant species at sites 5 and 6 (see
Table 1.3. Within-port cyst information: average concentration (cysts g-I dry sed.) with standard deviation (SD) and species richness (number of species observed) per sampling site for the ports of Shelburne, Halifax, Sheet Harbour and Sydney.
Shelburne Halifax Sheet Harbour Sydney
Sites Av. eoneen!. ± Species Species Av. concen!. ± Species Species
SD richncss Av. coneen!. ± SD richness SD richness Av. eoneen!. ± SD richness
Site 1 21 963 ± Il 964 33 25279 ± 21 700 27 Il 547 ± 4069 26 14 758± 13270 31 Site 2 15 199 ± 9029 26 Il 131 ± 5010 29 12670 ± 2870 28 14 198± 15505 28 Site 3 12966 ± 3798 27 29435 ± 8649 28 5940 ± 2266 23 6153 ± 580 26 Site 4 9552 ± 4300 29 113 377 ± 35 540 29 4593 ± 2922 27 14417 ± 8591 29 Site 5 18401 ± 1279 25 64 168 ± 31 360 32 14575 ± 6832 26 3329 ± 2584 23 Site 6 12 125 ± 1698 25 256715 ± 172 838 27 12327 ± 5542 26 48359 ± 52141 31
The average cyst concentrations ln the port of Halifax ranged from Il 131 to
256 715 cysts g-I dry sed. for sites 2 and 6 respectively, and the species richness varied between 27 in sites 1 and 6 and 32 in site 5 (Table 1.3). As seen in Figure 1.5, the similarity between the sites in Halifax was 70% but two groups of sites (sites 1 and 3 and sites 4, 5 and 6) shared a similarity of 80%. In this pOli, the cysts of the Afexandrium tamarense
complex were part of the dominant species at al! sites. It was the only dominant species for
site 6 with a relative abundance of 86%. Bitectatodinium tepikiense was also a dominant species for sites 1, 4 and 5. For sites 2 and 3, the other dominant species was the
(/) t o 0... "'" ~ SiteS C 511(14 ~ Silo) U) SiUJ1 x ~ ro l "," """ s.:...s S.W..l. $4"2. S,"" • Alexandrium spp. s.ik!_ ~ SiteS C SiteS ~ Sote4 Cf) Soto) ~ :::J <1J 0 <1J .o .c: ~ (/) ro l Site 2 , ... " 1 ~,,' 1 $M'~ 1 s.w" :>o1~:1 1 ~", 1 .... ' 1 X SîI6-S ~ Siù;o" ro Sitol l SM' <1J E :::J .0 di .c: (/) ''" , s'., 1 S;:~S • %., 1 S"('3 1 50:,,] • s.:e11 Cysl of P. americanum
BitectalodinMJm tepi~ierœ Brigantedinium group
1 1 1
•
1 1-
--
1-•
•
r-I• •
•
•
1•
•
•
•
Cysl of P. aalei;--
1•
1-
---
SeJenopemphix quanlaEchinidinium delicatum Is/andinium minulum 1
-;...
-
1 1 1 1 1 1 1•
1 1 1 1 1 1 1CyS! of SoippSella group
-•
-1 1 1 1 1 1 1 1 1 1 1 1 1 1 1 1 1 1 1 1 1 1 1 1 1 1 1 1 1Spiniferites 9 lOUp
•
•
•
•
--•
•
--
•
Relativeabundances (%) 27 OpefcuJodinium centfocarpum 1 1•
1 1 1 1 1 1 1 1 1 1 1 1 1 1 1Unldenllfied cyg group
•
1 1--
1 1Figure 1.6. Relative abundances (%) of the dominant dinoflagellate cyst taxa for each site
in the port of Shelbume, Halifax, Sheet Harbour and Sydney.
In Sheet Harbour, the average cyst concentrations varied between 4593 and 12 670 cysts g-I dry sed. in sites 4 and 2 respectively, while the species richness varied between 23
and 28 in sites 2 and 3 respectively (Table 1.3). Like the port of Shelburne, the similarity
between the six sites of the port of Sheet Harbour reached 80% (Figure 1.5). However there were two groups of sites that shared an 85% similarity level (not shown in Figure 1.5): sites 3 and 4 and sites 1, 2, 5 and 6. Two species mostly dominated the assemblages of aIl the sites: Bitectatodinium tepikiense and the Brigantedinium group. The Spiniferites group (i.e.
Spiniferites spp., S. bulloideus, S. delicatus, S. elongatus, S. frigidus, S. hyperacanthus, S.
membranaceus, S. mirabilis and S. ramosus) was also part of the dominant species but only
for sites 1, 2 and 4 (Figure 1.6).
The average cyst concentrations in the port of Sydney varied between 3329 and 48
359 cysts gol dry sed. at sites 5 and 6 respectively. The species richness varied between 23 at site 5, and 31 for sites 1 and 6 (Table 1.3). This port had the lowest similarity index of
the four ports examined with values ranging between 65 and 70%. Site 5, located a few kilometres away from the others (see Figure 1.2), shared only 65% similarity with the rest
of the sites. For aIl six sites, the Brigantedinium group was part of the dominant species and it was accompanied either by Echinidinium sp. 2 at sites 1, 2, 4 and 5, or by the cyst of Scrippsiella group at sites l, 3, 4, 5 and 6, or by the unknown cyst group (i.e. unidentified