Low Production Temperatures
by
Simone RASCHIA
MANUSCRIPT-BASED THESIS PRESENTED TO ÉCOLE DE
TECHNOLOGIE SUPÉRIEURE IN PARTIAL FULFILLMENT OF THE
DEGREE OF DOCTOR OF PHILOSOPHY
Ph.D.
MONTREAL, SEPTEMBER 28, 2020
ÉCOLE DE TECHNOLOGIE SUPÉRIEURE
UNIVERSITÉ DU QUÉBEC
This Creative Commons licence allows readers to download this work and share it with others as long as the author is credited. The content of this work can’t be modified in any way or used commercially
BOARD OF EXAMINERS
THIS THESIS HAS BEEN EVALUATED BY THE FOLLOWING BOARD OF EXAMINERS
Mr. Daniel Perraton, thesis director
Department of construction engineering at École de technologie supérieure Mr. Alan Carter, thesis co-director
Department of construction engineering at École de technologie supérieure Mr. Andrea Graziani, thesis co-director
Department of civil and building engineering, and architecture at Università Politecnica delle Marche
Mr. Éric David, President of the Board of Examiners
Department of mechanical engineering at École de technologie supérieure Mr. Michel Vaillancourt, Member of the jury
Department of construction engineering at École de technologie supérieure Mr. Emmanuel Chailleux, Member of the jury
Institut français des sciences et technologies des transports, de l’aménagement et des réseaux
THIS THESIS WAS PRESENTED AND DEFENDED
IN THE PRESENCE OF A BOARD OF EXAMINERS AND PUBLIC ON SEPTEMBER 9, 2020
ACKNOWLEDGMENTS
There are no good students, only good teachers, and I can certainly say that mine were not only leaders to refer to, but real guides who have enlightened the way in the past years. Thanks to Prof. Daniel Perraton, who with his wisdom and fighting spirit hasn’t let me doubt of myself even one day. Thanks to Prof. Alan Carter, who taught me that having a messy office is simply a symbol of great passion. Last but not the least, thanks to Prof. Andrea Graziani, for having initially thought of me to send to Canada, and teaching me over time the importance of the details that really make the difference. Everything you have taught me will not be lost and I promise to always follow your example.
Thanks to Mr. Emmanuel Chailleux, Mr. Michel Vaillancourt, and the jury president Mr. Éric David for being jury members for my doctoral thesis.
My family never imagined they'd find themselves in such an adventure, I know that. And for that I thank them tremendously, for always supporting me and opening their minds to understand how to make me feel better. Thanks to Marta, probably the person who listened to me the most and understood me for all these years. Everyone deserves to have their loved one by their side, and while I will miss my life here in Canada, I am sure an even more exciting life is waiting for me with you.
Thanks to all the friends of ÉTS, Francis, Sylvain, Sébastien, Appu, Marc-André, Mounir, Amir, Djalil, Ehsan, Quentin, Charles, Reza, Saeed B., Saeed S., for making every day of work a party, and for making these three years fly. I will never forget you.
Thanks to my italian support team, Davide, Chiara M, Chiara O, Petala, Patty and Giorgio, which were always there for everything and became my family on the other side of the ocean.
Matériaux traités au ciment et bitume (MTCB) pour les régions froides:
source de granulats GBR et basses températures de production
Simone RASCHIA
RÉSUMÉ
L'augmentation du prix du bitume due à la crise énergétique des dernières années a entraîné le développement de technologies rentables de recyclage des revêtements en enrobé bitumineux. La disponibilité limitée de granulats naturels, l'augmentation des coûts d'élimination des matériaux provenant des chaussées et la sensibilisation politique croissante aux questions environnementales favorisent fortement les techniques de recyclage, telles que le recyclage à froid (cold recycling - CR) et la réutilisation des granulats bitumineux recyclés (GBR). Dans ce contexte, les matériaux traités au ciment et bitume (MTCB) sont prometteurs en termes de fiabilité, de rentabilité et de développement durable. La principale différence entre le MTCB et l’enrobé bitumineux à chaud (hot mix asphalt - HMA) est que l'effet lubrifiant dans le premier cas est donné principalement par l'eau, tandis que dans le second cas il est donné par le bitume chauffé. De plus, la cohésion du MTCB est assurée par l’effet combiné de l'émulsion de bitume (ou de la mousse de bitume) et du ciment comme agents de liaison. Puisque les GBR représentent la composante principale du squelette granulaire du MTCB, une étude portant sur l'effet des différentes sources de GBR quant à l’ouvrabilité et aux propriétés thermo-mécaniques du MTCB est nécessaire pour éclairer le processus de formulation de ce type de matériaux. Par ailleurs, l'expérience terrain a montré que la mise en oeuvre de MTCB à basse température (pendant les saisons froides) semble changer les propriétés mécaniques de ce matériau à long terme. Par conséquent, l'objectif principal de cette thèse est de comprendre l'effet des sources de GBR et des basses températures de mise en oeuvre sur les propriétés du MTCB. Les résultats ont montré que la source GBR influence effectivement plusieurs propriétés des MTCB. En fait, les caractéristiques du liant du GBR, ainsi que son affinité avec le bitume résiduel de l'émulsion, affectent les propriétés des MTCB lors de la production (maniabilité et compactabilité), et aussi pendant et après la cure, où on a observé une influence sur les propriétés mécaniques dans les domaines de petite et de grande déformation. En outre, les caractéristiques de l'émulsion de bitume influencent le processus de production à basse température. Les résultats ont montré que la production de ces matériaux à 5 °C (malaxage, transport, mise en place, compactage et cure) était possible. De cette manière, le temps disponible pour la production de MTCB au cours de l'année augmente, mais, par contre, une perte de rigidité à long terme de 30% a été observée par rapport aux MTCB produits à 25 °C. Il convient d'en tenir compte lors de la conception des chaussées.
Mots clés : Recyclage à froid, Source du GBR, Production, Cure, Basses températures,
Cement-bitumen treated materials (CBTM) for cold regions: RAP
aggregate source and low production temperatures
Simone RASCHIA
ABSTRACT
The increase of asphalt price due to the energy crisis of the last years drove the development of cost-effective asphalt pavement recycling technologies. The limited availability of natural aggregates, the growing awareness about the environment and the increasing costs for handling milled materials, required innovative sustainable technics, such as cold in-place recycling (CIR) and the reuse of reclaimed asphalt pavement (RAP). In this context, cement-bitumen treated materials (CBTM) ensure benefits in terms of reliability, cost-effectiveness and environmental sustainability. The main difference between CBTM and Hot Mix Asphalt (HMA) is that the lubricant effect in the first is given mostly by the water, while in the second case it is given by the heated bitumen. At the same time, the cohesion of CBTM is granted by the cooperation of bitumen emulsion (or foamed bitumen) and cement as binding agents. Since the RAP aggregate are the major component of the aggregate volume, it is believed that a study on the effect of different RAP sources is needed to improve the mix design process. Moreover, field experience shows that CBTM laydown at low temperatures (during cold seasons) seems to suffer a loss in mechanical properties. Hence, the main objective of this thesis is to understand the effect of RAP sources and of low production temperatures on CBTM properties. Results have shown that the RAP source does influence several CBTM properties. In fact, the RAP binder characteristics, as well as its affinity with the residual bitumen used in the emulsion, affect the properties of cold recycled materials not only during production (workability and compactability), but also during and after the curing period, where influence on the mechanical properties in the small strain and large strain domains were observed. Furthermore, the bitumen emulsion characteristics influence the production process at low temperatures. Results showed that the production of such materials at 5 °C (intended as mixing, transportation, laydown, compaction and curing) was possible. In this way the time available for production during the year increases, but, on the other hand, a stiffness loss of 30% was observed compared to mixtures produced at 25 °C. This should be taken into account during pavement design.
Keywords : Cold recycling, RAP source, Production, Curing, Low temperatures, Mechanical
TABLE OF CONTENTS
Page
INTRODUCTION ...1
CHAPTER 1 LITERATURE REVIEW ...5
1.1 Cold Recycling (CR)...5
1.1.1 Cold Recycled Mixtures (CRM) ... 6
1.1.2 Bitumen emulsions... 8
1.1.3 Foamed bitumen ... 16
1.1.4 Reclaimed asphalt pavement (RAP) ... 17
1.1.5 Ordinary Portland Cement ... 18
1.2 Interaction of bitumen emulsion with mineral aggregates ...21
1.3 Role of mineral additions ...22
1.4 CBTM production and curing ...24
1.4.1 Introduction ... 24
1.4.2 Mixing and compaction ... 26
1.4.3 Curing protocols... 31
1.4.4 Field curing studies ... 32
1.4.5 Laboratory curing for bitumen emulsion mixes ... 33
1.5 Modelling of CBTM properties ...36
1.5.1 Evolutive behaviour ... 36
1.5.2 Visco-elastic behaviour of bituminous materials ... 37
1.5.3 Rheological modelling ... 42
CHAPTER 2 RESEARCH OBJECTIVES AND EXPERIMENTAL PROGRAM ...49
2.1 Research problem ...49 2.2 Objectives ...50 2.3 Experimental approach ...51 2.3.1 Physical properties ... 52 2.3.2 Mechanical properties ... 53 2.4 Materials ...56 2.5 Thesis structure ...57
CHAPTER 3 VOLUMETRIC APPROACH FOR CBTM ...61
3.1 Overview on the volumetric approach for HMA ...61
3.2 Volumetric approach for CBTM mixtures ...62
3.2.1 CBTM composition during compaction ... 63
3.2.2 CBTM composition at the long-term state ... 66
3.3 Practical validation of the volumetric approach ...70
CHAPTER 4 SECTION 1: EVALUATION OF CEMENT-BITUMEN TREATED MATERIALS COMPOSITION ...73
CHAPTER 5 RECYCLED GLASS FILLER IN COLD RECYCLED
MATERIALS TREATED WITH BITUMINOUS EMULSION ...75
5.1 Abstract ...75
5.2 Introduction ...76
5.3 Objectives ...78
5.4 Materials ...78
5.4.1 RAP ... 78
5.4.2 Bituminous emulsion and active fillers ... 79
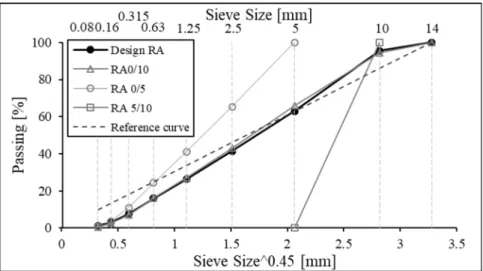
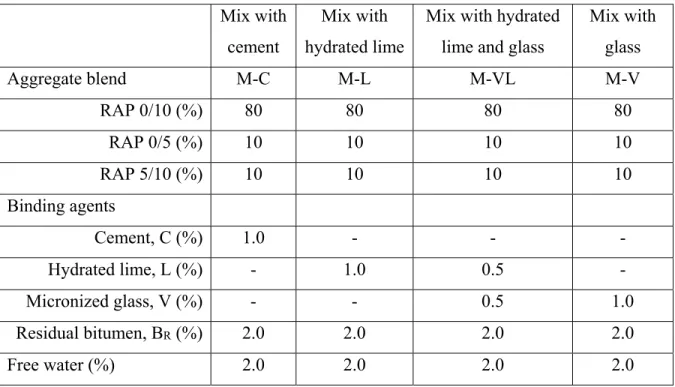
5.4.3 Mix design ... 80
5.5 Test equipment and procedures ...84
5.5.1 Indirect Tensile Strength (ITS) Test ... 84
5.5.2 Indirect tensile stiffness modulus (ITSM) test ... 85
5.6 Results analysis ...86
5.6.1 Indirect Tensile Strength (ITS) Test ... 86
5.6.2 Indirect tensile stiffness modulus (ITSM) test ... 88
5.7 Conclusions ...91
CHAPTER 6 EFFECT OF WATER AND CEMENT CONTENT ON THE MECHANICAL PROPERTIES OF COLD RECYCLED MIXTURES (CRM) WITH BITUMEN EMULSION ...93
6.1 Abstract ...93
6.2 Introduction ...94
6.3 Materials and methodology ...95
6.3.1 Materials ... 95
6.3.2 Mixtures ... 96
6.4 Results analysis ...99
6.5 Conclusions ...102
CHAPTER 7 SUMMARY OF SECTION 1 AND INTRODUCTION OF SECTION 2: INFLUENCE OF RAP AGGREGATE ON CBTM PROPERTIES ...105
7.1 Summary of Section 1 ...105
7.2 Section 2: study of the RAP aggregate effect on CBTM properties ...106
CHAPTER 8 EFFECT OF GRADATION ON VOLUMETRIC AND MECHANICAL PROPERTIES OF COLD RECYCLED MIXTURES (CRM) ...109
8.1 Abstract ...109
8.2 Introduction ...110
8.3 Materials and methods ...113
8.3.1 Mixtures composition ... 113
8.3.2 Mixing and compaction ... 117
8.4 Results and discussion ...120
8.4.1 Workability and compactability ... 120
8.4.2 Mechanical properties and water loss ... 126
8.5 Conclusions ...127
CHAPTER 9 LABORATORY MECHANICAL CHARACTERISATION OF COLD RECYCLED MIXTURES PRODUCED WITH DIFFERENT RAP SOURCES ...131
9.1 Abstract ...131
9.2 Introduction ...132
9.3 Materials and methods ...133
9.3.1 Materials ... 133
9.3.2 Mixtures ... 135
9.3.3 Specimens compaction and curing ... 136
9.3.4 Testing... 140
9.4 Results and discussion ...143
9.4.1 Water Loss ... 143
9.4.2 Indirect Tensile Strength Modulus ... 145
9.4.3 Indirect Tensile Strength ... 146
9.4.4 Semi-Circular Bending Test ... 147
9.5 Conclusions ...149
CHAPTER 10 EFFECT OF RAP SOURCE ON COMPACTABILITY AND BEHAVIOUR OF CRM MIXTURES IN THE SMALL STRAIN DOMAIN ...153
10.1 Abstract ...153
10.2 Introduction ...154
10.3 Analytical models ...156
10.3.1 Compressible Packing Model (CPM) ... 156
10.3.2 Di Benedetto-Neifar (DBN) model ... 159
10.4 Mixtures and methods ...163
10.4.1 Materials and mixtures ... 163
10.4.2 Mixing, compaction and curing ... 165
10.4.3 Experimental program ... 167
10.5 Results and discussion ...169
10.6 Conclusions ...175
CHAPTER 11 SUMMARY OF SECTION 2 AND INTRODUCTION OF SECTION 3: INFLUENCE OF LOW PRODUCTION TEMPERATURES ON CBTM PROPERTIES ...177
11.1 Summary of Section 2 ...177
CHAPTER 12 INFLUENCE OF LOW PRODUCTION TEMPERATURE ON COMPACTABILITY AND MECHANICAL PROPERTIES OF
COLD RECYCLED MIXTURES ...183
12.1 Abstract ...183
12.2 Introduction ...183
12.3 Experimental approach ...187
12.4 Materials and methodology ...188
12.4.1 Materials and mixtures ... 188
12.4.2 Mixtures production ... 190
12.4.3 Testing program ... 192
12.4.3.1 Workability and compactability ... 192
12.4.3.2 Water loss ... 194
12.4.3.3 Indirect Tensile Strength (ITS) ... 195
12.5 Results analysis ...196
12.5.1 Workability and compactability ... 196
12.5.1.1 Correlation between Vm(10), k and CEI+T ... 197
12.5.1.2 Effect of mixing and transportation temperatures on CEI+T .... 199
12.5.2 Water Loss ... 201
12.5.3 Indirect Tensile Strength (ITS) ... 203
12.5.4 Indirect Tensile Stiffness Modulus ... 206
12.5.5 Scanning Electron Microscope (SEM) ... 208
12.6 Conclusions ...209
CHAPTER 13 THERMO-RHEOLOGICAL MODELLING IN THE SMALL STRAIN DOMAIN OF CEMENT-BITUMEN TREATED MATERIALS ...211
13.1 Abstract ...211
13.2 Introduction ...212
13.3 Thermo-rheological modelling of HMA and CBTM ...213
13.3.1 2S2P1D model ... 216
13.3.2 DBN model ... 217
13.4 Materials and methodology ...222
13.4.1 Materials and mixtures ... 222
13.4.2 Mixtures production ... 224
13.4.3 Experimenatal devices ... 225
13.5 Results analysis ...226
13.5.1 Time-Temperature Superposition Principle (TTSP) ... 227
13.5.2 The 2S2P1D model ... 229
13.5.3 The DBN model ... 232
13.6 Discussion ...233
CHAPTER 14 VISCO-ELASTO-PLASTIC CHARACTERIZATION IN THE SMALL STRAIN DOMAIN OF CEMENT-BITUMEN TREATED
MATERIALS PRODUCED AT LOW TEMPERATURES ...239
14.1 Abstract ...239
14.2 Introduction ...240
14.3 Materials and methodology ...242
14.3.1 Materials and mixtures ... 242
14.3.2 Mixing, compaction and curing ... 244
14.3.3 Complex modulus test... 247
14.3.4 Rheological modelling ... 248
14.4 Results Analysis ...252
14.4.1 Rheological Modelling ... 252
14.4.2 Characteristic Time τ0E ... 257
14.4.3 Glassy Modulus E0 ... 259
14.4.4 Analysis in the frequency range ... 261
14.5 Conclusions ...263
CHAPTER 15 SUMMARY OF SECTION 3 ...267
CONCLUSION ...269
RECOMMENDATIONS ...273
ANNEX I PROPERTIES OF MATERIALS EMPLOYED IN THE THESIS ...277
ANNEX II GRAPHIC REPRESENTATION OF THE RESULTS FOR COMPLEX MODULUS TESTS TO EVALUATE THE EFFECT OF LOW PRODUCTION TEMPERATURES ON CBTM MECHANICAL PROPERTIES ...285
ANNEX III REPEATABILITY STUDY ON THE LABORATORY PRODUCTION PROCESS OF CEMENT BITUMEN TREATED MATERIALS WITH FOAMED BITUMEN ...297
ANNEX IV EXPERIMENTAL INVESTIGATION ON WATER LOSS AND STIFFNESS OF CBTM USING DIFFERENT RA SOURCES ...309
ANNEX V INFLUENCE OF CURING ON THE MECHANICAL PROPERTIES OF CEMENT-BITUMEN TREATED MATERIALS USING FOAMED BITUMEN: AN INTERLABORATORY TEST PROGRAM ...317
ANNEX VI THERMO-RHEOLOGICAL MODELLING IN THE SMALL STRAIN DOMAIN OF CEMENT-BITUMEN TREATED
MATERIALS ...331 LIST OF BIBRIOGAPHICAL REFERENCES ...333
LIST OF TABLES
Page
Table 1.1 Bitumen emulsion identification (AkzoNobel, 2017) ...12
Table 1.2 Level of use of typical emulsifiers (AkzoNobel, 2000) ...12
Table 1.3 Advantages and disadvantages of bituminous and cementitious additions (taken from Xiao et al. (2018)) ...25
Table 1.4 Mixing procedures for CRM mixtures with added bitumen (RAP, cement or lime and emulsion) (Tebaldi et al., 2014) ...26
Table 1.5 Compaction methods used for CRM mixtures containing RAP (Tebaldi et al., 2014) ...27
Table 3.1 CBTM loose mixture composition (SSD condition) ...70
Table 3.2 CBTM loose mixture Gmmpyc measurements ...71
Table 3.3 CBTM loose mixture composition (apparent specific gravity) ...71
Table 5.1 Characteristics of the bituminous emulsion ...79
Table 5.2 Main physical properties of the fillers used for the experimental program ...80
Table 5.3 Main physical properties of the fillers used for the experimental program ...80
Table 5.4 Stiffness modulus results ...89
Table 5.5 Water loss in the specimen after curing ...90
Table 6.1 RAP aggregate properties ...95
Table 6.2 Bitumen emulsion properties ...95
Table 6.3 Volumetric composition of the studied mixtures ...98
Table 8.1 Granular composition of the aggregate blends ...113
Table 8.3 Main properties of bitumen emulsions and bitumen residue ...116
Table 8.4 Linear regression parameters: average value (standard error) ...122
Table 9.1 RAP sources classification (PCS index) ...134
Table 9.2 Properties of RAP sources used ...134
Table 9.3 Bitumen emulsion properties ...134
Table 9.4 Volumetric characterization of the compacted mixes ...138
Table 9.5 Fitting parameters of the water loss model ...145
Table 10.1 Properties of RAP sources used ...164
Table 10.2 Bitumen emulsion properties ...165
Table 10.3 Volumetric composition of the mixtures after compaction to reach Vm = 10.8% ...167
Table 10.4 CPM model results ...170
Table 10.5 Morphological parameters of RAP sources fractions ...171
Table 10.6 DBN model parameters ...175
Table 12.1 RAP aggregate properties ...189
Table 12.2 Bitumen emulsions properties ...189
Table 12.3 Mixtures naming and production process ...191
Table 12.4 Results of two-way ANOVA for CEIT+ ...200
Table 12.5 Water loss model fitting parameters ...203
Table 12.6 Results of two-way ANOVA for ITS results (Emulsion A) ...204
Table 13.1 RAP aggregate properties ...223
Table 13.2 Bitumen emulsions properties ...223
Table 13.4 WLF parameters ...229
Table 13.5 Rheological modelling parameters for the studied mixtures ...234
Table 14.1 RAP aggregate properties ...244
Table 14.2 Bitumen emulsion properties ...244
Table 14.3 Mixtures code, production steps (laboratory time), conditioning temperatures and number of specimens ...246
Table 14.4 WLF shifting parameters (T0 = 20 °C) ...254
Table 14.5 DBN model parameters for the studied mixtures (T0 = 20 °C) ...256
Table 14.6 Single Factor ANOVA analysis for τ0E in mixtures produced at low temperatures ...259
Table 14.7 Single Factor ANOVA analysis for E0 in mixtures produced at low temperatures ...261
Table 14.8 Two-Factor with replication ANOVA analysis for E0 to evaluate production temperatures ...261
LIST OF FIGURES
Page
Figure 1.1 Conceptual composition of pavement mixtures (readapted from
Grilli, Graziani & Bocci, 2012) ...7
Figure 1.2 Types of emulsions: a) O/W emulsion; b) W/O emulsion; c) W/O/W
emulsion (Salomon, 2006) ...8
Figure 1.3 Manufacturing layout of bitumen emulsion (AkzoNobel, 2017) ...9
Figure 1.4 Types of emulsion charges: a) Anionic emulsion (negative charge);
b) Cationic emulsion (positive charge) (AkzoNobel, 2017) ...11
Figure 1.5 The two possible breaking cases for the bitumen emulsion (Lesueur
& Potti, 2004) ...14
Figure 1.6 Determination of Optimum Foamant Water Content (Asphalt
Academy, 2009) ...17
Figure 1.7 Volumetric composition development during cement hydration for
w/c = 0.42...20
Figure 1.8 Optical images of fresh emulsified asphalt with cement (Wang et al.,
2014) ...23
Figure 1.9 Energy consumption of production steps for different techniques
(taken from Xiao et al., 2018) ...25
Figure 1.10 Proctor compaction test results (Grilli et al., 2012) ...29
Figure 1.11 SGC Test results (Grilli et al., 2012) ...30
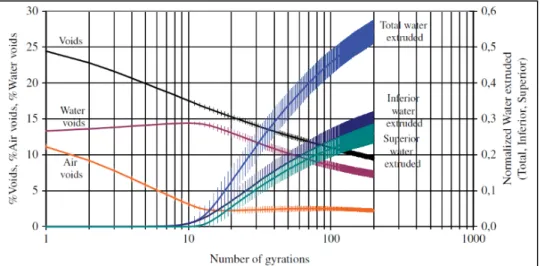
Figure 1.12 Compactability of cold mix asphalt using emulsified bitumen—void
and normalized water extruded (Wendling et al., 2014) ...30
Figure 1.13 Normalized strength along curing related to literature (taken from
(Dolzycki et al., 2017)) ...33
Figure 1.14 Microtomography details of an asphalt and cement composite
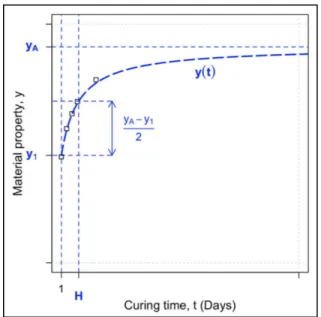
Figure 1.15 Example of experimental points and model related to a material
property (Raschia, Graziani, et al., 2019b) ...37
Figure 1.16 Behaviours typically observed in bituminous mixtures (Strain vs
Number of loading) (Di Benedetto et al., 2001) ...38
Figure 1.17 Stress-strain trend for complex modulus test in only-compression
configuration ...39
Figure 1.18 Isothermal curves for CBTM mixtures (6 temperatures, 6
frequencies) (Godenzoni, Graziani, et al., 2016) ...40
Figure 1.19 Master curves for a CBTM mixture at TS = 20°C (5 frequencies, 7
temperatures) ...41 Figure 1.20 Huet-Sayegh model ...42
Figure 1.21 Representation of the 2S2P1D model (readapted from Olard & Di
Benedetto (2003)) ...44
Figure 1.22 Unidirectional representation of the DBN model for bituminous
mixtures ...45
Figure 1.23 Cycling response of the EP bodies (taken from Di Benedetto et al.,
2011) ...45
Figure 1.24 Representation of the DBN model for small number of cycles in the
small strain domain ...46
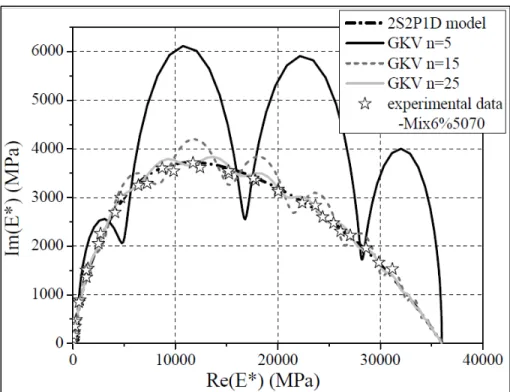
Figure 1.25 Calibration of the GKV model (5, 15, 25 elements) on the Cole-Cole
diagram (taken from Tiouajni et al., 2011) ...48
Figure 2.1 Overview of the experimental plan ...52
Figure 2.2 a) Example of material sample for SEM; b) SEM device used
(Hitachi TM3000) ...53
Figure 2.3 a) ITSM testing setup; b) PUNDIT device;
c) Complex modulus setup ...54 Figure 2.4 a) ITS test setup; b) SCB test setup ...55
Figure 2.5 Materials employed in the different chapters of the thesis ...56
Figure 3.1 Volumetric composition of a HMA compacted specimens ...62
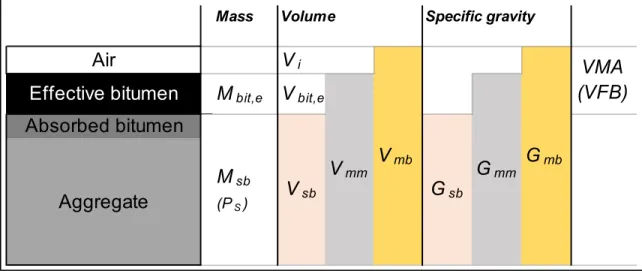
Figure 3.2 CBTM volumetric composition in the fresh state ...63
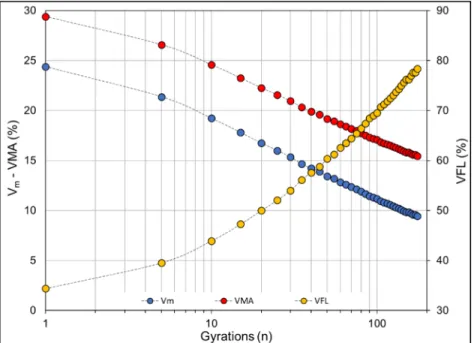
Figure 3.3 Example of compaction curves of CBTM from SGC ...66
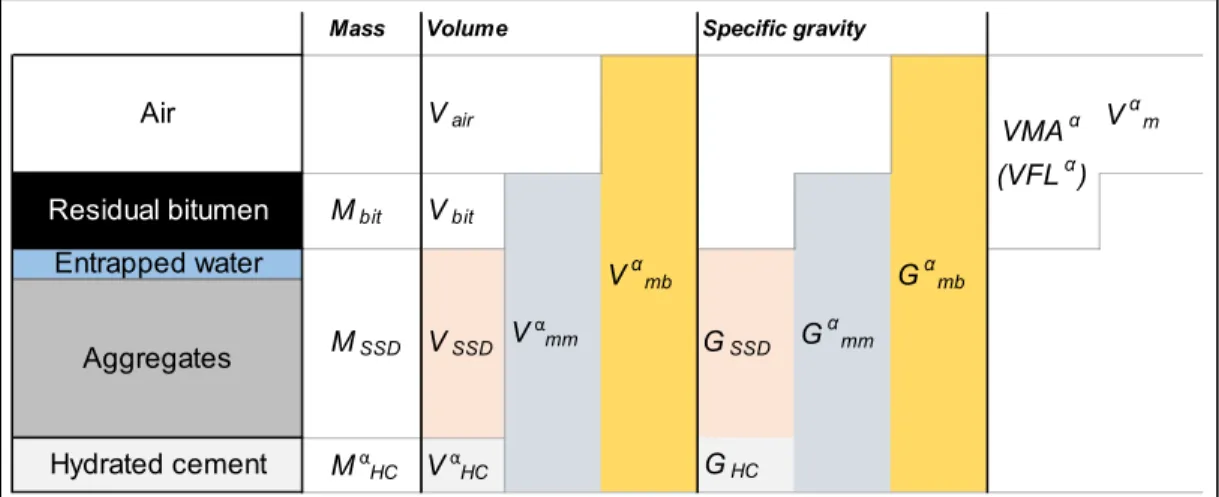
Figure 3.4 CBTM volumetric composition in the long-term state (no
intergranular water) ...67
Figure 3.5 Effect of hydration degree on CBTM volumetric properties ...69
Figure 5.1 Gradation of the design mix compared to the reference curve ...79
Figure 5.2 Influence of water content on the compactability of CRM: a) Voids
in the mixture Vi; b) Voids filled with Liquids (VFL) ...82 Figure 5.3 ITS device and specimen ...84
Figure 5.4 ITSM test setup with MTS device inside the environmental chamber ...86
Figure 5.5 Indirect tensile strength of mixtures ...87
Figure 5.6 Comparison of the stiffness modulus for the mixes at different
temperatures ...88
Figure 6.1 Gradation of the studied granular material ...96
Figure 6.2 Indirect Tensile Strength test results in dry and wet conditions ...99
Figure 6.3 Indirect Tensile Stiffness Modulus test results ...100
Figure 6.4 Dynamic Modulus test results (PUNDIT at 40°C) ...101
Figure 6.5 Scanning Electron Microscope images ...102
Figure 8.1 Aggregate blend gradations studied at: a) ÉTS; b) UNIVPM ...114
Figure 8.2 Compaction curves for the six mixtures at: a) ÉTS; b) UNIVPM ...121
Figure 8.3 Results for k and Vm(10) parameters ...123
Figure 8.4 G/Glim and S/Slim values ...124
Figure 8.5 Correlation between gradation, workability and compactability
Figure 8.6 Mechanical tests results: a) ITS and ITR at ÉTS; b) ITS and ITSM at UNIVPM ...127
Figure 9.1 Aggregate blend gradations of the studied mixes ...135
Figure 9.2 Volumetric characterization of CBTM mixtures ...139
Figure 9.3 Determination of YI factor for different notch depths (25 mm, 32
mm and 38 mm) for a s/D = 0.847 ...143 Figure 9.4 Water Loss model and results ...144
Figure 9.5 Indirect Tensile stiffness modulus results ...146
Figure 9.6 Indirect Tensile Strength results ...147 Figure 9.7 Strain Energy to Failure U results ...148 Figure 9.8 Critical Energy Release Rate Jc results ...148
Figure 9.9 Critical Stress Intensity Factor KIC results ...149
Figure 10.1 Effect of finer and coarser fractions on an intermediate fraction
(readapted from (De Larrard, 1999)) ...158
Figure 10.2 DBN model for bituminous mixtures ...160
Figure 10.3 Schematic representation of the DBN model for small strain and
small cycles ...161
Figure 10.4 Complex shear modulus results on the RAP residual binder: a) Black
space; b) Cole-Cole plan ...163
Figure 10.5 Aggregate distribution of the mixtures studied ...165
Figure 10.6 Specimens employed for testing ...167
Figure 10.7 Experimental results: a) Cole-Cole plan and, b) Black space ...172
Figure 10.8 Master curves at TS = 20°C: a) Norm of the complex modulus and,
b) Phase angle ...172
Figure 10.10 Experimental results modelled with the DBN model (n = 40): a) Cole-Cole plan, b) Black space, c) Master curve of the norm of the
complex modulus at TS = 20°C and, d) Master curve of the phase
angle at TS = 20°C ...174
Figure 11.1 Laboratory production simulation and experimental program ...180
Figure 12.1 Target aggregate blend ...188
Figure 12.2 Graphic meaning of CEI+T, Vm (10) and k parameters ...194
Figure 12.3 Compaction curves ...197
Figure 12.4 a) Relationship between Vm (10) and k; b) Relationship between
CEIT + and k; c) Relationship between CEIT + and Vm (10) ... 198
Figure 12.5 Relationship between CEIT +, mixing temperature and transportation
temperature ...199
Figure 12.6 Water loss experimental data and superposed model for mixtures
with: a) Emulsion A and b) Emulsion B ...202
Figure 12.7 Effect of mixing and transportation temperatures on Indirect Tensile
Strength (28 days) ...204
Figure 12.8 Correlation between residual water and Indirect Tensile Strength (at
14 and 28 days of curing) ...205 Figure 12.9 ITSM results ...207
Figure 12.10 SEM images captured for mixes produced with Emulsion A after 28
days of curing ...208
Figure 13.1 2S2P1D analogical representation (taken from Gayte et al., 2016) ...216
Figure 13.2 a) DBN model for bituminous mixtures, b) Generalized
Kelvin-Voïgt model, which gives an asymptotic representation of the DBN model when strain tends to 0 ...218
Figure 13.3 Cyclic loading behaviour of elasto-plastic element for small number
of cycles (path ABCB) ...219
Figure 13.4 Representation of the DBN model applied in the small strain
domain, EP are represented by a spring (modulus, E) and a
Figure 13.5 Energy dissipation during cyclic loading in the small strain domain
(experimental data superposed to an equivalent sinusoidal loading) ...221
Figure 13.6 Correlation between: a) GKV model, and b) 2S2P1D model (taken
from Di Benedetto, Delaporte et al., 2007) ...221
Figure 13.7 Maximum density curve, RAP and blend gradations ...222
Figure 13.8 SGC specimen of Ø100 mm x 140mm: a) un-sealed condition, b)
sealed condition and, c) coring and sawing to obtain the testing
specimens of Ø75 x 120mm ...225
Figure 13.9 View of a specimen with measurement system in: a) MTS press and,
b) AMPT PRO press ...226
Figure 13.10 Experimental results showed in: a) Cole-Cole plan and, b) Black
space ...227
Figure 13.11 At Tref = 20°C, master curves of: a) The norm of the complex
modulus │E*│ and, b) The phase angle φ ...228
Figure 13.12 Shift factors, aT, and WLF model related to the studied mixtures ...229
Figure 13.13 Optimization of the 2S2P1D model for B_Unsealed mixture
according to: a) Cole-Cole plan, b) Black space, c) phase angle
master curve and, d) complex modulus master curve (Tref = 20°C) ...231
Figure 13.14 Application of 2S2P1D model fitted on the master curve of the norm
of the complex modulus (calibration : 2S2P1D_|E*|) for: a) Cole-Cole plan, b) Black space, c) phase angle master curve and, d)
complex modulus master curve (Tref = 20°C) ...232
Figure 13.15 Application of the 2S2P1D (dashed line) and DBN (continuous line)
models to the studied mixtures (n = 40): a) Cole-Cole plan, b) Black space, c) phase angle master curve and, d) complex modulus master curve (Tref = 20°C) ...233
Figure 13.16 Accuracy of the DBN model for: a) norm of complex modulus and,
b) phase angle ...234
Figure 14.2 Laboratory production and experimental program: a) mixture A_5_25, b) mixture A_5_5, c) mixture A_25_25 and, d) mixture
A_25_5 ...245
Figure 14.3 SGC specimen of Ø100mm x 140mm: a) unsealed condition,
b) sealed condition and, c) coring and sawing for testing specimens
of Ø75 x 120mm ...247
Figure 14.4 Representation of the DBN model applied in the small strain domain
(few cycles) ...250
Figure 14.5 Experimental data from complex modulus tests: a) Cole-Cole plan
and, b) Black space ...253
Figure 14.6 Master curves at reference temperature T0 = 20°C of: a) norm of the
complex modulus and, b) phase angle ...254
Figure 14.7 Experimental data and DBN model (T0 = 20°C) for n = 40: a)
Cole-Cole plan, b) Black space, c) master curve of the norm of the
complex modulus |E*| and, d) master curve of the phase angle φEP
(φEP is shown and represents the elasto-plastic phase angle) ...255
Figure 14.8 Accuracy of the DBN model according to experimental results (T0 =
20 °C): a) norm of the complex modulus and, b) phase angle ...257
Figure 14.9 Effect of production temperatures on τ0E: a) unsealed specimens and,
b) sealed specimens ...259
Figure 14.10 Effect of production temperatures on E0: a) unsealed specimens and,
b) sealed specimens ...260
Figure 14.11 Relative difference values between mixtures cured in sealed
conditions and unsealed conditions: a) norm of the complex modulus and, b) phase angle ...262
Figure 14.12 Relative difference values between mixtures produced at low and
standard temperatures: a) norm of the complex modulus and, b)
LIST OF ABBREVIATIONS
2S2P1D 2 Springs, 2 Parabolic elements, 1 Dashpot
AASHTO American Association of State Highway Transportation Officials
AC Asphalt Concrete
AMPT Asphalt Mixture Performance Tester
ANOVA ANalysis Of VAriance
ARRA Asphalt Recycling & Reclaiming Association
ASTM American Society for Testing and Materials
BBS Binder Bond Strength
BSM Bitumen-Stabilized Material
CAM Cold Asphalt Material
CBTM Cement-Bitumen Treated Material
CCPR Cold Central Plant Recycling
CEI Compaction Energy Index
CFS Closed-Form Shifting
CIPR Cold In-Plant Recyling
CIR Cold In-place Recycling
COV Coeffiecient Of Variance
CPM Compressive Packing Model
CR Cold Recyling
CRM Cold Recycled Material
CSS Cationic Slow-Setting
CTM Cement-Treated Material
DBN Di Benedetto & Neifar
EP Elasto-Plastic
EPFM Elasto-Plastic Fracture Mechanic
ÉTS École de Technologie Supérieure
FEM Finite Element Method
FHWA Federal HighWay Administration
FSD Free Surface Drying
GKV Generalized Kelvin-Voigt
GU General Use
HIR Hot In-place Recycling
HMA Hot Mix Asphalt
HPAC High-Performance Asphalt Concrete
ILTP Inter-Laboratory Testing Program
ITS Indirect Tensile Strength
ITSM Indirect Tensile Stiffness Modulus
LCMB Laboratoire sur les Chaussées et Matériaux Bitumineux
LEFM Linear-Elastic Fracture Mechanic
LVE Linear Visco-Elastic
ML Moisture Loss
MTQ Ministère des Transports du Québec
MTS Material Testing System
NMAS Nominal Maximum Aggregate Size
OMC Optimum Moisture Content
OPC Ordinary Portland Cement
PCC Portland Cement Concrete
PCS Passing to a Control Sieve
PSD Partially Sealed (or Surface) Drying
PUNDIT Portable Ultrasonic Non-destructive Digital Indicating Tester
RA Reclaimed Asphalt
RAP Reclaimed Asphalt Pavement
RCD Roller Compacted concrete
RILEM Réunion Internationale des Laboratoires et Experts des Matériaux, systèmes
RRT Round Robin Test
RSD Restrained Surface Drying
SCB Semi-Circular Bending
SCC Self-Compacting Concrete
SEM Scanning Electron Microscope
SGC Shear (or Superpave) Gyratory Compactor
SMA Stone Mastic Asphalt
SSD Saturated Surface Dried
TC Technical Committee
TG Task Group
TRB Transporation Research Board
TTSP Time-Temperature Superposition Principle
UNIVPM UNIVersità Politecnica delle Marche
UPV Ultrasonic Pulse Velocity
VAg Virgin Aggregate
VFL Voids Filled with Liquids
Vm Voids in the mixture
VMA Voids in the Mineral Aggregate
WLF William-Landel-Ferry
INTRODUCTION
Nowadays, road pavements rehabilitation is a very important topic, since it faces the increasing issue of new infrastructure demand together with the decrease of funds, with a new, safe, reliable and cost-effective road system (ARRA, 2001; Bocci et al., 2011; Cardone et al., 2014; Esenwa et al., 2013; Grilli et al., 2012; Stroup-Gardiner, 2011). First recycling and rehabilitation cases go back to the 1930s (Hot In-place Recycling, HIR), even though the majority of the results in the scientific and technical fields were achieved around the mid 1970s (ARRA, 2001).
A significant improvement of energy and materials saving was given by the increasing use of the Reclaimed Asphalt Pavement (RAP), which partially or completely replace the natural aggregates in asphalt mixtures. Furthermore, production temperatures were gradually decreased thanks to the employment of warm mix additives (WMA), bitumen emulsion and foamed bitumen. Thanks to these tools, asphalt industries were able to guarantee a strong environmental involvement.
Five main recycling techniques are defined by ARRA (2001), according to the damage of the pavement, operations management and level of traffic:
• Cold Planing; • Hot Recycling;
• Hot In-Place Recycling (HIR); • Cold Recycling (CR):
■ Cold In-Place Recycling (CIR);
■ Cold Central Plant Recycling (CCPR);
• Full-Depth Reclamation:
■ Pulverization
If necessary, all the recycling methods just mentioned can be employed together in the same project. This thesis focuses its attention on materials produced with CR techniques, which are carried out at ambient temperature (with no heat addition), allow the use of non-renewable resources, and in general they allow energy savings compared to other construction methods. CR technology is considered a powerful rehabilitation system when the following issues are observed (Davidson & Eng, 2003):
• Pavement cracking: age cracking, thermal cracking, fatigue cracking, and reflective cracking;
• Permanent deformation: rutting due to unstable asphalt mixture, shoving, rough pavement; • Loss of integrity in the existing asphalt pavement, ravelling, stripping, flushing, loss of
bond between bituminous layers, and presence of potholes.
The CR techniques were introduced in Canada in the late 1980s and has grown continuously. The regional municipality of Ottawa-Carleton (now known as the City of Ottawa) was the first agency to utilize the process as a rehabilitation tool. Nowadays CR process is used almost in every province of Canada. The interesting point to be made is that each province uses different choices for the binder: British Columbia uses a rejuvenator or blends, Ontario uses high floats as well as cationic emulsions, Québec uses cationic emulsions and the Maritimes use high float and cationic emulsions (Davidson, 2005).
This thesis deals with issues related to the production of CR (CCPR and CIR) mixtures, characterized by the use of ordinary Portland cement and bitumen emulsion as binders. In particular, the experimental plan is oriented towards the study of the aggregate phase composing the mixture, and on how low production temperatures influence mechanical properties, in both the short and the long term.
CHAPTER 1 presents an update review of the scientific literature specifically related to the thesis subject, which led to the problem statement and research objectives described in CHAPTER 2. CHAPTER 3 gives both a theoretical and practical description of a typical mix
design approach used for HMA, the volumetric approach, which in this thesis has been applied to CBTM mixtures. CHAPTERS 4, 5 and 6, which contain two papers, analyze aspects useful for the CBTM composition, i.e. the use of cement as mineral addition in CBTM mixtures (CHAPTER 5), and the effect of water and cement content on the mechanical properties (CHAPTER 6). CHAPTERS 7, 8, 9 and 10 collect three papers that deal with the aggregate structure of CBTM, in particular with granular distribution, Nominal Maximum Aggregate Size (NMAS) and RAP source. CHAPTERS 11, 12, 13 and 14 are composed of three papers which assess the influence of low production temperatures on short and long-term mechanical properties of CBTM mixtures, with a limited analysis also carried out on a different bitumen emulsion. CHAPTER 15 containes some global considerations about the previous four chapters. Concluding, the main findings of this thesis are described as well as some useful recommendations for future works.
CHAPTER 1 LITERATURE REVIEW
This research thesis aims to cover several aspects of a particular type of cold recycled material, the cement-bitumen treated materials (CBTM). In particular, the study will focus on components (water, cement and RAP aggregate), as well as on the production process performed at low temperatures. Consequently, the literature review will highlight the most important findings from the scientific community to support the objectives of this thesis.
1.1 Cold Recycling (CR)
Road pavements constructed with CR technology using either bitumen emulsion or foamed bitumen are environmentally sustainable and cost-effective. They are suitable in particular for pavement rehabilitation using in situ recyclers and/or conventional construction equipment (Giani et al., 2015; Thenoux et al., 2007).
CR process can be performed either in production plants (Cold Central Plant Recycling— CCPR) and in situ (Cold In-Place Recycling—CIR). In case of CCPR, the process takes place in a stationary or mobile recycling plant, which can be a real production center or a CIR train, less the milling machine. In this manner, the material is controlled and sometimes pre-treated before the new laydown, giving in return a lower variability and a higher reliability of the final product (ARRA, 2001; Godenzoni, 2017).
On the other hand, CIR process generally uses 100% of the RAP generated during the milling process since only asphalt layers are used; also, Virgin Aggregates (VAg) can be included to reach the target gradation. The CIR treatment depth is typically within the 50 to 100 mm range when the binding phase is only composed of bitumen emulsion. Treatment depths of 125 to 150 mm are possible when co-binders (or active fillers), such as Portland cement, lime, kiln dust or fly ash are used to improve the early strength gain and resistance to moisture damage
(ARRA, 2001). If lime or Portland cement is added to the recycled mix, they can be added in dry form or as slurry. The slurry method eliminates potential dust problems and permits greater control of the amount of recycling modifier being added (ARRA, 2001).
1.1.1 Cold Recycled Mixtures (CRM)
In order to ensure workability and compactability at ambient temperature during CR processes, a water dosage normally ranging between 3% and 6% by mixture mass is added, which allows to reach a final air voids rate between 10% and 15% (Tebaldi et al., 2014; Xiao et al., 2018). The compacted CR mixture (CRM) must be adequately cured before a wearing surface is placed, to let the water evaporation occur. The rate of curing is quite variable and depends on several factors, including environmental conditions and drainage, as well as moisture characteristics of the mix. Obviously, the mechanical properties of the final product highly depend on the curing process, which can be severely hindered in cold climates. Typical curing periods are several hours to 2 weeks, depending on the above-mentioned factors, the site location and the binding agent used (foamed bitumen or bitumen emulsion) (ARRA, 2001). It has been observed that CRM properties in the early life (first days) and in the long term (after few years) can be improved with the introduction in the mixture of mineral additions. For mineral addition it is intended a filler-sized granular material which can have or not have the ability of chemically or physically bond with water. In the literature, terms like active fillers or co-binders can be found to express the same component inside the CRM mixture, like cement, hydrated lime, kiln dust, fly ash, etc. With this terminology, the identification of the
mineral addition used can be misunderstood. For example, hydrated lime (Ca(OH2)) reacts
with the carbon dioxide (CO2) in the air to give limestone, even though it needs to be mixed
with water to start the reaction (Collepardi, 1991). So, it can be considered as an active filler only from this point of view. On the other hand, ordinary Portland cement has the ability to create bonds when combined with water, keeping trapped a certain amount required by the
hydration reaction. In this thesis, cement is used as mineral addition (or co-binder), since the term active filler is considered too generic.
According to the contemporary presence of bitumen and cement, CRM materials can be named differently and divided in several categories (Figure 1.1):
• Cement Treated Materials (CTMs): no bitumen is employed and the structural cohesion is conferred only by the hydration of the cement, that is used between 1 and 6% generally; • Cement Bitumen Treated Materials (CBTMs): these mixes are an improved version of the
CTMs, since virgin bitumen binder (from 1 to 3%) is used in order to confer a more asphalt-like behaviour to the mix (less brittle and more flexible). Cement content decreases between 1 and 3%. This category is considered in this thesis;
• Bitumen Stabilized Materials (BSMs): they are characterized by granular unbound aggregates (mostly recycled) stabilized by using low percentages of bitumen (1 to 3%) and up to 1% of cement.
Figure 1.1 Conceptual composition of pavement mixtures (readapted from Grilli, Graziani & Bocci, 2012)
Bitumen emulsion and foamed bitumen are methods to reduce bitumen viscosity, allowing a better mixing with the cold moist material and to improve workability at ambient temperature. They are produced in two complete different methods (Asphalt Academy, 2009).
1.1.2 Bitumen emulsions
Bitumen emulsions are dispersion of small droplets of one liquid in another liquid. Emulsions in general can be formed by any two immiscible liquids, but in most emulsions one of the phases is water. Oil-in-water (O/W) emulsions are those in which the continuous phase is water and the disperse (droplet) phase is an “oily” liquid. Water-in-oil (W/O) or “inverted” emulsions are those in which the continuous phase is an oil and the disperse phase is water (Salomon, 2006). In addition, emulsions can have more complex structures, such as W/O/W, where the disperse phase contains another phase which may not have the same composition as the continuous phase (Figure 1.2).
Figure 1.2 Types of emulsions: a) O/W emulsion; b) W/O emulsion; c) W/O/W emulsion (Salomon,
2006)
Standard bitumen emulsions are normally considered to be the O/W type. They usually contain from 40% to 75% of bitumen, 0.1% to 2.5% of emulsifier, 25% to 60% of water plus some minor components (Salomon, 2006). Bitumen droplets in the bitumen emulsion are
characterized by a size distribution, and this distribution is influenced by the bitumen emulsion recipe and the mechanics and operating conditions of the emulsion manufacturing plant. The particle size (usually between 1 and 30 μm diameter) and the particle size distribution of the bitumen emulsion droplets strongly influence the physical properties of the emulsion, such as viscosity and storage stability; larger average particle size leads to lower emulsion viscosity, as does a broad or bimodal particle size distribution (Salomon, 2006).
Emulsions are made by mixing hot bitumen with water containing emulsifying agents and applying sufficient mechanical energy to break up the bitumen into droplets. Emulsions are produced in a colloid mill, containing a high-speed (1000–6000 rev/min) rotor. The typical manufacturing of a bitumen emulsion is illustrated in Figure 1.3.
Figure 1.3 Manufacturing layout of bitumen emulsion (AkzoNobel, 2017)
Elements listed in the picture are described as follows (AkzoNobel, 2017):
• Bitumen: Similar material used in HMA but the choice depends on the application;
• Water: Generally potable water without suspended solids. Some emulsions could require softened water;
• Polymer: Emulsions may contain polymers which can be used as a water dispersion (latex-natural rubber latex or Styrene Butadiene latex), or solids (like Styrene Butadiene
Styrene-SBS) which are dissolved in the bitumen. The polymer modifies the elastic and flow properties of bitumen to improve performance;
• Solvent: may be included in the emulsion to improve emulsification, to reduce settlement, improve curing rate at low temperatures, or to provide the right binder viscosity after curing;
• Emulsifier: The emulsifier is a chemical compound which is used to stabilize the emulsion. They are mostly derived from natural fats and oils like beef fat, or from wood products like tall oils and lignins;
• Thickeners: water-soluble polymers which improve the storage stability of the emulsion; • Salts: Used to control viscosity changes in the emulsion.
In addition, other chemical elements could be included: calcium and sodium chlorides, included to reduce the osmosis of water into the bitumen due to the presence of small amounts of salt in asphalt, and adhesion promoters, that are surface-active amine compounds added to promote sufficient adhesion between cured anionic emulsions (and occasionally cationic) and the aggregates (AkzoNobel, 2017).
Emulsifiers are chemical elements with surface activity that, when dissolved in a liquid (especially water), decrease the surface tension by adsorption on the liquid/vapour interface or other surfaces. Emulsifiers molecules have a nonpolar lipophilic tail and a polar hydrophilic head group, which is balanced by the counter-ion (SFERB, 1991). The molecules concentrate at the interface between water and bitumen, orientated with the polar group in the water and the nonpolar parts of the molecule in the oil (Figure 1.4). Emulsifiers can be classified into anionic, cationic, ampholytic and non-ionic types depending on the charge their head groups adopt in water, although this charge may depend on pH.
Anionic emulsifiers ionize in water to create negatively charged ions, and they usually contain negatively charged oxygen atoms in head group. At opposite, cationic emulsifiers ionize in water to create positively charged ions. In the head group, they usually have nitrogen atoms
positively charged. Ampholytic emulsifiers are characterized by two or more functional groups, which can ionize together in an aqueous phase, according to the pH. At the end, non-ionic emulsifiers do not produce ions in aqueous phases.
Figure 1.4 Types of emulsion charges: a) Anionic emulsion (negative charge); b) Cationic emulsion (positive charge) (AkzoNobel, 2017)
Emulsifiers are often supplied in a water-insoluble form and need to be “activated” (or de-protonated) with acid or alkali to have the final surface-active cationic or anionic water-soluble form used to prepare the soap solution. The choice of the acid or alkali (and the final emulsion pH, subsequently), strongly influence its properties. Hydrochloride and phosphoric acids are used for cationic emulsions, while sodium and potassium hydroxide are the most common alkalis used for anionic emulsions (SFERB, 1991).
Although a large amount of emulsifier in an emulsion resides at the bitumen/water interface, a certain amount is dispersed in the water phase (free part). As emulsifier molecules are partially hydrophobic, they are most likely to exist as colloids. When an emulsion comes into contact with aggregates, the free emulsifier will be attracted to charged sites. Of course, if these sites are used by free emulsifier, the emulsion will not break as quickly. Therefore, the higher the level of (free) emulsifier, the slower the breaking rate of the emulsion. It can also be hypothesized that a large amount of free emulsifier in an emulsion can rapidly attach to the aggregate surface, preventing the bitumen breaking on the same spot. In this way, bitumen droplets will coalesce far from the aggregate surface, leading to poor binding of the final
mixture. Table 1.1 gives a correlation between the type of the emulsion and its typical use in asphalt industry, while Table 1.2 illustrates the typical level of emulsifiers used.
Table 1.1 Bitumen emulsion identification (AkzoNobel, 2017)
Reference standard Rapid-setting Medium-setting Slow-setting
Cationic (+) ASTM D977 and D2397 CRS CMS CSS UNI EN 13808:2013 C60B1 C60B2 C60B3 C60B4 C60B5 C60B6 C60B7 C60B8 C60B9 C60B10 Anionic (-) ASTM D977 and D2397 RS MS SS UNI EN 13808:2013 A60B1 A60B2 A60B3 A60B4 A60B5 A60B6 A60B7 A60B8 A60B9 A60B10
Used for: Chip-seal Open-graded
mix
Dense-graded mix
Table 1.2 Level of use of typical emulsifiers (AkzoNobel, 2000)
Emulsion type Emulsifier level [%] Emulsion pH Typical emulsifier
Cationic Rapid Setting 0.15-0.25 2–3 Tallow diamine
Cationic Medium
Setting 0.3-0.6 2–3 Tallow diamine
Cationic Slow Setting 0.8-2.0 2–5 Quaternary amine
Anionic Rapid Setting 0.2-0.4 10.5-12 Tally acid
Anionic Medium
Setting 0.4-0.8 10.5-12 Tally acid
The principle of employing asphalt emulsion technology is to match the reactivity of the emulsion with the reactivity of the aggregate; rapid set emulsions shall be used with low-reactive (low surface area) aggregates, while slow set emulsions are better suited for low-reactive (high surface area) aggregates. In particular, some aggregates, like carbonates and fillers (as cement, that is highly basic), may neutralize acid in cationic emulsions causing the pH to rise and the emulsion to be destabilized. At opposite, anionic emulsions may be destabilized by soluble multivalent ions (Salomon, 2006).
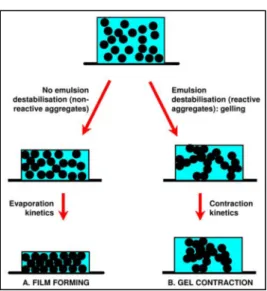
On a physicochemical point of view, emulsion stability is obtained thanks to the repulsive forces between bitumen droplets (electrostatic forces). These interparticle forces can be described by the so-called DLVO theory, named by Derjaguin-Landau-Verwey-Overbeek (Israelachvili, 2015). According to this theory, inter-droplet interactions are the sum of an electrostatic repulsion and a Van der Waals attraction. When the repulsion overcomes the attraction, the droplets are prevented from approaching each other and the emulsion is stable, i.e., no coalescence occurs. On the opposite, when the attraction overcomes the repulsion, the droplets tend to contact and then coalesce. Hence, the breaking of the emulsion can be described in rational terms as a consequence of two causes (Figure 1.5) (Lesueur & Potti, 2004):
• Very high bitumen concentration of droplets (film forming): the bitumen droplets retain their identity up to a high concentration, which can be higher than 98% for slow setting emulsions. From then, the pressure becomes high enough to generate the breaking of the films between the bitumen droplets and coalescence occur. The kinetics of the film formation is then imposed by the water evaporation rate;
• Disappearance of the electrostatic repulsion between droplets (gel contraction): this breaking mode is activated by the action of the aggregates or of an additive, such as Portland cement or lime. Chemical reactions or changes in the pH will promote the coalescence of the bitumen droplets (electrostatic attraction and/or chemical reactions);
Figure 1.5 The two possible breaking cases for the bitumen emulsion
(Lesueur & Potti, 2004)
According to Wates and James (Wates & James, 1993) there are three breaking mechanisms for cationic emulsions in contact with negatively charged siliceous materials:
• Emulsifier abstraction: in which the emulsifier moves from the bitumen/water interface to the aggregate surface, leading the coalescence of the emulsion;
• Deprotonation of the acidified emulsifier: protons are adsorbed by aggregates basic surface, deactivating the emulsifier and thus causing the emulsion breaking;
• Droplet migration: bitumen droplets are attracted to the negatively charged aggregate surface, due to the positively charged emulsifier. The final situation is beneficial as the bitumen is bound on the aggregates by the emulsifier, which subsequently acts as adhesion agent.
Another mechanism has been proposed by Plotnikova (Plotnikova, 1993). This theory claims that the free emulsifier is firstly adsorbed on the aggregate surface. In the same way, the emulsifier spread on the bitumen particles is abstracted and absorbed on the aggregate; the
aggregate surface becomes then hydrophobic, and the bitumen is attracted being hydrophobic too because of the emulsifier desorption.
Gaestel assessed that there are two breaking mechanisms in the case of anionic emulsions (Gaestel, 1967):
• In combination with calcareous aggregates, which are positively charged, the emulsifier forms a salt with the calcium ions contained in the aggregate, removing it from the bitumen/water interface and leading the emulsion to break;
• In combination with negatively charged siliceous aggregates, the inorganic cation is adsorbed on the aggregate surface. This causes the deactivation of the emulsifier through the loss of the counter-ion, thus the emulsion is destabilized and breaks.
Needham (Needham, 1996) conducted a wide study on coalescence properties of emulsions during compaction, and especially its behaviour depending on several parameters. The factors that showed a strong effect on bitumen particles coalescence during compaction are the bitumen penetration grade, the compaction load, the cement content, and the polymer addition combined with cement. Softer bitumen droplets deform more easily during compaction, especially when the pressure to which they are subject is higher. Moreover, it seems to exist an electrostatic or steric boundary between droplets which must be overcome in order to join them together. The higher the cement content, employed alone or with polymers, the higher the coalescence increase, due to the chemical reaction that deactivates the emulsifier, although rapid-setting cements do not lead to a faster coalescence. Nonetheless, emulsions with high
resistance to hydration reaction ions OH—and Ca2+ show much better mixing stability (Ouyang
et al., 2018). At the same time, it is important the type of emulsifier used as well, since different emulsifier types seem to have retarding effect on cement hydration (Tan et al., 2013).
Results showed that a higher emulsifier level leads to a slower coalescence, caused by a high concentration of free emulsifier, such as a strong repulsive force between bitumen particles. Same result is obtained with the use of polymers without cement (Needham, 1996).
Overall, the compaction process seems to be fundamental to start the coalescence process and the cohesion development, since un-compacted mixes did not show cohesive behaviour in the first 24h. On the other hand, what is not crucial is the compaction temperature, since results showed that an increase from 3°C to 45°C lead to a low coalescence increase from 37% to 53% (Needham, 1996).
1.1.3 Foamed bitumen
The thesis treats only of CBTM mixtures produced with bitumen emulsion but a general overview on the foamed bitumen mixtures is provided. Foamed bitumen is produced by injecting water into hot bitumen, resulting in spontaneous foaming. The physical properties of the bitumen are temporarily altered when the injected water, on contact with the hot bitumen, is turned into vapour, which is trapped in thousands of tiny bitumen bubbles. The foam dissipates in less than a minute and the foaming process occurs in an expansion chamber. To produce a CBTM with this technique on site, the bitumen is foamed in that context and incorporated into the aggregate while still in its foamed state. The greater the volume of the foam, the better the distribution of the bitumen in the aggregates.
During the mixing process, the bitumen bubbles burst, producing tiny bitumen particles, that disperse throughout the aggregate by adhering to the finer particles (fine sand and smaller) to form a mastic. The moisture in the mix prior to the addition of the foamed bitumen plays an important role in dispersing the bitumen during mixing. On compaction, the bitumen particles in the mastic are physically pressed against the larger aggregate particles resulting in localized non-continuous bonds (Asphalt Academy, 2009).
The properties of the foam are characterized by means of the expansion ratio and the half-life values. These values are calculated as follows:
• Half-life = Time measured in seconds for the foamed bitumen to subside from the maximum volume to half of the maximum volume.
Figure 1.6 Determination of Optimum Foamant Water Content (Asphalt Academy, 2009)
Such parameters are measured in laboratory simply spraying the bitumen foam in a standardized bucket with different foaming water contents. By varying the application rate of the foamant water, a plot such as Figure 1.6 is obtained for a specific temperature. In this manner, it is possible to choose the optimum foaming water content. Standard specifications
for ERm and τ1/2 are non-existent but recommended values of ERm > 8 and τ1/2 > 6 seconds are
observed from South African experience (technical guidelines) (Jenkins, 2000b).
1.1.4 Reclaimed asphalt pavement (RAP)
The increasing use of RAP in the last years is mainly due to the exponential improvement of the techniques adopted, as well as the advancements in the scientific field. In fact, recycling asphalt pavements have technical, economical and environmental advantages. For these reasons, the majority of design and rehabilitation projects worldwide are characterized by the employment of RAP aggregate in percentages from 10% to 100%, depending especially on the road class and the traffic level (Al-Qadi et al., 2007).
After that RAP is obtained from the pavement milling, it is usually stockpiled in production plants before being re-used in construction or rehabilitation projects. At this stage, the material is completely exposed to air and ambiental factors, which lead to oxidation and ageing. As a consequence, the characterization of the RAP when implemented in a new mixture is an extremely important step. Normally, when RAP is employed in HMA mixture, the extracted RAP binder is extracted and analyzed to determine the degree of blending with the virgin binder at the target mixing temperature. However, it is reasonable to assume that when RAP is impletemented in a CRM (or CBTM) mixture, no blending occurs between the bitumen emulsion residual bitumen and the RAP binder, because of the low production temperatures. In such case, one crucial aspect is the RAP gradation. RAP is a heterogeneous material and is not always composed of aggregates covered by old bitumen. At the same time, it is possible to find conglomerates of small aggregates glued together by a mastic. Such aspects could cause a drastic change in the gradation when a new mixture is put in place, therefore it is important to keep the RAP gradation under control (Perraton, Tebaldi, et al., 2016). In the framework of the RILEM TC 237-SIB TG6, a protocol by Perraton at École de technologie supérieure was proposed to perform a Round Robin Test (RRT) in order to characterize RAP sources by a fragmentation test. This procedure resulted to be suitable to differentiate different RAP classes based on their fragmentation resistance, but additional studies were needed to evaluate the relationship between the fragmentation test classification and the properties of the CBTM mixture produced (Perraton, Tebaldi, et al., 2016; Tebaldi et al., 2019).
1.1.5 Ordinary Portland Cement
Cement is a hydraulic binder which is generally employed to produce concrete. When it is combined in his unhydrated form with water, it forms the cement paste. The cement paste is the binding phase in concrete which holds the aggregate structure together. A particular type of cements are the calcium silicate cements, also known as Portland cements. At present, five types of Portland cements exist (types I-V), and the main differences among them are due to the production process, especially in terms of cement minerals used and the fineness to which
the cement is ground. These five types are defined as Ordinary Portland Cements (OPC) and they are the most commonly used for typical concrete applications (Thomas & Jennings, 2009). The reaction between OPC and water forms various products, among which the most important is called calcium-silicate hydrate (C-S-H) gel, which grows between particles giving strength to the cement paste. The volumetric composition of the cement paste is strongly related to the degree of the hydration reaction α, which varies from 0 (unhydrated cement) to 1 (cement completely hydrated). The formulation of the volumetric properties evolution with α is possible thanks to the Powers’ model (Powers, 1958). Powers’ model is largely based on a comprehensive study of water vapour sorption isotherms and chemically bound water in hardening cement pastes. The water involved in a cement paste can be classified in three parts: capillary water, gel water and chemically bound water. The capillary water is the free water present in the coarse capillary pores. The gel water is the water physically bound to the surface of the gel solid, equal to approximately 0.19 g per gram of cement reacted. The gel solid structure is composed of the chemically bound water, which is approximately 0.23 g per gram of cement reacted. Therefore, a complete OPC hydration is only possible at a water/cement (w/c) ratio above 0.42 (= 0.23 + 0.19). If a lower w/c ratio is used some cement will remain unhydrated (α < 1), whereas if a higher w/c ratio is used cement will totally hydrate (α = 1) and some capillary water will still be available (Jensen & Hansen, 2001; Powers, 1958). The products formed by the reaction have a lower volume compared to the total volume of cement and capillary water initially used, due to chemical shrinkage. The volume of capillary pores is around 6.4 ml per 100 g of cement reacted. Based on such assumptions and assuming an air-free cement paste, the following volumes can be defined (Jensen et al., 2001):
• Volume of capillary pores V :
V = 0.20 ∙ V ∙ α (1.1)
• Volume of capillary water V :
V = V , − 1.32 ∙ V ∙ α (1.2)
V = 0.60 ∙ V ∙ α (1.3) • Volume of gel solid V :
V = 1.52 ∙ V ∙ α (1.4)
• Volume of unhydrated cement V :
V = V ∙ (1 − α) (1.5)
All the volumes just described are illustrated in Figure 1.7. In the figure, the w/c ratio is fixed at 0.42 in order to have a full cement hydration and the evolution of the volumetrics for α as a function of time is shown. It can be observed that the volumes of capillary water and cement
when α = 0 (V , and V ) are 57% and 43%, respectively. It is also highlighted that if α = 1
in Equations (1.1) — (1.5) the total volume of the cement paste is still equal to 1, even though approximately 8.6% (= 0.20 x 0.43) of the hydrated cement paste is capillary pores. The remaining solid structure of the cement paste, V and V , is approximately 2.12 (= 1.52 + 0.6) times the initial cement volume.
Figure 1.7 Volumetric composition development during cement hydration for w/c = 0.42
Capillary pores (cp) Gel water (gw) Gel solid (gs) Vcw,0 = 57% ρw = 1.000 g/cm3 Mcw = 42.0 g Capillary water (cw) Unhydrated cement (C) VC = 43% ρC = 3.150 g/cm3 MC = 100.0g w/c = 0.42 V V V V V
𝛂 = 𝟎
𝛂 = 𝜶
(𝒕)𝛂 = 𝟏
1.2 Interaction of bitumen emulsion with mineral aggregates
As mentioned in chapter 1.1.2, the bitumen emulsion can show different ways to flocculate and eventually break on the aggregate surface, depending especially on the chemical attraction between bitumen droplets and aggregate. In more practical situations and in lack of specific laboratory equipment, it is difficult to precisely evaluate both the aggregate and bitumen emulsion composition. Regarding the aggregates, the identification becomes more difficult when dealing with stockpiled RAP, since its random nature makes it composed of many variables. Same goes for bitumen emulsions supplied by industrial producers that often are not willing to share all the details regarding the composition. In this manner, some important aspects of the emulsion chemistry are totally unknown. Of course both issues lead to some uncertainties at the moment of mix-design, since the mechanical properties of CBTM mixtures could change drastically for different aggregate-emulsion combinations.
When a bitumen emulsion is combined with RAP, such as in CBTM mixtures, the assumption that the aged RAP binder does not reactivate, to act as a co-binder, is reasonable. In fact, generally RAP is considered as a “black rock”, i.e. an aggregate phase composed by a reclaimed aggregate partly coated by stiff aged binder. The aged binder is unlikely reactivating at the usual production temperatures of CBTM. Yan, Zhu, Zhang, Gao, & Charmot (2014) evaluated the effect of the presence of RAP in CBTM mixtures mechanical properties and by a finite elements analysis (FEM) analysis. Both protocols confirmed that the presence of RAP improved Indirect Tensile Strength (ITS), high temperature stability, moisture resistance and fatigue performance. According to the analysis, the aged binder in the RAP could act as a cushion between the aggregate phase and the virgin binder, reducing stress and strain fields. In other researches, the bonding resistance at the interface between bitumen emulsion and aggregate surface was evaluated by means of the Binder Bond Strength test (BBS) (Cardone et al., 2018; Graziani, Virgili, et al., 2018; Miller et al., 2010). The test consists in gluing a stub on a mineral flat surface by means of the virgin binder (in this case bitumen emulsion). After a certain period of curing and/or conditioning, the stub is pneumatically pulled out and the