Journal of Applied Fluid Mechanics, Vol. 9, Special Issue 2, pp. 235-243, 2016. Selected papers from the XIIth Franco - Quebec Inter-University
Symposium on Thermal systems -2015
Available online at www.jafmonline.net, ISSN 1735-3645, EISSN 1735-3645.
Analysis of Aged Oil on the Cooling of Power
Transformers from Computational Fluid Dynamics and
Experimental Measurements
K. S. Kassi
1, M. I. Farinas
2†, I. Fofana
1and C. Volat
31Canada Research Chair on Insulating Liquids and Mixed Dielectrics for Electrotechnology (ISOLIME) 2Research Group in Process Engineering and Systems (GRIPS)
3Modeling and Diagnostic of Power Network Equipment Laboratory (MODELE)
Université du Québec à Chicoutimi, Chicoutimi, Québec, G7H2B1, Canada †Corresponding Author Email:Marie-Isabelle_Farinas@uqac.ca
(Received October 8, 2015; accepted December 10, 2015)
A
BSTRACTIn this paper, experimental and numerical investigations were conducted to study the aging impact on the cooling capacity of mineral oils in power transformers. The experimental investigations had three objectives. Firstly the study of the impact of oil aging on its physicochemical properties using two diagnostic techniques which are: DDP (Dissolved Decay Products) according to ASTM (American Society for Testing and Materials)-D6802 standard and Interfacial Tension (IFT) according to ASTM-D971 standard. Secondly,the study of the impact of oil aging on its viscosity according to ASTM D445. Finally the development of empirical equations depicting oil viscosity changes, to be implemented in the numerical model. To achieve this, accelerated thermal aging tests of mineral oil samples were conducted in laboratory conditions according to ASTM D-1934standard. Data from experimental investigations were used to conduct the numerical investigations. A 2D axisymmetric numerical model was developed with COMSOL Multiphysics 4.3a to study the cooling capability of oil aged at different levels. The results indicate that the oil physicochemical properties are affected by aging. Furthermore the results show that the oil viscosity increase with aging and give a good correlation between viscosity and aging indicators. Finally it was found that sludge from oil oxidation byproduct contributes to the formation of hotspots and this leads to a significant increase of hotspot temperature in the power transformers.
Keywords: Power transformer; Viscosity; Aging indicators; CFD; Axisymmetric model; Hotspot; Sludge; Temperature; Velocity; Horizontal duct; Vertical duct; zigzag cooling; Disc-type winding.
N
OMENCLATURE Cp dfs g k p Q I specific heat degrees of freedom gravitational acceleration thermal conductivity pression heat source identity matrix ta Thot u ρ µ ν rate of increase hot spot temperature velocitydensity
dynamic viscosity kinematic viscosity
1. INTRODUCTION
Mineral oils are the most used dielectric fluids in power transformers. The heat generated in a transformer is caused by many losses (core and copper losses) that occur during service. These losses increase exponentially as the load increases (Singh et al. 2008; Krawiec and Leath 2011). Heat
dissipation can be achieved by circulating certain liquids, which also ensure electrical insulation of energized conductors. The insulating liquid ensures not only the insulation function but also the cooling of the live parts. Failing to cool down the transformer, may contribute to its premature aging, including a deterioration of the paper insulation and ultimately the failure of the unit itself. Actually
most power transformers installed worldwide, are almost at the end of their theoretical design life (Richard and Ladroga 2006), while the electricity demand is steadily increasing. In service conditions, the quality of mineral insulating oils gradually deteriorates under the impact of electrical, thermal and environmental/chemical stresses. Normal temperature operating range for transformers is 60 to 100°C that will allow a relatively slow degradation of insulation paper. However, when the operating temperature is increased above 110°C (with ambient temperature at a maximum of 40oC), premature destruction of the solid insulation may starts. In general, when the solid insulation is severely degraded, the transformer has reached the end of its useful life. Practically speaking, the life span of the transformer is directly related to the life span of the solid insulation. Insulating paper in service-aged transformer cannot be replaced with new one without a complete repair of the transformer windings, unlike the oil, which can be replaced as needed. With increasing loads, the risks of thermal degradation are also increased with potential explosion in extreme cases. For these reasons, the management of the aging transformers’ overload has become a very important issue for utilities worldwide (Richard and Ladroga 2006).
2. THEORETICAL
BACKGROUND
This section presents concepts associated to: the flow and cooling of oil in power transformers, the electrical insulation (oil/paper) aging process and the thermal and fluidic properties of the oil.
2.1 Flow and cooling principle of oil in
power transformers
2.1.1 Principle
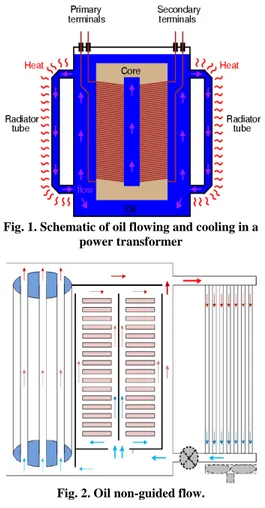
In power transformers, the heat generated by the core and the windings, is dissipated by an insulation liquid. The circuit (from core, low voltagewindings and high voltage windings to external radiators) of heat transportation is represented in Fig. 1(Yamamoto and Yamaguchi 2002). Natural and forced convection are generally the two modes of flow regimes in power transformers. In the natural mode, the force of gravity induces the flow of the fluid, which has a temperature dependent density. The density of the oil is not uniform inside the trans former since a high temperature gradient exists between the windings and the radiator. Inside the radiator, the oil density is higher because the oil is cooled while in the windings, the oil density is lower because the oil is overheated. It is this difference in weight between the two fluid columns that is responsible for the convective motion of the oil in the transformer. In forced convection, the fluid circulation is done by a pump (Torriano et al. 2010). As regards the ambient air around the radiators, it is either forced or unforced (natural). The cooling operation mode is represented by a set of four letters, which define the internal (oil) and outer (air or water) environments and the circulation mechanism. Generally five main cooling modes can
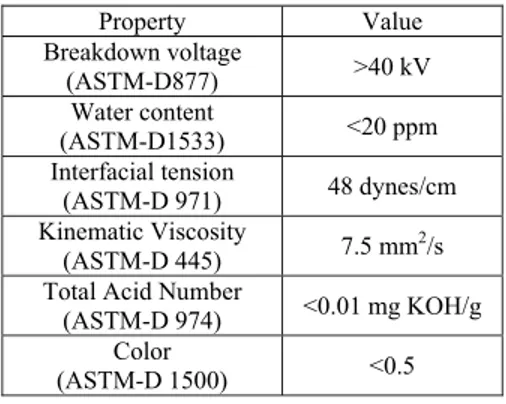
be identified: ONAN (oil natural and air natural), ONAF (oil natural and air forced), OFAF (oil forced and air forced), ODAF (oil directed and air forced), OFWF (oil forced and water forced). Besides the modes of cooling, there are two types of flow in the windings of transformers: the non-guided flow (Fig. 2)(Wei 2011) and the zigzag flow (Fig. 3)(Wei 2011).
Fig. 1. Schematic of oil flowing and cooling in a power transformer
Fig. 2. Oil non-guided flow.
Fig. 3. Oil guided or zigzag flow.
2.1.2
Governing equations
Two physics interact, namely fluid dynamics and heat transfer. In a first approximation, this
conjugate heat transfer is assumed to take place in stationary and laminar regime (Jiahui and Xianguo 2004, 2006 a, b). The heat transfer is governed by the energy equation (Eq. (1)) while fluid dynamics is governed by the Navier Stokes equation (Eq. (2)) and that of the conservation of mass (Eq. (3)).
p
.( k T ) Q
C u T
(1)
T u. u 2 . pI ( u ( u) .u I 3 (2).( u ) 0
(3)2.2 Electrical insulation aging process
The role of insulation system is of paramount importance, in the sense that it is one of the fundamental conditions for the reliable operation of power equipment. Under service condition, both the liquid and solid insulation undergo a slow but steady decay process. As long as chemical bonds inside the insulation chains are not broken, the generations of decay products are impeded. The sources of energy capable of splitting of a covalent bond made up of a pair of electrons are the electrical, mechanical, environmental and thermal stresses (Richard and Ladroga 2006). Moisture, copper and iron (which are primary transformer components), and oxygen act as aging catalysts while, heat, aging by products, dirt, vibration, electrical stresses, etc., accelerate the process. Electrical stress together with heat and moisture in the presence of oxygen oxidises the oil producing free radicals, acids and sludge (Kassi 2013; Kassi et al. 2014 a,b, 2015). These by-products attack on the cellulose fibers and catalyze further oxidation of the oil. Sludge produced may stick on cores and coils obstructing the oil flow passages and thus affecting the heat dissipation. This may result in temperature rise accelerating oxidation and deterioration of the solid insulation. Therefore, monitoring and maintaining oil in pristine condition should be a must, essential to ensuring reliable operation of power transformers. Several ASTM standards test methods have been developed to assess the condition of the oil degradation due to oxidation. Two of them, namely the IFT and DDP are used in this contribution as aging level indicators (ASTM Annual Book 2008): Dissolved Decay Products (DDP): This test method characterizes (by UV-VIS spectrophotometry) the relative level of dissolved decay products (peroxides, aldehydes, ketones, and organic acids) in mineral insulating oils of petroleum origin. The DDP value increases with the degradation of the oil.
Interfacial tension (IFT): This method provides a sensitive means of detecting small amounts of soluble polar contaminants and products of oxidation. The IFT value decreases with the degradation of the oil.
2.3 Oil thermal and fluidic properties
The ability of the oil to capture and remove the heat produced by the active parts (windings, core) of the power transformers is mainly related to four parameters. These parameters are: viscosity dynamic (μ) and kinematic (ν), density (ρ)
thermal conductivity (k) specific heat (Cp)
In this study, emphasis is laid on the effect of the oil viscosity over heat transfer.
3. EXPERIMENTAL
STUDY
Experimental procedure and experimental results are presented and discussed in this section. These are the results of the aging effect on oil physicochemical properties, the results of the impact of oil aging on its viscosity and the results relative to the development of mathematical equations of oil viscosity.
3.1 Characteristics of the investigated oil
In general, manufacturers provide physicochemical and electrical characteristics of their dielectrics fluids. For the oil under investigations, some characteristics are given in Table 1 according to ASTM standards.Table 1 Some physicochemical and electrical properties of the mineral oil under study
Property Value Breakdown voltage (ASTM-D877) >40 kV Water content (ASTM-D1533) <20 ppm Interfacial tension (ASTM-D 971) 48 dynes/cm Kinematic Viscosity (ASTM-D 445) 7.5 mm2/s Total Acid Number
(ASTM-D 974) <0.01 mg KOH/g Color
(ASTM-D 1500) <0.5
3.2 Experimental procedure
Thermal accelerated aging tests of mineral oil samples were conducted in laboratory conditions similar to those specified in the ASTM D-1934 (ASTM Annual Book 2008). This consisted in placing in a convection oven at 115 °C, beakers containing oil and copper as catalyst (a ratio of 15 cm2 for 400 ml of oil was used for the copper). Oil samples were removed from the aging vessel at specific aging times (0, 500 and 1500 hours) for analysis. For each oil sample, some aging indicator tests were performed (IFT and DDP) along with the viscosity according to ASTM-D445 (ASTM-D4452010). The viscosity measurements were performed at temperatures ranging from 20 to 80°C. These data were used to derive empiric equations describing the viscosity as function of temperature,
implemented in the thermo-fluidic numerical model.
3.3 Aging effect on oil physicochemical
properties
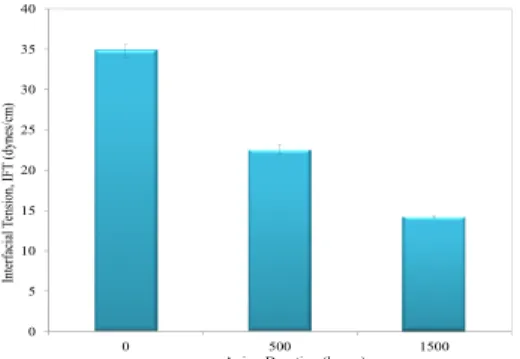
Fig. 4 presents the results of IFT while Fig. 5 presents those of DDP as function of aging duration.
Fig. 4. IFT as a function of aging duration.
Aging Duration (hours)
Fig. 5. DDP as a function of aging duration. The decrease of IFT and the increase of DDP observed respectively in Fig. 4 and Fig. 5; show that the physicochemical properties of the oil are affected during aging.
3.4 Aging effect on oil viscosity
The experimental results obtained for kinematic viscosity are represented as a function of aging duration in Fig. 6.
Fig. 6. Oil kinematic viscosity as a funtion of aging duration.
Out of Fig. 6, it can be observed that kinematic viscosity increase considerably with aging duration. This increases reached ~18% at 1500 hours.This result seems to indicate that oil degradation affects its viscosity.
3.5 Correlation between viscosity and aging
indicators
The experimental results obtained regarding the aging level indicators (DDP and IFT) are represented as a function of the kinematic viscosity in Fig. 7.
Fig. 7. Aging level indicators as a function of the kinematic viscosity.
Subsequently, a mathematical approach of the data revealed empirical equation for each indicator with regression coefficients close to unity. Mathematical relationships of DDP and IFT as a function of the viscosity are given respectively by Eqs. (4) and (5). These equations indicate a very good correlation between the aging indicators and the viscosity.
2
DDP 221,28
3935,6
16858 (4)2
IFT8,4363 148,51666 ,78 (5)
3.6 Empirical equations development
The oil parameters considered in the numerical model are: the dynamic viscosity, the thermal conductivity, the density and the specific heat. In the present contribution, in order to study only the effect of viscosity, the three other parameters are taken to be temperature and aging independent. The empirical equations of the dynamic viscosity as function of temperature, as well as fixed values of thermal conductivity, density and specific heat are implanted in the thermal-fluid numerical model. The equations of dynamic viscosityare developed from the measurements on the oil samples aged at different durations: 0, 500 and 1500 hours. The data of these measurements for the dynamic viscosity are plotted in Fig. 8 and from trend lines whose regression coefficients are close to unity, the mathematical equations are developed for new oil, oils aged at 500 hours and 1500 hours. These equations are given respectively by Eq. (6), Eq. (7) and Eq. (8). 0 5 10 15 20 25 30 35 40 0 500 1500 In te rf aci al T ensi on , I FT (d ynes/ cm )
Aging Duration (hours)
0 100 200 300 400 500 600 700 0 500 1500 DDP (a, u) 7 7,5 8 8,5 0 300 600 900 1200 1500 K inemat ic vi sc osi ty (cSt)
Aging duration (hours) Kinematic Viscosity 1 10 100 1000 7 7,2 7,4 7,6 7,8 8 8,2 8,4 8,6 Agi ng I ndic at or s Kinematic viscosity (cSt) IFT DDP
0 ,9 8 5 n o 22 3 ,88T (6) 2 5 00 0 ,0025T 0 ,4039T 19 ,083 (7) 0 ,0 2 5 1 5 0 0 2 3 ,28 2T (8)
Fig. 8. Dynamic viscosity as a function of temperature for different aging times.
4. NUMERICAL
STUDY
In this section, numerical investigations including numerical results are presented and discussed. These are the results of the meshing study and the study of the aging impact on oil cooling capacity.
4.1 Model Geometry description
The model studied is an axial section in the inter-spacer interval of a column of a three phase guided disc windings transformer. This axial section is represented in Fig. 9 (Jiahui and Xianguo 2004a).
Fig. 9. Axial section of a column of a three phase transformer windings.
The model geometry in 2D axisymmetric developed with COMSOL Multiphysics 4.3a (Fig. 10) is similar to that used in the study conducted by Jiahui et al. (2008) with an experimental prototype. The model is composed of twenty-four disks. Each disc is made of eleven insulated copper bars with cellulose paper and interleaved by ten web-shaped constantan wires used as heating elements. A total of two hundred forty heaters elements made of constantan were used. Two washers made of cellulose pressboard are respectively placed near the disks 8 and 16 so as to force the oil to flow in zigzag mode.
4.2 Materials properties
The oil thermal conductivity, density and specific
Fig.10. Geometry of 2D axisymmetric numerical model.
heat (CIGRE A2-35 2010); the physical properties of copper, constantan, cellulose paper and washer (Torriano et al. 2010) are presented in table 2. These properties are taken at constant temperature (T=20°C).
Table 2 Materials properties
Properties Values Copper kc 401 (W.m-1.K-1) ρc 8933 (kg.m-3) Cpc 385 (W.kg-1.K-1) Constantan kconst 19,5 (W.m-1.K-1) ρconst 8910 (kg.m-3) Cpconst 390 (W.kg-1.K-1) Paper kp 0,19 (W.m-1.K-1) ρp 930 (kg.m-3) Cpp 1340 (W.kg-1.K-1) Washer kw 0,19 (W.m-1.K-1) ρw 930 (kg.m-3) Cpw 1340 (W.kg-1.K-1) Oil kf 0,126 (W.m-1.K-1) ρf 880 (kg.m-3) Cpf 1860 (W.kg-1.K-1)
4.3 Boundary conditions
To solve the equations (Eqs. (1) to (3)) governing the two fields of physics (fluid dynamics and heat transfer) by the finite element method (FEM) using COMSOL Multiphysics 4.3a software, boundary conditions are required. Non-slip conditions are applied at interior walls. The outer walls with the exception of the inlet and the outlet of the oil are assumed to be adiabatic. A heat source (Q = 4,54W) is imposed in each of the two hundred forty heating
y = 223,88x-0,985 R² = 0,9927 y = 0,0025x2- 0,4039x + 19,083 R² = 0,9972 y = 23,282e-0,025x R² = 0,9998 2 4 6 8 10 12 14 16 20 30 40 50 60 70 80 Dy nam ic V isco sity ( m P a s) Temperature (°C) New oil oil aged at 500 hours Oil aged at 1500 hours
Copper Paper Constantan 1 8 16 24 Oil r z Oil input Oil output r = 0 180 mm a b c d a = 9,525 mm b = 13,7 mm c = 6,2 mm d = 12,7 mm e = 8,1 mm e 2 1 2 10 11 Washer
element made of constantan. A total heat source of 1089, 6W was considered. The oil inlet temperature and its velocity are set at 50°C and 50 mm/s. At the outlet, the pressure is set to zero and a convection heat condition is imposed.
4.4 Meshing study
The aim of this study is to
ensure the
convergence of calculations and
that numerical results are independent of the mesh type. For that a numerical study was conducted for three types of mesh sizes. The case of new oil is considered. The three meshes are composed respectively of 542451 (mesh 1), 1003064 (mesh 2) and 1282817 (mesh 3) triangular elements. Linear interpolants are used. Temperature distributions on the central vertical line are presented in Fig. 11 and those in the vertical canal 2are presented in Fig. 12. Fig 13 presents velocity distributions in the vertical canal 2.Fig. 11. Temperature distribution on the central vertical line.
Fig. 12. Temperature distribution in the vertical canal 2.
Fig. 13. Velocity distribution in the vertical canal 2.
Table 3 Meshes and hotspot temperatures Mesh dfs Thot, °C ΔT, °C
1 427094 53.2 0
2 940515 53.5 0.3
3 1310963 53.5 0.3
The analysis of results of Fig. 11 to Fig. 13 indicates that temperature and velocity profiles for meshes 2 and 3, are very similar. In addition hotspot temperatures value for meshes 2 and 3 grouped in table 3 are almost identical. At the end of this study, the mesh size 2 (1003064 triangular elements) was chosen for the continuation of the numerical study. The convergence criterion was fixed at 10-5.Another mesh study, which gave similar results, was done for the specific case of oil aged at 1500 hours. Its computational domain was modified because of the formation of sludge in the oil at a certain stage of aging. The presence of sludge was simulated by obstructing some horizontal channels with circles. After the meshing study, a mesh of 1075298 triangular elements was chosen, for the continuation of the numerical study.
4.5 Aging impact on oil cooling capacity
The developed equations in section 3.6 (Eq. (6) to Eq. (8)) are used to do this study. Three models are developed respectively for new oil, oil aged at 500 hours and oil aged at 1500 hours. All data imported from FEM simulations were processed using Microsoft Excel 2010 software.4.5.1 Temperature analysis
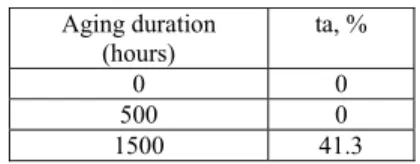
The hot spot temperature values and the rate of increase of hot spot temperature of aged oils relative to that of new oil as function of aging duration are grouped respectively in Tables 4 and 5.
Table 4 Hotspot temperature as function of aging duration Aging duration (hours) Thot, °C 0 53.5 500 53.5 1500 75.6
Table 5 Rate of increase of hotspot temperature as function of aging duration
Aging duration
(hours) ta, %
0 0 500 0 1500 41.3 The analyses of results of Table 4 indicate that the values of hot spot temperature for fresh oil and oil aged at 500 hours are substantially the same while that of the oil aged at 1500 hours are much higher than those of new oil and oil aged at 500 hours. Consequently the aging has a significant effect on the hotspot temperature value increasing, about 41% as mentioned in table 5. Fig 14 depicts in two 49,5 50 50,5 51 51,5 52 52,5 53 53,5 0,1 0,15 0,2 0,25 0,3 0,35 0,4 0,45 0,5 Te mp er at ure (° C) z-coordinate (m) Central vertical Line_mesh 1 Central vertical Line_mesh 2 Central vertical Line_mesh 3
49,8 50 50,2 50,4 50,6 50,8 51 51,2 51,4 51,6 51,8 0,1 0,2 0,3 0,4 0,5 Te m p er at u re ( °C ) z-coordinate (m) Vertical canal 2_mesh1 Vertical canal 2_mesh2 Vertical canal 2_mesh 3
0 0,005 0,01 0,015 0,02 0,025 0,03 0,035 0,04 0,045 0,05 0,1 0,2 0,3 0,4 0,5 Ve lo ci ty ( m /s ) z-coordinate (m) Vertical canal 2_mesh1 Vertical canal 2_mesh2 Vertical canal 2_mesh 3
dimensions temperature distribution obtained with the numerical model for various periods of aging. Out of Fig. 14, it can be observed that the temperature distributions obtained for new oil and oil aged at 500 hours are similar. Moreover, these distributions do not present any hotspot. Unlike the case of new oil and oil aged at 500 hours, three hotspots are observed in the case of oil aged at 1500 hours. The first hotspot covers the discs 3 to 5, the second discs 11 to 13 and the third discs 19 to 23.
(a) (b) (c) Fig. 14. Distribution of temperature (a)-new oil
(b)-oil aged at 500 hours (c)- oil aged at 1500 hours.
In order to highlight the values of temperature in the three hotspots, temperature data of central vertical line of each aging duration are plotted in Fig. 15. The analysis of results reported in Fig. 15 indicates that the values of temperature for oil aged at 1500 hours are largely higher than those of new oil and oil aged at 500 hours, especially in the zones covered by the three hotspots.
Fig. 15. Temperature distribution on the central vertical line.
According to the above results, up to 500 hours, the oil aging has no impact on its cooling capacity. From 1500 hours, because of the presence of sludge in oil, some horizontal channels are clogged. This is followed by the formation of hotspots and a very significant increase in the hotspot temperature. This results in a higher risk of degradation of the solid insulation (paper), and consequently a considerable negative impact on the life of the transformer.
4.5.2 Velocity analysis
Fig 16 depicts in two dimensions (2D), the velocity distribution obtained with the numerical model for various periods of aging. It can be observed that the velocity distributions obtained for new oil and oil aged at 500 hours are similar. For oil aged at 1500 hours, because of the presence of sludge in oil, some horizontal channels are clogged and the oil is forced to circulate only in the non-clogged horizontal ducts. This reduction of the number of the oil flow channels is responsible of the increase of the flow velocity value.
Fig. 16. Distribution of velocity (a)-new oil (b)-oil aged at 500 hours (c)- oil aged at 1500 hours. In order to highlight the impact of the reduction of the number of the oil flow channels on the velocity amplitude in the case of oil aged at 1500 hours, velocity profiles on the central vertical line are plotted in Fig. 17. Out of Fig. 17, it can be observed that in the case of oil aged at 1500 hours, velocity value is nonzero only in the horizontal channels 1, 8, 9, 16 and 17 while it is nonzero in all the ducts for the cases of new oil and oil aged at 500 hours. In the ducts 1, 8, 9, 16 and 17, velocity amplitude for the case of oil aged at 1500 hours is much higher than those of new oil and oil aged at 500 hours.
Fig. 17. Velocity distribution on the central vertical line.
This flow with higher velocity in a limited number of horizontal channels justify the formation of hot spots and the increase of the hotspot temperature as presented in section 4.5.1. In fact oil is prevented to flow through all the twenty five channels to remove heat produced by the heating elements.
(a) (b) (c) 49 54 59 64 69 74 79 0 0,1 0,2 0,3 0,4 0,5 T em p er at u re (° C ) z-coordinate (m) Central vertical Line_New oil Central vertical Line_Oil aged at 500 hours Central vertical Line_Oil aged at 1500 hours
0 0,01 0,02 0,03 0,04 0,05 0,06 0,07 0,08 0,09 0 0,1 0,2 0,3 0,4 0,5 V eloc ity (m /s) z-coordinate (m) Central vertical Line_New oil Central vertical Line_Oil aged at 500 hours Central vertical Line_Oil aged at 1500 hours
4.5.4 Study of the impact of sludge position
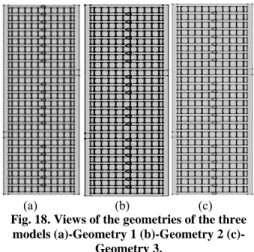
The aim of this section is to verify if sludge position inside the horizontal ducts for the case of the oil aged at 1500 hours has an impact on hotspot temperature. Several models were studied and three of them are presented and discussed in this section. The geometries of the three models studied are depicted in Fig. 18. Each geometry contains 25 horizontal ducts numbered from bottom to top and the difference between geometries is the position of the non-blocked ducts. The non-blocked ducts for geometries 1, 2 and 3are given respectively by: 1, 8, 9, 16 and 17; 1, 9, 13, 17 and 25; 8, 9, 16, 17 and 25.Fig. 18. Views of the geometries of the three models (a)-Geometry 1 (b)-Geometry 2
(c)-Geometry 3.
The hot spot temperature values obtained from numerical simulations are presented in Table 6.
Table 6 Hot spot temperature values as a function of geometry number. Geometry number Thot, °C ΔT, °C 1 75.5 0 2 73.6 1.9 3 77.5 2
The analysis of results of Table 6 indicates that the hotspot temperature value varies either by increasing or decreasing as function of the type of geometry. In other words sludge position inside the horizontal ducts has an impact on the hotspot temperature value. Fig 19 depicts in two dimensions temperature distribution obtained with the numerical model for various periods of aging. Out of Fig. 19, it can be observed that the temperature distributions obtained for the three levels of aging are quite different. In fact comparatively to geometry 1, in the case of geometry 2 four hotspots are observed and in the case of geometry 3 the first hotspot from the bottom upwards is moved to the left side of the disks2 to 6.
From analyses above sludge position inside the horizontal ducts has an impact on hotspot temperature value and on hotspot position and number.
Fig. 21. Distribution of temperature of the three models (a)-Geometry 1 (b)-Geometry 2
(c)-Geometry 3.
5. C
ONCLUSIONAging of mineral oils result in the production of degradation products, which are mainly dissolved oxidation products, non-soluble products or colloidal. These degradation products affect the quality of the oil, as well as its viscosity. In the present contribution, a thermo-fluid multi physics numerical model was developed using experimental data from accelerated thermal aging procedures in laboratory. Experimental measurements were intended to study the impact of the oil aging on its cooling capacity and to establish the possible correlation between aging level indicators and viscosity. The measurements have shown that there is a very good correlation between the aging level indicators (DDP and IFT) and viscosity. This correlation has a significant impact, in the sense that it can help to judge the quality of the oil based on its viscosity. From the results of simulations, it appears that the aging of the oil at 1500 h significantly affects its cooling capacity, thus resulting in the formation of hotspots in the transformer windings and a very significant increase of the hotspot temperature estimated at over41%. This results in a higher risk of degradation of the solid insulation covering the copper conductors of transformer windings, and consequently a considerable negative impact on the life of the transformer. Future works will make use of variable thermal conductivity and specific heat into the numerical model in a similar way as the work of Mahanti N.C. and P. Gaur (2009). These heat transfer parameters will be studied in a likewise manner as viscosity. Also, like the work of Mehdizadeh A (2008), deposition will be studied and also input into the numerical model, in order to find realistic sludge positions, and therefore identify more accurately the impact of hotspot temperature from oil aging.
R
EFERENCESASTM Annual Book (2008).Standards of Electrical Insulating Liquids and Gases; Electrical Protective Equipment. 10(3).
(a) (b) (c)
ASTM D445 (2010).Standard Test Method for Kinematic Viscosity of Transparent and Opaque Liquids (and Calculation of Dynamic Viscosity).5(1).
CIGRE A2-35 (2010, October). Experiences in service with new insulating liquids.https://books.google.ca/books/about/Ex periences_in_Service_with_New_Insulati.html ?id=wTFHtwAACAAJ&redir_esc=y.
Jiahui, Z. and L. Xianguo (2004). Coolant flow distribution and pressure loss in ONAN transformer windings Part I: Theory and model development. IEEE Transactions on Power Delivery, 19(1), 186-193.
Jiahui, Z. and L. Xianguo (2006). Oil cooling for disk-type transformer windings-part 1: theory and model development. IEEE Transactions on Power Delivery, 21(3), 1318-1325.
Jiahui, Z. and L. Xianguo (2006). Oil cooling for disk-type transformer windings-part II: parametric studies of design parameters. IEEE Transactions on Power Delivery, 21(3), 1326-1332.
Jiahui, Z., X. Li, and M. Vance (2008). Experiments and modeling of heat transfer in oil transformer winding with zigzag cooling ducts. Journal of Applied Thermal Engineering, 28(1), 36-48. Kassi, K. S. (2013, December). Étude de l’isolation
hybride en vue de son application dans les transformateurs de puissance.MScthesis, Université du Québec à Chicoutimi, Chicoutimi, Québec, Canada.
Kassi, K. S., I. Fofana, F. Meghnefi, and Z. Yeo (2015, May).Impact of local overheating on conventional and hybrid insulations for power transformers.IEEE Transactions on Dielectrics and Electrical Insulation (in press).
Kassi, K. S., I. Fofana, F. Megnefhi, A. Betie, and Z. Yeo (2014). Decay products in mineral oil: A comparative study between hybrid and conventional insulation systems. Proceedings of the 18th IEEE International Conference on Dielectric Liquids (ICDL),Bled, slovenia, 1-4. Kassi, K. S., I. Fofana, F. Megnefhi, A. Betie, Z.
Yeo, and J. Perron(2014).Comparative study between conventional and hybrid solid insulation systems.Proceedings of the in IEEE Conference of Electrical Insulation and Dielectric Phenomena (CEIDP), Des Moines Marriott Downtown, IA , USA, 498-501. Krawiec S. and S. Leath, (2011, August). Improved
heat transfer capability using iso-paraffins versus naphthenics in transformers. In Proceedings of the in the 78th annual international conference of Doble Clients, 85 WalnutSt., Watertown, MA 02472, USA. Mahanti N.C. and P. Gaur (2009). Effects of
Varying Viscosity and Thermal Conductivity on Steady Free Convective Flow and Heat Transfer Along an Isothermal Vertical Plate in the Presence of Heat Sink. Journal of Applied Fluid Mechanics (JAFM), 2(1), 23-28. Mehdizadeh A., B. Firoozabadi, and B. Farhanieh
(2008). Numerical Simulation of Turbidity Current Using v2- f Turbulence Model. Journal of Applied Fluid Mechanics (JAFM). 1(2), 45-55.
Richard, K. and P. Ladroga (2006). Large power transformer condition assessment and life extension. InterNational Electrical Testing Association, NETA WORLD, 1–5
Singh J, Y. R Sood. and R. K. Jarial (2008). Condition Monitoring of Power Transformers - Bibliography Survey. IEEE Electrical Insulation Magazine, 24(3), 11-25.
Torriano, F., M.Chaaban, and P.Picher(2010).Numerical study of parameters affecting the temperature distribution in a disc-type transformer winding.Journal of Applied Thermal Engineering, 30(14-15), 2034-2044. Wei, W. (2011).CFD calibrated thermal network
modelling for oil-cooled power transformers. PhD thesis, University of Manchester, School of Electrical and Electronic Engineering, Manchester, UK.
Yamamoto, M. and M. Yamaguchi (2002).Electric Power In Japan, Rapid Electrification a Century ago.http://www.ibiblio.org/kuphaldt/electricCir cuits/AC/AC_9.html.