99-07 A DISTINCT METROPOLIS FOR A DISTINCT SOCIETY? : THE ECONOMIC RESTRUCTURING OF MONTRÉAL IN THE CANADIAN CONTEXT William J. COFFEY et Mario POLÈSE
INRS-Urbanisation
Mai 1999 3465, rue Durocher Montréal, Québec H2X 2C6A DISTINCT METROPOLIS FOR A DISTINCT
SOCIETY?: THE ECONOMIC RESTRUCTURING OF
MONTREAL IN THE CANADIAN CONTEXT
William J. COFFEY Département de géographie Université de Montréal C.P. 6128, Succ. Centre-ville Montréal, Québec H3C 3J7 Mario POLÈSE INRS-Urbanisation 3465, rue Durocher Montréal, Québec H2X 2C6
Prepared for the special issue of the Canadian Journal of Regional Science on Comparative Development in Montreal and Toronto
ABSTRACT
Much of the literature on the Montreal economy suggests that, in one way or another, the latter has been, and remains, substantially different from that of Canada’s other large metropolitan areas. Certain researchers have suggested that Montreal is “structurally challenged”, that is, characterised by an out-moded economic structure based largely upon traditional industries. A more recent theme in the literature suggests that Montreal is still different, but now because it has become one of North America’s emerging high technology centres. In this article, we examine the thesis that Montreal is structurally distinct by specifically comparing Montreal and Toronto, and by more generally situating the two in the broader context of Canada’s eight largest metropolitan areas. The analysis covers the period 1981-1996, and examines economic structure in terms of sector, occupation and major metropolitan functions. Our results indicate that, except for several very specific aspects, Montreal’s economic structure is not very different from that of Toronto. Further, when compared to the group of eight large metropolitan areas, Montreal’s economic structure is not particularly distinct; according to several indicators Montreal is, rather, quite “average”.
RÉSUMÉ
Un courant important de la littérature sur l’économie de Montréal soutient que, d’une façon ou d’une autre, sa structure économique est différente de celle des autres grandes régions métropolitaines canadiennes. Certains chercheurs concluent que Montréal se caractérise par une structure économique démodée, étant basée sur les industries traditionnelles. Un courant plus récent suggère que Montréal se distingue dorénavant en raison de son statut émergeant comme centre de haute technologie. Dans cet article, nous examinons la thèse du caractère distinct de Montréal, en com-parant Montréal et Toronto et, plus généralement, en situant ces deux métropoles dans le contexte des huit plus grandes régions métropolitaines canadiennes. Notre analyse, qui couvre la période 1981-1991, examine la structure économique métropolitaine sous l’angle des secteurs, des professions et des fonctions métropolitaines. Nos résultats indiquent que, sauf dans le cas de certains aspects précis, la structure économique de Montréal ressemble à celle de Toronto et des huit grandes métropoles canadiennes. Loin d’être distincte, la structure économique de Montréal semble plutôt «moyenne».
I
NTRODUCTIONA current point of cultural and constitutional contention in Canada concerns the status of the Province of Quebec as a “distinct society”. While a comprehensive treat-ment of this issue is beyond our scholarly competence (and also beyond the finite limits of our energy), we note that there exists an interesting parallel between this question and an important debate situated within our own field of regional science. Much of the past and current literature on the economic structure and performance of Montreal, Quebec’s largest (and Canada’s second largest) metropolitan area, suggests that, in one way or another, Montreal has been, and remains, substantially different from the nation’s other large census metropolitan areas (CMAs). Certain researchers (e.g., Chung 1974; Higgins 1986; Côté 1991) have written that Montreal is characterised by an out-moded economic structure based largely upon traditional industries (“structurally challenged” would be the politically correct description of this condition). The well-documented economic decline of Montreal, particularly in relation to Toronto, the argument runs, is thus principally structural in its antecedents. The logical extension of this line of reasoning is that if Montreal’s economic structure can be modernised, its decline can be reversed. On the other hand, a more recent theme in the literature (e.g., Lapointe and Fortin 1998) suggests that Montreal remains different from the other large Canadian CMAs, but now because it has become one of North America’s emerging high technology centres. The implication of this school of thought is that Montreal may be well on its way to correcting its “structural defects” and, thus, reversing its decline.
In this article we critically examine the notion that, in terms of its economic structure and performance, Montreal is somehow distinct. Our basis of comparison is specifically Toronto; more generally, however, we also include the aggregated group of Canada’s eight largest CMAs: Toronto, Montreal, Vancouver, Ottawa-Hull, Edmonton, Calgary, Quebec and Winnipeg. The empirical analysis that we present, which covers the period 1981 to 1996, is based upon three indicators of economic structure: sector, function and occupation. The present research is the most recent in a long line of analyses by ourselves (e.g. Coffey and Polèse 1989, 1993; Polèse 1990) and others (see, for example, the authors cited above) that have sought to examine the Montreal economy and, in particular, its position relative to Toronto.
The following section describes the data that we employ and defines the concepts of sectoral, functional and occupational structure. Next, we present our empirical analysis, based upon these three concepts. Finally, we integrate our results into a discussion concerning the current economic role of Montreal in the Canadian context.
2
D
ATA AND DEFINITIONSThe analyses presented here utilise employment by place of residence data, collected by the 1981 and 1996 Censuses of Canada. The basic concept underlying these data is that of the “employed labour force”: those persons who held a remunerated job during the week immediately preceding Census Day of the relevant year. The 1981 and 1996 data have been standardised to control for changes in sectoral definitions that may have occurred between the 1981 and 1996 Censuses. The comparison of occupational data between 1981 and 1996 is, however, problematic. Unlike changes to the sectoral definitions (the Standard Industrial Classification), where detailed classes of activities have been generally kept together and moved from one major group to another -- thus permitting equivalences to be easily established, the 1991 modification to the Standard Occupational Classification (which applies to the 1996 data only) has often divided detailed occupational classes and reapportioned these fragments among several major occupational groups. It thus becomes impossible to establish an exact correspondence between the occupational definitions employed in 1981 and 1996. Thus, where occupational groups are involved, while a cross-sectional comparison of CMAs in any given year will yield valid results, a longitudinal analysis of any one CMA will generally display discontinuities induced by changing definitions.
Sectoral classification
The concept of “economic sector” is conventionally utilised to sub-divide an economy into relatively homogeneous groups of activities. Individual firms, and thus their employees, are assigned to economic sectors on the basis of the “finished product” that results from each firm’s activity. Thus, an individual establishment (and its employees) within a mining or a manufacturing firm -- a head office or a research laboratory, for example -- will be classified, along with the rest of the firm (and the rest of the firm’s employees), in the primary or manufacturing sector, even though the establishment itself (and its employees) may, in reality, be more correctly regarded as fulfilling a high-order service function. For this reason, when describing the structure of an economy, the use of sector alone may prove to be somewhat misleading; in particular, the extent of service-related activities within “goods-producing” firms tend to be under-estimated by sectoral classifications.
Occupational classification
A complementary manner of categorising the employed labour force is in terms of occupation, rather than economic sector. Occupation refers to “the kind of work performed” (i.e., the duties and tasks carried out) by a person, irrespective of the kind of
3
business (and thus the economic sector) in which this work is accomplished. A lawyer or an accountant will generally perform the same type of work (fulfil the same economic role) irrespective of whether he/she is employed by a manufacturing firm or a computer services firm. Further, in this manner, service-related occupations (e.g. managers, engineers, accountants and lawyers) within “goods-producing” firms may be readily identified. In this paper, we focus upon two “high information content” occupational groups in particular: managers & administrators and scientific & engineering personnel.
Functional classification
Finally, our analysis employs the concept of “major metropolitan functions”. An economic function is an alternative manner of considering the structure of a metropolitan area. Although using individual economic sectors as its building-blocks, a functional classification differs from a conventional sectoral classification in that the former combines activities that are functionally related in spite of being classified over a wide range of specific economic sectors. In other words, a functional classification logically groups activities that are both complementary and interdependent. In our experience, large metropolitan areas distinguish themselves from smaller metropolitan and urban areas in terms of the economic functions that they fulfil. Four functions in particular characterise major metropolitan areas and form the basis for our analysis:
1. A culture and media function, often referred to as “the entertainment industry”: book and magazine publishing; film production and distribution; cinemas; radio and television broadcasting; theatres and staged entertain-ment; amusement and recreation services.
2. A distribution and marketing function that involves advertising and marketing agencies; wholesale trade; moving and storage activities.
3. A command and control function that includes accounting; management consulting; and finance, insurance and real estate services.
4. A high technology function involving both manufacturing activities (aerospace
activities; business machines; pharmaceuticals and biotechnological products; scientific and professional equipment; and telecommunications equipment) and service activities (computer services; engineering and scientific services).
E
MPIRICAL ANALYSISIn this section, we systematically examine the relative position of Montreal with respect to 1) Toronto and 2) the aggregated set of eight large Canadian CMAs (Toronto, Montreal, Vancouver, Ottawa-Hull, Edmonton, Calgary, Quebec and Winnipeg),
4
according to the three indicators that we have identified above: sector, function and occupation. In our analyses, we examine both employment structure and employment growth over the period 1981-1996.
Sectoral analysis
Table 1 indicates the relative share and the growth rate of employment in 13 aggregated economic sectors, as well as in the larger goods-producing and service-producing categories, for Montreal, Toronto and the eight-CMA group over the study period. In general, the sectoral profiles of Montreal and Toronto are remarkably similar, and these, in turn, are very similar to the aggregate profile of the eight large CMAs. While the share of employment in the service sector is virtually identical in Montreal and Toronto (78.2% vs. 77.9% in 1996), both CMAs are less tertiarized than the aggregate set of eight large CMAs (80.0%). In fact, only Calgary (77.6%, not shown), on the basis of its primary and construction sectors, is less tertiarized than Montreal and Toronto. In terms of individual sectors, Montreal (17.2%) and Toronto (16.7%) have a substantially larger share of employment in manufacturing than the eight-CMA group (13.6%); in third position among the eight CMAs is Winnipeg (13.0%, not shown). The major difference between Montreal and Toronto comes in the two high-order service groups: finance, insurance and real estate (FIRE), and business services. In the FIRE sector, Montreal’s 1996 employment share (6.4%) is below that of Toronto (9.2%), and below that of the eight-CMA group (7.3%). Note that the gap between Montreal and Toronto has increased by 0.8 percentage points over the study period. In the business services sector, the same pattern is reproduced: Montreal’s percentage (8.3) is below both that of Toronto (10.3) and that of the group (9.0). Montreal ranks fourth among the eight CMAs in terms of its 1996 share of employment in the FIRE sector, and fifth in terms of business services. Toronto ranks first and second (behind Calgary), respectively, in these two sectors.
Where growth rates are concerned, total employment grew more slowly in Montreal (18.7%) than in Toronto (24.8%) or in the eight-CMA group (25.9%). The difference between Montreal and Toronto was fairly significant in the FIRE sector: 13.3% vs. 32.5%, respectively. Interestingly, however, the rate of growth for business service employment was slightly higher in Montreal (88.7%) than in Toronto (83.2%) over the period, although in absolute numbers the performance of Toronto was superior (313.6 thousand vs. 185.2 thousand). Mention should also be made of the transportation, communications & public utilities sector. Although the share of total employment in this sector is higher in Montreal than in Toronto, the performance of Montreal (-4.2%) is well below that of Toronto (14.1%) and the group of eight CMAs (8.7%). Indeed, Montreal and Winnipeg (-5.1%, not shown) are the only two CMAs to have experienced employment decline in this sector over the period.
5
Table 1 – Sectoral structure and growth rates: Montreal, Toronto and 8 large CMAs, 1981-1996
Montréal Toronto 8 CMAs Sector emp. share gr. rate emp. share gr. rate emp. share gr. rate (%) (%) (%) (%) (%) (%) Primary 1981 0,7 1,0 1,9 1996 0,7 28,9 0,7 -12,0 1,6 2,3 Manufacturing 1981 23,7 23,5 18,4 1996 17,2 -13,9 16,7 -11,4 13,6 -7,4 Construction 1981 4,3 5,5 6,0 1996 3,8 3,8 4,7 6,0 4,9 2,5 SUB-TOTAL: 1981 28,8 30,0 26,4 GOODS-PRODUCING 1996 21,8 -10,2 22,1 -8,2 20,0 -4,4 Transportation, communications, 1981 10,2 8,2 9,2 public utilities 1996 8,3 -4,2 7,5 14,1 8,0 8,7 Wholesale trade 1981 5,8 6,5 5,9 1996 6,3 30,4 6,6 26,1 6,0 28,8 Retail trade 1981 11,8 11,8 11,9 1996 12,5 25,5 11,6 22,9 12,0 26,7 Consumer services 1981 5,7 5,8 5,7 1996 8,0 66,5 8,2 76,6 8,2 81,5 Accommodation & food services 1981 4,8 5,0 5,2
1996 5,7 39,8 5,7 43,9 6,3 52,7 Finance, insurance & 1981 6,7 8,7 7,3 real estate 1996 6,4 13,3 9,2 32,5 7,3 25,1 Business services 1981 5,2 7,0 6,1
1996 8,3 88,7 10,3 83,2 9,0 85,3
Education 1981 6,9 5,9 6,6
1996 7,3 24,3 6,5 38,0 7,1 36,1 Health & social services 1981 8,3 6,0 7,4
1996 10,5 49,9 8,4 76,3 9,7 64,8 Public Administration 1981 5,7 5,2 8,3 1996 5,0 3,8 3,9 -6,4 6,4 -2,7 SUB-TOTAL: 1981 71,2 70,0 73,6 SERVICE-PRODUCING 1996 78,2 30,4 77,9 39,0 80,0 36,8 ALL SECTORS 1981 100,0 100,0 100,0 1996 100,0 18,7 100,0 24,8 100,0 25,9
6
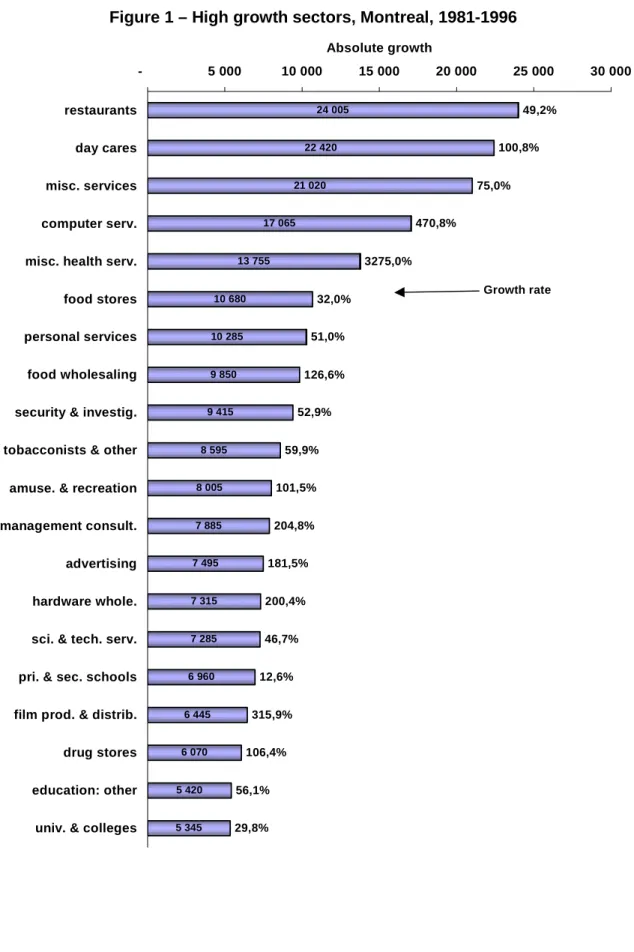
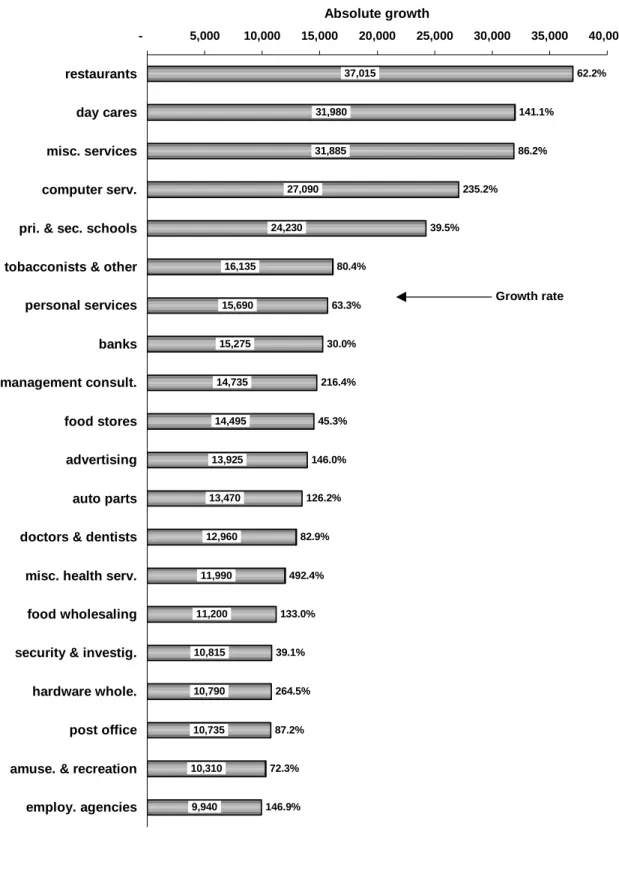
The theme of similarity between Montreal and Toronto is further reinforced when one examines the individual detailed-level sectors (among a total of 160) that experienced the largest gains in employment over the period 1981-1996. Figures 1 and 2 indicate the 20 sectors that experienced the largest absolute gains in employment in Montreal and Toronto, as well as the growth rate of each sector. Fifteen sectors may be found jointly on the “top 20” list of each CMA. The five sectors that are present in Montreal but absent in Toronto are: scientific & technical services, film production & distribution, other teaching, universities & colleges, and drug stores; the first four sectors of this group are characterised by a high level of intellectual or creative input. On the other hand, the five sectors that appear in Toronto but not in Montreal are not generally of this nature: banks, auto parts, offices of doctors & dentists, post offices, and employment agencies. Note, further, that all of the “top 20” sectors identified, with the exception of the fabrication of automobile parts in Toronto, are service activities.
When one examines the sectors that experienced the largest absolute declines in employment over the period (not shown), the similarity between Montreal and Toronto is somewhat less striking; only seven sectors appear jointly in the two CMAs: knitting mills, rail transportation, general merchandise stores, metal products, shoes & leather products, highway maintenance, and bakeries. In the case of both metropolitan areas, however, the largest employment decreases are clearly in the manufacturing sector, and, like most metropolitan areas in developed economies, generally in low value added or traditional manufacturing activities. The loss of manufacturing employment in Toronto has some surprising aspects, however; a significant proportion of job loss is found in sectors that are generally considered to be “high technology” activities: aircraft & aircraft parts (3.8 thousand jobs lost), scientific equipment (3.7 thousand), telecommunications equipment (2.5 thousand), and industrial electric equipment (2.8 thousand). In Montreal, the only “high tech” sector to lose employment was business machines (1.7 thousand).
7
Figure 1 – High growth sectors, Montreal, 1981-1996
24 005 22 420 21 020 17 065 13 755 10 680 10 285 9 850 9 415 8 595 8 005 7 885 7 495 7 315 7 285 6 960 6 445 6 070 5 420 5 345 49,2% 100,8% 75,0% 470,8% 3275,0% 32,0% 51,0% 126,6% 52,9% 59,9% 101,5% 204,8% 181,5% 200,4% 46,7% 12,6% 315,9% 106,4% 56,1% 29,8% - 5 000 10 000 15 000 20 000 25 000 30 000 restaurants day cares misc. services computer serv. misc. health serv. food stores personal services food wholesaling security & investig. tobacconists & other amuse. & recreation management consult. advertising hardware whole. sci. & tech. serv. pri. & sec. schools film prod. & distrib. drug stores education: other univ. & colleges
Absolute growth
8
Figure 2 – High growth sectors, Toronto, 1981-1996
37,015 31,980 31,885 27,090 24,230 16,135 15,690 15,275 14,735 14,495 13,925 13,470 12,960 11,990 11,200 10,815 10,790 10,735 10,310 9,940 62.2% 141.1% 86.2% 235.2% 39.5% 80.4% 63.3% 30.0% 216.4% 45.3% 146.0% 126.2% 82.9% 492.4% 133.0% 39.1% 264.5% 87.2% 72.3% 146.9% - 5,000 10,000 15,000 20,000 25,000 30,000 35,000 40,000 restaurants day cares misc. services computer serv. pri. & sec. schools tobacconists & other personal services banks management consult. food stores advertising auto parts doctors & dentists misc. health serv. food wholesaling security & investig. hardware whole. post office amuse. & recreation employ. agencies
Absolute growth
9 Functional analysis
Table 2 indicates the relative share and the growth rate of employment in the four major metropolitan functions in Montreal and Toronto as well as the eight-CMA group over the study period. In the case of three of the four functions (i.e., with the exception of high technology), Montreal’s share of total employment is less than that of Toronto. It is in the command & control function where the gap between Montreal and Toronto is the largest (7.4% vs. 11.3%, respectively, in 1996); the gap has almost doubled since 1981. Similarly, with the exception of the command & control function, the relative share of Montreal exceeds (slightly) the share of the eight-CMA group. Among the eight CMAs (analysis not shown), Montreal’s share of employment in the culture & media function in 1996 merits a second place (after Toronto); Montreal is tied with Vancouver for second place (again behind Toronto) in distribution & marketing; it is in third place (behind Calgary and Ottawa-Hull) in high technology, and in fifth position (behind Toronto, Vancouver, Quebec, and Calgary) in command & control functions. Where the total of the four metropolitan functions is concerned, Montreal’s employment share (24.9%) is less than that of both Toronto (29.6%) and the eight-CMA group (25.5%). According to this measure, Montreal finds itself in fourth position in 1996 behind Toronto, Calgary and Vancouver. In 1981, however, Montreal was tied with Calgary for second position. Thus, Montreal’s share of employment in those functions that normally characterise a large metropolitan area is rather weak; two smaller CMAs, Vancouver and Calgary, have relatively more employment in these functions than does Montreal. In addition, over the period 1981-1996, Montreal has seen its relative position within the Canadian urban system decline with respect to these major metropolitan functions.
The two sub-components of the high technology function – high technology services and high technology manufacturing – merit special mention. In the case of the former, Montreal’s relative share of employment (2.9%) is slightly lower than that of both Toronto and the eight-CMA group (both 3.3%). In fact, among the eight CMAs, Montreal’s share merits only a fifth position, behind Calgary (5.3%), Ottawa-Hull, Vancouver, and Toronto. On the other hand, where high technology manufacturing is concerned, Montreal’s relative employment share (2.9% in 1996) surpasses that of both Toronto (2.1%) and the eight-CMA group (2.0%); indeed, Montreal is tied with Ottawa-Hull for the first position among the eight CMAs. Table 3 presents more detail on high technology manufacturing in five CMAs; the CMAs in which high technology manufacturing activity is relatively unimportant -- Edmonton, Quebec and Winnipeg -- have been eliminated from the table for ease of presentation. In spite of Montreal’s secondary position in the Canadian economy (Toronto had over 500 thousand more jobs than Montreal in 1996), in absolute numbers high technology manufacturing employment in Montreal exceeds that in Toronto. Montreal’s particular strengths are in aircraft & aircraft parts and telecommunications equipment. In these two sectors, Montreal
10
accounts for approximately two-thirds and one-third, respectively, of the aggregate employment across the five large CMAs. On the other hand, Montreal’s employment is relatively weak in the business machine sector. Ottawa-Hull and Calgary are relatively specialized in telecommunications equipment and business machines, respectively, while Toronto’s profile is much more even across the five sectors.
Table 2 – Functional structure and growth rates, Montreal, Toronto and 8 large CMAs, 1981-1996
Montreal Toronto 8 CMAs emp. share gr. rate emp. share gr. rate emp. share gr. rate Function (%) (%) (%) (%) (%) (%)
Culture & media 1981 3,3 4,1 3,1 1996 4,5 60,1 4,9 48,5 4,3 70,9 Distribution & marketing 1981 6,3 7,4 6,4
1996 7,2 35,8 8,0 35,0 6,9 36,3 Command & control 1981 7,7 9,8 8,1
1996 7,4 13,5 11,3 43,1 9,0 40,5 High technology 1981 4,5 4,9 4,0 1996 5,8 52,1 5,4 36,3 5,3 69,1 TOTAL: 1981 21,9 26,3 21,5 METRO FUNCTIONS 1996 24,9 35,0 29,6 40,0 25,5 48,9 High technology 1981 3,1 3,1 2,2 manufacturing 1996 2,9 10,9 2,1 -16,3 2,0 14,11 High technology 1981 1,4 1,8 1,8 services 1996 2,9 141,7 3,3 127,7 3,3 135,3
Finally, in terms of growth rates across the four major metropolitan functions (Table 2), Montreal’s growth was more rapid than that of Toronto, but less rapid than that of the eight-CMA group in culture & media and in high technology; in marketing & distribution its performance was not appreciably different from the two reference points. On the other hand, for both the total of the four functions and, in particular, the command & control function, Montreal was out-performed by both Toronto and the aggregate group (13.5% vs. 43.1% for Toronto and 40.5% for the group in the case of command & control).
11
Table 3 – High technology manufacturing employment in five large CMAs, 1996
Employment (absolute number) Montreal Toronto
Ottawa-Hull
Calgary Vancouver 5 CMAs
Business machines 1 455 7 155 2 170 7 155 2 070 20 005 Aircraft & parts 17 650 8 140 350 280 675 27 095 Telecommunications equipment 14 275 10 820 10 585 3 210 2 675 41 565 Pharmaceuticals 6 480 8 110 165 340 900 15 995 Scientific & prof. equipment 2 650 7 200 1 170 1 070 1 115 13 205 42 510 41 425 14 440 12 055 7 435 117 865
High technology manufacturing structure by CMA (CMA = 100%)
Montreal Toronto Ottawa-Hull
Calgary Vancouver
Business machines 3,4% 17,3% 15,0% 59,4% 27,8% Aircraft & parts 41,5% 19,6% 2,4% 2,3% 9,1% Telecommunications equipment 33,6% 26,1% 73,3% 26,6% 36,0%
Pharmaceuticals 15,2% 19,6% 1,1% 2,8% 12,1% Scientific & prof. equipment 6,2% 17,4% 8,1% 8,9% 15,0%
100,0% 100,0% 100,0% 100,0% 100,0%
Distribution of high technology manufacturing employment across CMAs (5 CMAs = 100%) Montreal Toronto
Ottawa-Hull
Calgary Vancouver 5 CMAs
Business machines 7,3% 35,8% 10,8% 35,8% 10,3% 100,0% Aircraft & parts 65,1% 30,0% 1,3% 1,0% 2,5% 100,0% Telecommunications equipment 34,3% 26,0% 25,5% 7,7% 6,4% 100,0% Pharmaceuticals 40,5% 50,7% 1,0% 2,1% 5,6% 100,0% Scientific & prof. equipment 20,1% 54,5% 8,9% 8,1% 8,4% 100,0%
In sum, our analysis of major metropolitan functions reinforces the notion that Montreal, in comparison with Canada’s other large CMAs is, above all, a manufacturing centre with a relative specialization in high technology activities, rather than a locus of strategic high-order services. In particular, Montreal’s role as a centre of command & control functions is both relatively weak and in decline.
Occupational analysis
Table 4 indicates the relative share and the growth rate of employment in six occupational categories in Montreal and Toronto and the eight-CMA group over the study period. With 14.7% of its employed workforce in managerial & administrative occupations in 1996, Montreal finds itself behind both Toronto (17.6%) and the eight-CMA group (16.2%). In fact, Montreal places fifth among the eight eight-CMAs (not shown); Toronto is in second place, behind Ottawa-Hull (18.5%). The gap between Montreal and Toronto is considerably narrower (8.8% vs. 9.0%) in terms of science & engineering occupations; Toronto and Montreal are in fourth and fifth place, respectively, behind Ottawa-Hull (13.8%). When these two occupational categories are considered together
12
(a group that we refer to as “high information content” occupations), Montreal (23.5%) descends to the sixth position among the eight CMAs, ahead of Edmonton and Winnipeg only; Toronto (26.6%) finds itself in third place behind Ottawa-Hull (32.2%) and Calgary (27.5%). Among the other occupational categories, the profiles of Montreal and Toronto are essentially similar, with the exception of education & health occupations, where Montreal displays a higher percentage than Toronto (14.4% vs. 12.0%). In terms of growth rates, the major difference between Montreal and Toronto is in the managerial & administrative category, where employment in Toronto has grown much more rapidly (120.0% vs. 95.8%). In sum, where both relative shares and growth rates are concerned, the principal gap between Montreal and Toronto involves the economically significant managerial & administrative category, where Montreal not only finds itself lagging behind Toronto but also continuing to lose ground. It is further interesting to note that when
private sector employment only is considered (i.e., total employment minus the
education, health & social services, and public administration sectors; this analysis is not shown), the gap between Toronto and Montreal remains. The effect of this modification, however, is to propel Toronto to the head of the eight CMAs with respect to the managerial & administrative occupations; Montreal remains in fifth position.
Table 4 – Occupational structure and growth rates: Montreal, Toronto and 8 large CMAs, 1981-1996
Montreal Toronto 8 CMAs emp. share gr. rate emp. share gr. rate emp. share gr. rate Occupation (%) (%) (%) (%) (%) (%)
Managerial & administrative 1981 8,9 10,0 9,5 1996 14,7 95,8 17,6 120,0 16,2 116,1 Science & engineering 1981 5,6 6,4 6,6
1996 8,8 85,6 9,0 76,0 9,3 77,6 SUB-TOTAL: HIGH 1981 14,5 16,4 16,1 INFORMATION CONTENT 1996 23,5 91,9 26,6 102,9 25,5 100,3 Education & health 1981 12,2 9,9 11,0
1996 14,4 40,7 12,0 52,0 13,0 48,3 Clerical & related 1981 22,2 24,4 23,2
1996 17,7 -5,4 17,3 -11,5 16,9 -8,2 Sales & Service 1981 21,8 21,2 22,3
1996 24,5 33,2 24,3 43,2 25,5 43,9 Blue collar 1981 29,3 28,2 27,4
1996 19,9 -19,2 19,8 -12,4 19,0 -12,4 ALL OCCUPATIONS 1981 100,0 100,0 100,0
13
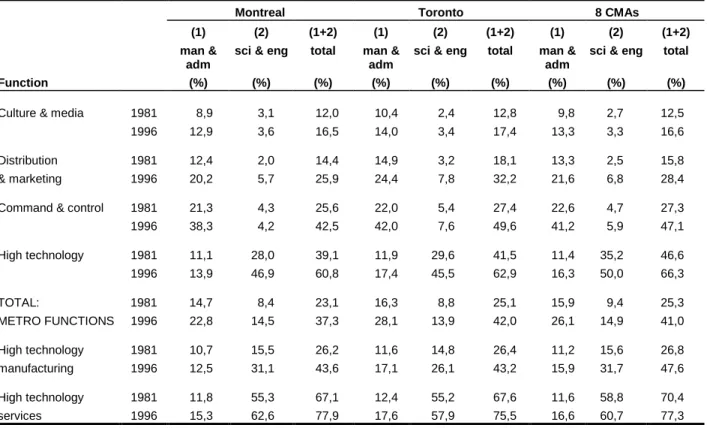
The occupational structure found within each of the four major metropolitan functions examined in the previous section also merits examination. By focusing on the high information content occupations within the major metropolitan functions, one is able to develop a better idea of the distribution of “strategic” employment. As indicated by Table 5 and by Figure 3, across all of the metropolitan functions, Montreal’s share of managerial & administrative employment is consistently lower than that of both Toronto and the eight-CMA group. The gap between Toronto and Montreal is widest in the case of the aggregated set of four functions, and less pronounced in the case of culture & media and high technology services. On the other hand, Montreal’s share of scientific & engineering employment surpasses that of Toronto in the high technology function (in aggregate, as well as in manufacturing and services individually), in culture & media, and in the total of the four functions (Figure 4). Note that Montreal’s share of scientific & engineering employment exceeds that of both Toronto and the eight-CMA group in the case of high technology services and culture & media. Finally, where the aggregated group of “high information content” occupations is concerned (Figure 5), Montreal is again generally characterized by employment shares that are lower than those for both Toronto and the eight-CMA group. There are two exceptions, however: the individual components of the high technology function; in high technology services Montreal’s employment share is the highest (77.9%); and in high technology manufacturing Montreal’s employment share (43.6%) merits a second position behind the eight-CMA group.
Table 5 – Occupational structure of metropolitan functions, Montreal, Toronto and 8 large CMAs, 1981-1996
Montreal Toronto 8 CMAs
(1) (2) (1+2) (1) (2) (1+2) (1) (2) (1+2) man &
adm
sci & eng total man & adm
sci & eng total man & adm
sci & eng total
Function (%) (%) (%) (%) (%) (%) (%) (%) (%)
Culture & media 1981 8,9 3,1 12,0 10,4 2,4 12,8 9,8 2,7 12,5
1996 12,9 3,6 16,5 14,0 3,4 17,4 13,3 3,3 16,6 Distribution 1981 12,4 2,0 14,4 14,9 3,2 18,1 13,3 2,5 15,8
& marketing 1996 20,2 5,7 25,9 24,4 7,8 32,2 21,6 6,8 28,4 Command & control 1981 21,3 4,3 25,6 22,0 5,4 27,4 22,6 4,7 27,3
1996 38,3 4,2 42,5 42,0 7,6 49,6 41,2 5,9 47,1 High technology 1981 11,1 28,0 39,1 11,9 29,6 41,5 11,4 35,2 46,6 1996 13,9 46,9 60,8 17,4 45,5 62,9 16,3 50,0 66,3 TOTAL: 1981 14,7 8,4 23,1 16,3 8,8 25,1 15,9 9,4 25,3 METRO FUNCTIONS 1996 22,8 14,5 37,3 28,1 13,9 42,0 26,1 14,9 41,0 High technology 1981 10,7 15,5 26,2 11,6 14,8 26,4 11,2 15,6 26,8 manufacturing 1996 12,5 31,1 43,6 17,1 26,1 43,2 15,9 31,7 47,6 High technology 1981 11,8 55,3 67,1 12,4 55,2 67,6 11,6 58,8 70,4 services 1996 15,3 62,6 77,9 17,6 57,9 75,5 16,6 60,7 77,3
14
Figure 3 – Percentage of managerial & administrative employment within metropolitan functions, 1996
0,0 5,0 10,0 15,0 20,0 25,0 30,0 35,0 40,0
Cult & med Dist & mktg Comm & ctrl Hi Tech TOT: 4 FNCT HT Mfg HT Ser (%)
Montreal Toronto 8 CMAs
Figure 4 – Percentage of scientific & engineering employment within metropolitan functions, 1996
0,0 10,0 20,0 30,0 40,0 50,0 60,0
Cult & med Dist & mktg Comm & ctrl Hi Tech TOT: 4 FNCT HT Mfg HT Ser (%)
15
Figure 5 – Percentage of high information content (man. & admin. + sci. & eng.) employment within metropolitan functions, 1996
0,0 10,0 20,0 30,0 40,0 50,0 60,0 70,0 8
Cult & med Dist & mktg Comm & ctrl Hi Tech TOT: 4 FNCT HT Mfg HT Ser (%)
Montreal Toronto 8 CMAs
D
ISCUSSION AND CONCLUSIONIn this section, we first offer some comments concerning the results of our analyses using the three indicators of economic structure of Montreal, and then discuss the implications of these results.
Sectoral structure
The sectoral restructuring of Montreal appears to be well under way and to be headed in the desired direction. In general, as in the case of Toronto, employment is growing in the “information” or “knowledge-based” economy (e.g., business services). On the other hand, employment decline is generally occurring among “traditional” or “low-tech” activities, especially in the manufacturing sector. These changes are consistent with those occurring in the majority of large metropolitan areas in developed countries. In some ways, the sectoral evolution of Montreal even appears to be more positive than that of Toronto; this is especially the case in terms of job loss within the manufacturing sector, where Toronto (unlike Montreal) has been losing ground in certain high technology industries.
16
Our analysis leads us to conclude that Montreal’s oft-cited “employment problem” is not one of sectoral structure but, rather, of volume. If Montreal continues to experience unemployment rates that are considerably higher than that of Canada’s other large metropolitan areas, it is not due to an out-moded sectoral structure nor due to an undesirable form of restructuring. In other words, the problem does not appear to be sector-specific. Rather, the problem is of a much more general nature: an insufficient number of jobs are being created across all sectors. The roots of this difficulty appear to have little to do with sectoral structure.
Functional structure
Montreal’s weakness in command & control functions is particularly evident; its share of employment in this function merits only the fifth position among Canada’s large CMAs in 1996. Over the study period, Montreal’s share of total employment in this function has declined slightly to 7.4%, while Toronto’s has increased to 11.3%. Thus, the command & control gap between Montreal and Toronto is growing. Further, with the exception of Edmonton, Montreal had the slowest employment growth rate for this function for the period 1981-1996 (13.5%, compared to 61.2% for Vancouver and 43.1% for Toronto). The image of Montreal as a secondary command & control centre within the Canadian economy is reinforced by our occupational analysis (see below), where Montreal’s level of managerial & administrative employment is observed to be significantly below that of Toronto. The position of Montreal with respect to the
distribution & marketing function is more positive; on the basis of a growth rate that is
comparable to that of Toronto and to the eight-CMA group, in 1996 Montreal finds itself tied for second place with Vancouver (behind Toronto) in terms of share of total employment in this function. The relatively good performance of Montreal here is undoubtedly related to the growing differentiation of francophone and anglophone market areas.
Montreal also performs reasonably well in the culture & media function. On the basis of a growth rate that is situated midway between that of Toronto and the eight-CMA group, Montreal is in second position (after Toronto) in terms of share of total employment in this function. Interestingly, Montreal’s share of scientific & engineering occupations within this function is the highest among the eight CMAs, suggesting that Montreal’s activities are fairly sophisticated. The future of Montreal with respect this function seems to be fairly well assured, if only because of its culturally distinct hinterland. Montreal is also fairly well-positioned in terms of the high technology function, particularly where manufacturing activities are concerned. Montreal’s share of employment merits a third place (after Calgary and Ottawa-Hull) in the combined set of high technology activities (manufacturing and services) and a first place finish (tied with
17
Ottawa-Hull) in high technology manufacturing. On the other hand, Montreal only finishes in fifth position with respect to high technology services.
Occupational structure
An analysis of occupational structure reveals that, as in the case of other large Canadian CMAs, Montreal and Toronto have both added a substantial number of high information content jobs. In relative terms, however, Montreal lags behind Toronto and three other CMAs. In particular, as noted above, the gap between Montreal and Toronto is both large and growing where the share of managerial & administrative occupations in total employment is concerned. Among all other occupational groups (including scientific & engineering occupations), however, the structures of Montreal and Toronto are relatively similar.
It appears that a division of labour has evolved between Montreal and Toronto, with the former specialising in certain types of scientific & engineering activities and the latter specialising in managerial and decision-making tasks. This division of labour is particularly evident within the major metropolitan functions. For example, the percentage of scientific & engineering personnel within Montreal’s high technology manufacturing function is significantly above that of Toronto; on the other hand, Toronto is significantly ahead of Montreal in terms of the proportion of managerial & administrative employees within this function.
Conclusion
We now return to our point of departure: in relation to Toronto, and in the broader context of the eight largest Canadian CMAs, is Montreal distinct? In our view, the answer is no. It is clear that Montreal is somewhat different from Toronto according to certain indicators (e.g., relatively weaker in terms of its share of managerial & administrative occupations and command & control functions; relatively stronger in terms of manufacturing and, in particular, high technology manufacturing). In general, however, Montreal and Toronto are very similar where both structure and performance are concerned. Indeed, in terms of their share of employment in individual activities, the two largest CMAs often find themselves forced into the middle of the eight-CMA group by smaller “specialist” metropolitan regions such as Ottawa-Hull (managerial & administrative and scientific & engineering occupations) or Calgary (business services). Further, as we have seen, Montreal seems to be moving in exactly the same direction as Toronto and the other CMAs, with respect to sectoral and occupational structure.
If the roots of Montreal’s now well-known economic difficulties (unemployment and resulting poverty head the list) are not to be found in sectoral or occupational structure, where does the problem lie? Here, the broader issue of a “distinct society”
18
may well come into play. Montreal seems to perform well in those activities (such as high technology manufacturing) that are not directly related to its role as a central place for a commercial hinterland, but less well in activities that are related to this role (e.g., financial services, business services). The limits to employment growth in classic metropolitan functions such as command & control and distribution & marketing are in large measure fixed by the size of a metropolitan area’s hinterland. While New York or Toronto can count on much larger national hinterlands to support the expansion of various types of activities, Montreal’s principal economic hinterland is now restricted to the province of Quebec. In order for Montreal’s employment to grow in such strategic activities, firms must go beyond the natural hinterland and export to external (non-Quebec) markets. Services are much more difficult to export than are goods, however, since cultural and linguistic barriers enter into play. It is perhaps for this reason that Montreal has had a relatively large amount of success in high technology manufacturing, where the cultural aspect is less relevant. The problem for Montreal, however, is that the high technology manufacturing sector alone (with only 2.9% of total employment in 1996) cannot in the short or medium term create enough jobs to solve the unemployment problem.
We have elsewhere examined the phenomenon of Montreal’s “amazing disappearing hinterland”, referring to it as “the decline of the Montreal empire” (Coffey and Polèse 1993). In large measure, Montreal’s loss of its historical national hinterland and subsequent decline to the status of Canada’s second-largest metropolitan area is the direct result of the rise of complex social and economic forces (often referred to as “the quiet revolution”) that all combine, in the eyes of many of its residents, to create a “distinct society” in Quebec. In addition to cultural issues and an official language law (which, inter alia, in principle requires firms with more than 50 employees to work in the French language), Quebec is also distinct in terms of having an administrative structure that parallels that of the federal government (e.g., its own Ministry of Revenue to collect its own taxes, and its own Ministry of Foreign Affairs). This parallel administrative structure is expensive to maintain, and the level of taxation of both individuals and firms is consequently higher than in most other provinces. Add to this situation the uncertainty created by constitutional issues – above all the prospect of Quebec’s separation from the Canadian confederation -- and the result is a business environment that is somewhat less attractive than it might otherwise be. Indeed, given its location in the Province of Quebec, we can only marvel that the Montreal economy has done as well as it has; this is perhaps the best proof of its underlying strength.
In sum, we seem to have a non-distinct metropolis in a possibly distinct (or, at least, slightly unusual) society.
19
R
EFERENCESChung, J. 1974. “La nature du déclin économique de la région de Montréal”,
L’Actualité économique, 50: 410-435.
Coffey, W. and M. Polèse. 1989. “The Role of Cultural Barriers in the Location of Producer Services: Some Reflections on the Toronto-Montreal Rivalry and the Limits to Urban Polarization”, Canadian Journal of Regional Science, 14: 433-446.
Coffey, W. and M. Polèse. 1993. “Le déclin de l’empire montréalais: regard sur l’économie d’une métropole en mutation”, Recherches sociographiques, 34: 417-437.
Côté, M. 1991. Un cadre d’analyse pour le Comité ministériel permanent de développement du Grand Montréal. Montréal: Secor.
Higgins, B. 1986. The Rise and Fall of Montreal? Moncton: Institut canadien pour le développement régional.
Lapointe, A. and S. Fortin. 1998. L’économie du savoir marquerait-elle la fin du
déclin pour Montréal? Montréal: Centre d’études sur les nouvelles technologies et les
organisations, École des Hautes Études Commerciales.
Polèse, M. 1990. “La thèse du déclin économique de Montréal, revue et corrigée”, L’Actualité économique, 66: 133-146.