L'INFLUENCE DE LA VARIABILITÉ CLIMATIQUE RÉCENTE ET FUTURE SUR L'ACTIVITÉ DES FEUX
DANS LA RÉGION DE WASWANIPI (QUÉBEC) ET SES IMPLICATIONS POUR L'AMÉNAGEMENT
FORESTIER DURABLE
THÈSE PRÉSENTÉE
COMME EXIGENCE PARTIELLE DU DOCTORAT
EN SCIENCES DE L'ENVIRONNEMENT
PAR
HÉLOïsE LE GOFF
Avertissement
La diffusion de cette thèse se fait dans le respect des droits de son auteur, qui a signé le formulaire Autorisation de reproduire et de diffuser un travail de recherche de cycles supérieurs (SDU-522 - Rév.ü1-2ÜÜG). Cette autorisation stipule que «conformément à l'article 11 du Règlement no 8 des études de cycles supérieurs, [l'auteur] concède à
l'Université du Québec à Montréal une licence non exclusive d'utilisation et de publication de la totalité ou d'une partie importante de [son] travail de recherche pour des fins pédagogiques et non commerciales. Plus précisément, [l'auteur] autorise l'Université du Québec à Montréal à reproduire, diffuser, prêter, distribuer ou vendre des copies de [son] travail de recherche à des fins non commerciales sur quelque support que ce soit, y compris l'Internet. Cette licence et cette autorisation n'entraînent pas une renonciation de [la] part [de l'auteur]
à
[ses] droits moraux ni à [ses] droits de propriété intellectuelle. Sauf entente contraire, [l'auteur] conserve la liberté de diffuser et de commercialiser ou non ce travail dont [il] possède un exemplaire.»Je remercie Mike Flannigan et Yves Bergeron pour leur infinie patience et leur soutien continu tout au long de ce projet. Je remercie le Réseau de Gestion Durable des Forêts qui a contribué en grande majorité au financement de ces recherches.
Je remercie la myriade de personnes, croisées brièvement ou plus longuement, et qui ont eu le bon mot au bon moment: Marc Parisien, Luc Sirois, Patrick Béron, Adam Ali, Domique Berteaux, Venceslas Goudiaby, Jean-Claude Ruel, Carole Guérin, Jacques Tardif, Louis de Grandpré, France Conciatori, Sophie Gachet, Marilou Beaudet, Sylvie Gauthier... et tous ceux que qui m'ont aidée sans que je ne l'aie vraiment réalisé.
Merci à Danielle Charron et à Luc Lauzon pour tous les tracas administratifs et logistiques résolus avec bienveillance. Merci à Daniel Lesieur pour ses promptes réponses à mes innombrables questions. Merci à Ouranos pour les séminaires Impacts et Adaptation, auxquels j'ai assisté et présenté mes travaux de synthèse, mais aussi pour avoir fourni les données du Modèle Régional Canadien du Climat (un merci particulier à Daniel Houle et à Travis Logan). Fréquenter ce haut lieu d'innovation et de recherche a été particulièrement stimulant pour mon cheminement de doctorat. Je remercie Kim Logan, Alan Cantin et Lynn Gowan pour leur précieuse aide lors de l'analyse des données du Modèle Régional Canadien du Climat et des calculs de l'Indice Forêt-Météo. Je remercie également Rémi Saint Amant pour avoir fourni les données météorologiques historiques.
Je remercie les nombreuses personnes qui m'ont aidée sur le terrain et en laboratoire pour la collecte et l'analyse des données dendrochronologiques: Daniel Lesieur, Benoît St-Vincent, Stéphane Valois, Steve McLaughlin et David Beauregard.
J'adresse un remerciement tout spécial à Sylvie Gauthier, qui m'a généreusement accueillie au Centre de Foresterie des Laurentides depuis 2005, ainsi qu'à ceux qui partageaient mon quotidien dans cet environnement de travail stimulant: Louis De Grandpré, Martin Girardin, Jacques Morissette, Dominique Boucher et Marie Andrée Vaillancourt.
Je remercie mes compagnons de route Martin Girardin, Karelle Jayen, Dominic Cyr et Catherine Boudreault. Nous avons souvent échangé sur les difficultés et les victoires qui nous étaient communes, vous êtes donc particulièrement bien placés pour saisir tout ce que cet accomplissement signifie pour moi.
Merci à ma famille outre-mer, vous avez su rester proche de moi et me soutenir même si cette aventure pouvait vous paraître abstraite et éloignée de votre quotidien.
De Winnipeg à Montréal, pour terminer notre route à Québec, avec Maël et deux chats, je te remercie Martin pour ton soutien et ton amour aux cours de ces longues années de thèse.
scientifiques. Pour chaque article, j'étais la personne principalement responsable pour l'élaboration du plan expérimental, la récolte et la compilation de données, les analyses statistiques et la rédaction.
Le premier article s'intitule «Historical fire regime shifts related to climate teleconnections in the Waswanipi area, central Quebec, Canada ». Mes co-auteurs sont Mike Flannigan, Yves Bergeron et Martin Girardin. Cet article a été publié en 2007 dans International Journal of Wildland Fire (16: 607-618).
Le deuxième article s'intitule «Dendroclimatic inference of wildfire activity in Quebec over the 20th century and implications for natural disturbance-based forest
management at the northern limit of the commercial forest ». Mes co-auteurs sont Martin Girardin, Mike Flannigan et Yves Bergeron. Cet article a été publié en 2008 dans International Journal ofWildland Fire (17= 348-362).
Le troisième article s'intitule « Potential changes in monthly fire risk in the eastern Canadian boreal forest under future climate change ». Mes co-auteurs sont Mike Flannigan et Yves Bergeron. Cet article a été accepté pour publication au Journal Canadien de la Recherche Forestière en juillet 2009.
Le quatrième chapitre s'intitule « Exploring links between adaptation to climate change and sustainable forest management: Integrating the fire risk into forest management planning ». Mes co-auteurs sont Yves Bergeron et Mike Flannigan. Cet article sera soumis pour publication à Forest Ecology and Management.
AVANT-PROPOS v
LISTES DES FIGURES xiii
LISTE DES TABLEAUX xv
LISTE DES APPENDICES xvii
RÉSUMÉ xix
INTRODUCTION GÉNÉRALE 1
CHAPITRE 1 HISTORICAL FlRE REGIME SCHIFfS RELATED TO CLIMATE TELECONNECTIONS IN THE W ASWANIPI AREA, CENTRAL
QUEBEC, CANADA 7 1.1 Résumé 7 1.2 Abstract 7 1.3 Introduction 8 1.4 Methods 10 1.4.1 Study area 10 1.4.2 Field sampling 11 1.4.3 Dendrochronological analysis 12 1.4.4 Fire historlJ 12 1.4.5 Clïmate indices 14
1.4.6 Climate influence on the decadalfire activity 16
1.4.7 Climate influence on the occurrence offire years 17
1.5 Results 18
1.5.1 The Waswanipifire history 18
1.5.2 Clïmate influence on recentfire activity 19
1.6 Discussion 21
1.6.1 The Waswanipifire history 21
1.6.2 Climate influence on recentfire activity 22
1.7 Acknowledgements 25
1.8 References 25
CHAPITRE II DENDROCLIMATIC INFERENCE OF WILDFIRE
ACTIVITY IN QUÉBEC OVER THE 20TH CENTURY AND IMPLICATIONS FOR NATURAL DISTURBANCE-BASED FOREST MANAGEMENT AT
THE NORTHERN LIMIT OF THE COMMERCIAL FOREST 39
2.1 Résumé 39
2.2 Abstract 39
2.3 Introduction 40
2.4 Study area 43
2.5 Data and methods 44
2.5.1 Fire data 44
2.5.2 Fire-climate relationships 45
2.5.3 Tree-ring analyses 45
2.6 Results 48
2.6.1 Description ofthe annual area burned series 48
2.6.2 Atmospheric controls of the annual area burned in Québec 49
2.6.3 Tree radial growth and climate relationships 49
2.6.4 Tree gl'owth andfire activity 50
2.7 Discussion 52
2.7.1 The Fire Triangle Areafire regime 52
2.7.2 Tree-ring analyses 53
2.7.3 Thefire-climate relationship in the Fire Triangle Area 55
2.7.4 Fire andforest management in the Fire Triangle Area 56
2.8 Acknowledgements 57
2·9 References 57
CHAPITRE III POTENTIAL CHANGES IN MONTHLY FIRE RISK IN THE EASTERN CANADIAN BOREAL FOREST UNDER FUTURE
CLIMATE CHANGE 75
3·1 Abstract 75
3.2 Résumé 75
3·3 Introduction 76
3-4 Data and methods 77
3·4·1 Study area 77
3.4.2 Fire data 78
3.4.3 Historical meteorological data 79
3.4.5 Historicalfire-weather relation: monthly step 81
3.4.6 CRCM data 82
3.4.7 Futurefire activity and risk 83
3.5 Results 84
3.5.1 Historicalfire-climate relation 84
3.5.2 Clïmate change andfuturefire conditions 84
3-5.3 Futurefire activity in the Waswanipi area 84
3.6 Discussion 85
3.6.1 Change in thefire season andfire management in Quebec 85
3.6.2 Futurefire activity under climate change 86
3.6.3 Conclusions 87
3.7 Acknowledgements 88
3.8 References 88
CHAPITRE IV EXPLORING LINKS BE1WEEN ADAPTATION TO CLIMATE CHANGE AND SUSTAINABLE FOREST MANAGEMENT: INTEGRATING THE FIRE RISK INTO FOREST MANAGEMENT
PLANNING 104
4.1 Résumé 104
4.2 Abstract 104
4.3 Introduction 105
4.4 Forest tire as a major vulnerability of foret management to climate
change 106
4.5 Planning considerations 109
4.5.2 Uncertainties 109 4.5.3 Risk management 110 4.5.4 Participative management 110 4.6 Planning approaches 112 4.6.1 Portfolio approach 112 4.6.2 Adaptive management 113
4.7 Management strategies facilitating the integration of the fire risk
into forest management planning 114
4.7.1 Integrating climate indicators ofthe regionalfire risk 114
4.7.2 Distributing thefire risk across theforest management unit_ _ 117
4.8 Conclusion 120
4.9 Acknowledgments 121
4.10 References 121
CONCLUSION GÉNÉRALE 131
RÉFÉRENCES CITÉES DANS L'INTRODUCTION ET lA CONCLUSION
Figure 1.2 Forest age distribution per decade for the study area 35 Figure 1.3 Time-since-tire distributions for the study area 36
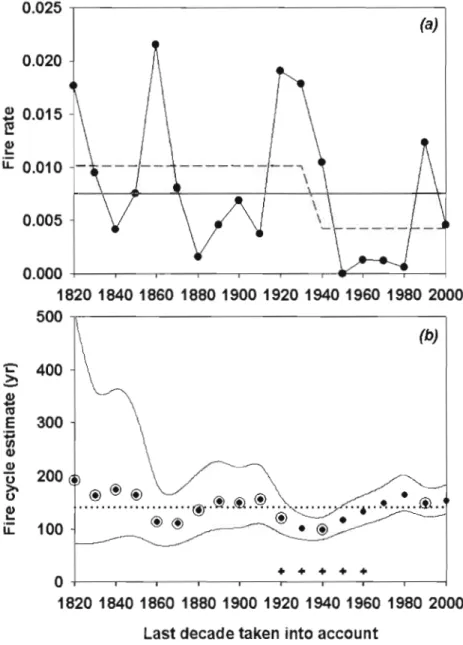
Figure 1.4 1820-2000 variations in the decadal burn rate associated with the
survival analysis ofthe time-since-tire data 37
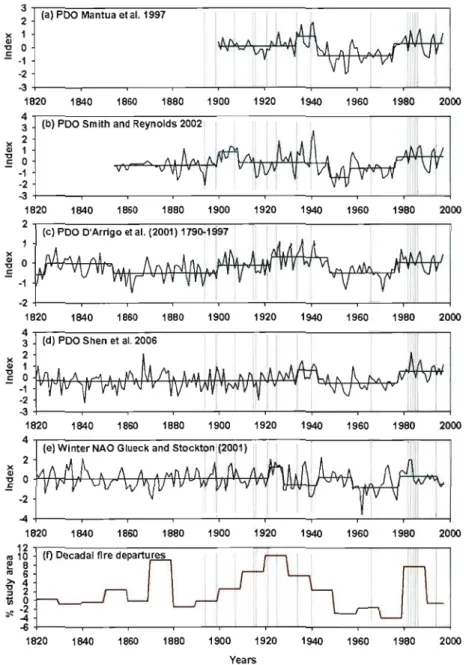
Figure 1.5 Climate indices and decadal tire departures 38
Figure 2.1 Location of the study area and map of the dendrochronological
sampling sites 66
Figure 2.2 1972-2002 annual area burned in the Fire Triangle area, in the province of Québec, and in the intensive and extensive tire management zones 67
Figure 2.3 1972-1999 monthly distribution of the area burned across the tire
season for the four spatial domains investigated 68
Figure 2.4 Correlation maps of the instrumental annual area burned and June 500 hPa geopotential heights for the four domains investigated 69
Figure 2.5 Residual chronology eigenvectors along the tirst three axes of the
principal component analysis 70
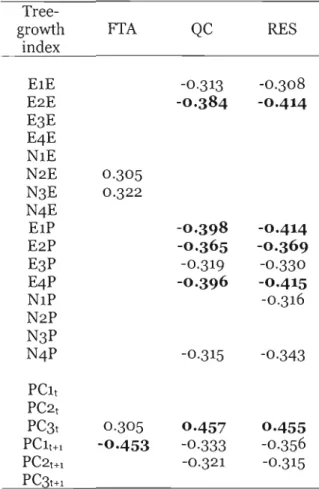
Figure 2.6 Correlations and response functions of the tirst three principal components of the residual chronologies with monthly temperature and
precipitation 71
Figure 2.7 Tree-ring estimates of the annual area burned at different spatial
domains for the 1904-2001 period 72
Figure 2.8 Correlation maps between annual area burned tree-ring estimates with June 500 hPa geoptential heights for the Fire Triangle Area, and for the restricted
tire management zone 73
Figure 2.9 Correlation maps for the tree-ring annual area burned estimates 74
Figure 3.2 Structure ofthe Fire-Weather Index system 99
Figure 3.31961-2100 June mean and maximal values for temperature,
precipitation, relative humidity, and wind speed 100
Figure 3.41961-2100 June mean and maximal values for the Fire-Weather Index
components 101
Figure 3.5 Annual area burned and annual number offires for 1961-2100 in the
Waswanipi area 102
Figure 3.6 Anticipated changes in monthly fire risk under climate change in the
western in the Waswanipi area 103
Figure 4.1 Conceptual framework of adaptation to climate change 128
Figure 4.2 Pacifie Decadal Oscillation, North-Atlantic Oscillation, and decadal fire
departures in the Waswanipi area 129
Figure 4.3 Correlation maps of the instrumental annual area burned in the
Table 1.2 1880-1990 correlation analyses between decadal fire departures and
decadal values of different climate indices 32
Table 1.3 T-values for different climate indices between reported fire years and
non-fire years between 1899 and 1996 33
Table 2.1 Pearson correlations between tree-ring width residual chronologies and
annual area burned records for the 1972-2002 period 63
Table 2.2 Forward step,-vise regressions of the annual area burned for the 1972
2001 period 64
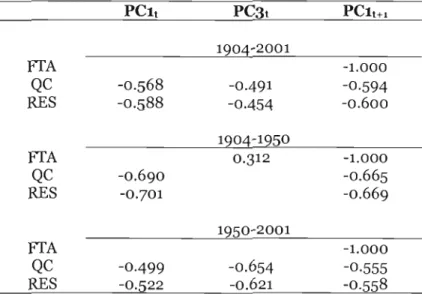
Table 2.3 Pearson correlations between estimates ofthe annual area burned for
the 1904-2001 period 65
Table 3.1 Description of the candidate explanatory variables for the regression
analyses 92
Table 3.2 Multiple linear regression models for annual area burned and number of
fires for the 1972-2002 93
Table 3.3 Split sample calibration-verification results for the linear regression
models of annual area burned and number of fires 94
Table 3.4 Logistic stepwise regressions of monthly fire probability for the western
black spruce-feather moss subdomain and for the Waswanipi area for the 1973
2002 95
Table 3.5 Verification results for logistic regression models of the monthly fire
probability for the black spruce-feather moss domain and for the Waswanipi area ... 96 Table 3.6 Rates of change for the different fire variables in the Waswanipi area
durable dans un contexte de changements climatiques et dans une région soumise à une fréquence de feu élevée lorsqu'on la compare à celle d'autres régions de la forêt commerciale du Québec.
Le premier chapitre examine la relation entre la distribution des classes d'âge, qui reflète l'activité régionale des feux, et les variations climatiques à grande échelle (circulation atmosphérique et océanique). Les variations interdécennales de l'activité des incendies forestiers de la région de Waswanipi, située dans le centre du Québec, ont été reconstituées pour la période 1920-2000 à l'aide d'analyses dendrochronologiques. Nous avons estimé le cycle de feu autour de 153 ans, avec un allongement de 99 ans avant 1940 à 282 ans après 1940. Cette reconstitution a été analysée à l'aide de différents indices climatiques tels que l'Oscillation Pacifique Décennale et l'Oscillations Nord-Atlantique, sur la période 1880-2000. Les corrélations entre la variabilité décennale des feux et les indices climatiques indiquent une influence positive de l'Oscillation Pacifique Décennale. Cette relation a été validée à l'échelle interannuelle pour les années de grands feux entre 1899 et 1996.
Le principal objectif du deuxième chapitre est de déterminer si un patron climatique particulier contrôle l'activité régionale des feux et se distingue de ceux contrôlant l'activité des feux dans d'autres parties de la forêt boréale québécoise. La carte de corrélation entre des hauteurs géopotentielles et l'aire brûlée annuellement dans la région d'étude a été produite et comparée avec celles produites pour l'aire brulée annuellement au Québec, et dans les zones de protection intensive (sud du Québec) et restreinte (nord du Québec). Ensuite, des analyses dendroclimatiques ont été réalisées afin d'obtenir des estimées de l'aire brûlée dans les différents territoires examinés de 1904 à 2001 afin d'évaluer la stabilité temporelle de l'influence climatique sur l'activité des feux. Le patron climatique qui contrôle l'activité des feux dans la région d'étude est intermédiaire entre ceux responsables de l'activité des feux dans les zones de protection intensive et restreinte. Ce patron serait relativement stable au moins depuis 1948.
Le troisième chapitre examine les taux de changement futurs de l'activité des feux sous l'influence des changements climatiques dans la région de Waswanipi, au centre du Québec. Tout d'abord, nous avons utilisé des régressions linéaires pour modéliser la relation historique (1972-2002) entre les conditions météorologiques et l'activité des feux. Ensuite, nous avons calculé les composantes du système de l'Indice Forêt-Météo à partir des simulations quotidiennes des conditions météorologiques du Modèle Régional Canadien du Climat (1961-2100). Nous avons testé les tendances linéaires de l'activité des feux sur la période 1961-2100, et calculé
les taux de changement entre les périodes 1975-2005, 2030-2060, et 2070-2100. Nos résultats suggèrent que le risque de feu du mois d'août pourrait doubler d'ici 2100, alors que celui du mois de mai pourrait diminuer. Ainsi, le pic saisonnier de l'activité des feux pourrait se réaliser et se prolonger plus tard dans la saison. Bien que nos résultats suggèrent une faible augmentation à long terme de l'activité des feux, la variabilité interannuelle qui y est associée reste un défi bien plus grand pour le développement d'un aménagement forestier durable.
Traditionnellement au Québec, le risque de feu est géré a posteriori en foresterie: quand un feu survient dans un territoire aménagé, une partie des pertes encourues est atténuée par des coupes de récupération. Dans le quatrième chapitre, nous explorons des approches davantage proactives pour inclure les risques et les incertitudes à la planification forestière. Nous présentons d'abord les concepts communs à l'adaptation aux changements climatiques et à l'aménagement forestier durable. Ensuite nous présentons différents indicateurs climatiques du risque de feu régional qui pourraient contribuer à mieux prévoir et intégrer le risque de feu dans la planification forestière stratégique et tactique. Enfin, nous discutons de différentes stratégies d'aménagement forestier qui permettent d'intégrer plus facilement le risque de feu à la planification forestière. Bien que nous ayons déjà de plusieurs outils pour intégrer les risques et les incertitudes dans la planification forestière, d'importants changements dans la perception de ces risques et incertitudes sont nécessaires pour les mettre en place.
En conclusion, il est techniquement possible de développer un aménagement forestier durable qui tienne mieux compte du risque de feu prévalant dans la région de Waswanipi. Cependant notre capacité technique et scientifique ne suffit pas à garantir qu'un tel aménagement sera effectivement réalisé puisque sa mise en place nécessiterait une véritable volonté politique et de profonds changements dans la perception des risques et incertitudes en aménagement forestier.
Mots-clés: feux de forêts, changements climatiques, aménagement forestier écosystémique, adaptation aux changements climatiques, dendroclimatologie, circulation atmosphérique, circulation océanique, indice forêt-météo, risque de feu.
écosystèmes forestiers, sur leur dynamique et sur nos systèmes d'aménagement forestier. Les impacts des changements climatiques sur les ecosystèmes forestiers peuvent être regroupés en deux catégories: les impacts directs et les impacts indirects. Les impacts directs sont les effets des changements de température, de précipitation et d'autres paramètres climatiques sur la physiologie et l'écologie des organismes forestiers (e.g., croissance, reproduction, répartition, phénologie). À ces impacts directs se superposent des impacts indirects qui se manifestent par l'altération des régimes de perturbations naturelles telles que les feux, les épidémies d'insectes et les maladies. Les variations et les changements climatiques passés ont largement contribué aux variations passées de l'activité des feux dans diverses régions boréales (e.g. Girardin et al. sous presse, Marion et al. 2008).
De façon générale, l'activité des feux dépend principalement des conditions climatiques et météorologiques, de la végétation (combustible), de la topographie (relief et disposition du réseau hydrographique) et des activités humaines qui contribuent à l'allumage et à la suppression des feux. Cependant, en forêt boréale, les paramètres météorologiques et climatiques semblent expliquer une plus grande part de la variabilité de l'activité des feux que les autres paramètres (Flannigan et Harrington 1988, Bessie et Johnson 1995, Lefort et al. 2003). Ainsi, les feux représentent des catalyseurs des effets des changements climatiques sur les écosystèmes forestiers et sur nos systèmes d'aménagement forestier (Weber et Flannigan 1997). Dans le cadre de cette thèse, les feux sont considérés comme une vulnérabilité majeure de l'aménagement forestier face aux changements climatiques puisque nous aménageons des forêts essentiellement boréales et que le feu y joue un rôle primordial (Le Goff et al. 2005).
Dans le contexte actuel d'une planification forestière basée sur le principe du rendement soutenu, les feux représentent une incertitude majeure et un risque de perte de volume de bois pour l'industrie forestière. Le feu représente une incertitude car il est difficile de prévoir où et quand un feu va survenir. Le feu représente également un risque de perte de volume de bois car il peut affecter des peuplements prévus plus tard pour la récolte, et la planification forestière stratégique et opérationnelle s'en trouve alors modifiée. Lorsqu'un feu survient sur un territoire aménagé, il fait d'abord l'objet d'efforts de suppression par l'organisme en charge de la gestion des feux de la province (la Société de Protection des Forêt contre le Feu, la SOPFEU, au Québec), puis les superficies brûlées peuvent faire l'objet de plans spéciaux de récupération des bois brûlés. Ces deux approches comportent des limites qui démontrent à quel point notre système d'aménagement forestier est mal adapté aux incendies. La suppression des feux coûte environ 500 millions de dollars en moyenne chaque année. L'étude de MacAlpine et Hirsh (1999) suggère que même si l'on disposait de moyens financiers illimités, nous ne pourrions pas supprimer tous les feux et que 3 à 4 % de feux échapperaient aux moyens de contrôle. Ces feux brûleraient de grandes superficies car ils seraient dus à des conditions météorologiques extrêmes de sécheresse et de vent. Par ailleurs, lorsque de nombreux feux sont déclenchés simultanément les agences de gestion du feu peuvent faire face à des situations de débordement qui nécessitent de sélectionner certains feux sur lesquels intervenir, alors que d'autres brûlent librement (Lemaire 2002). Notre système de suppression des feux s'est mis en place ces 50 dernières années (Blanchet 2003), alors que l'activité des feux au Canada et au Québec était relativement faible lorsqu'on examine les 200 dernières années. Depuis les années 1970, on observe une augmentation de l'aire brûlée annuellement au Canada (Skinner et al. 1999, 2002, Gillett et al. 2004, Podur et al. 2002), et les agences de suppression des feux font de plus en plus souvent face à des situations de débordement. L'exclusion totale des incendies en forêt aménagée semble impossible économiquement. De plus, elle n'est pas souhaitable écologiquement puisque les feux jouent un rôle écologique fondamental dans la dynamique de la forêt boréale, et que ce rôle est de plus en plus reconnu (Hirsh et Fuglem 2006). Les coupes de récupération quant à elles présentent plusieurs limites: les surfaces brûlées ne sont
pas toujours accessibles et les peuplements brûlés ne sont pas toujours composés de tiges de diamètre commercial. Elles sont pratiquées selon les mêmes normes que celles en vigueur pour la récolte des peuplements non brûlés, ce qui suscite de nombreuses questions quant à leurs impacts sur les écosystèmes forestiers (Nappi
et al. 2004, Lindenmayer et al. 2004, Schmiegelow et al. 2006, Donato et al. 2006) et à leur rentabilité pour les industriels (Patry 2002).
Au Québec, plusieurs études documentent la variabilité spatiale de l'activité des feux, et suggèrent qu'un territoire situé à l'ouest du lac Mistassini serait soumis à une fréquence de feu particulièrement élevée lorsqu'on la compare à d'autres territoires aménagés au Québec (Gauthier et al. 2001, MRNFQ 2000, Lefort et al. 2004). Ainsi, ce territoire, que l'on appellera la région de Waswanipi, est particulièrement indiqué pour étudier les interférences possibles entre l'aménagement forestier et le régime naturel des feux. Parmi les hypothèses explicatives de ce régime de feu, cette thèse explore l'hypothèse climatique en deux volets: i) ce régime de feu particulier est-il lié à un signal climatique particulier? Et ii) les changements climatiques risquent-il de mener à une augmentation de la fréquence de feu déjà élevée sur ce territoire?
Cette thèse s'intéresse à l'influence des variations et des changements climatiques sur l'activité récente (les 200 dernières années) et future (les 100 prochaines années) des feux dans la région de Waswanipi, située dans le centre du Québec. L'objectif principal est de vérifier s'il est possible de développer un aménagement forestier durable dans cette région, compte-tenu du régime de feu particulièrement sévère qui y prévaudrait. Pour aborder cette problématique, j'ai analysé la relation feux-climat passée dans ma region d'étude et je me suis appuiyée sur l'hypothèse que les feux vont répondre aux changements climatiques futures de la même façon qu'ils ont répondu aux variations climatiques passées afin d'anticiper la réponse possible du regime de feu regional aux conditions climatiques futures anticipées. Cette hypothèse determine l'interprétation de mes résultats et les limites dans lesquelles ils peuvent être interprétés puisqu'il est possible que les conditions climatiques futures conduisent à des dynamiques différentes qu'il n'est pas possible
d'envisager à lartir de l'analyse des conditions passées. J'ai décomposé la question générale de la these en quatre questions spécifiques auxquelles répondent les quatre chapitres:
1. Le régime de feu est-il plus sévère dans la région de Waswanipi qu'ailleurs dans la forêt boréale commerciale du Québec et est-il en place depuis longtemps ou bien récemment?
2. Ce régime de feu est-il contrôlé par un patron climatique particulier? 3. Comment ce régime de feu va-t-il évoluer sous l'influence des changements
climatiques futurs?
4. Comment mieux intégrer le risque de feu dans notre façon d'aménager les forêts de la région de Waswanipi?
Dans le premier chapitre, j'ai reconstitué la distribution des classes d'âge à l'aide d'analyses de photos aériennes, des données de feu provinciales et d'échantillons prélevés sur le terrain. J'ai également calculé le cycle de feu pour différentes périodes pour vérifier si les variations temporelles de l'activité des feux observées dans la région de Waswanipi concordaient avec celles observées dans d'autres régions forestières au Québec. Plusieurs études récentes suggèrent que la variabilité interdécennale de l'activité des feux dans différentes régions de la forêt boréale est influencée par les variations climatiques à grande échelle. J'ai donc calculé les corrélations entre la distribution des classes d'âges, qui reflète l'activité régionale des feux, et différents indices décennaux de circulation atmosphérique et océanique. Enfin, j'ai vérifié si cette corrélation pouvait également se traduire par une influence de la variabilité climatique interannuelle de certains de ces indices sur l'occurrence d'années de grands feux dans la région.
Dans le second chapitre, j'ai développé une reconstitution dendroclimatique de l'activité des feux pour différents territoires, dont le Triangle de Feu (comprenant la partie nord de la région de Waswanipi) à l'aide de huit chronologies de pin gris
(pinus banksiana Lamb.) et de huit chronologies d'épinette noire (picea mariana
(Mill.) B.S.P.). J'ai ensuite calculé les corrélations entre ces estimées de l'activité des feux et les hauteurs géopotentielles à 500 hPa, afin de déterminer les patrons de
circulation atmosphérique associés à l'aire brûlée de ces territoires, et vérifier si le patron de circulation atmosphérique responsable de l'aire brûlée dans le Triangle de Feu diffère de ceux déterminant l'aire brûlée ailleurs dans la province.
Dans le troisième chapitre, j'ai utilisé les données météorologiques quotidiennes régionales simulées par le Modèle Régional Canadien du Climat pour la période 1961-2100 afin de calculer les composantes régionales de l'Indice Forêt-Météo pour un scénario de changements climatiques futurs. J'ai utilisé la relation historique (1972-2002) entre l'activité régionale des feux (aire brûlée annuellement et nombre annuel de feux) et les composantes de l'Indice Forêt-Météo comme fonction de transfert pour calculer les variations futures dans l'activité régional des feux sous l'influence des changements climatiques. J'ai ensuite calculé les taux de changements dans l'aire brûlée et le nombre de feux annuels entre trois périodes de référence: 1975-1995 (concentration actuelle de CO2 atmosphérique, 1x C02 ), 2030
2060 (2 X C02) et 2070-2100 (3 X C02) afin de déterminer les tendances futures de l'activité des feux dans la région de Waswanipi sous l'influence des changements climatiques.
Dans le quatrième chapitre, j'ai analysé les concepts communs à l'adaptation aux changements climatiques et à l'aménagement forestier durable afin de vérifier comment la théorie et la pratique de l'adaptation aux changements climatiques pourraient contribuer à développer l'aménagement forestier durable. Dans ce chapitre, je présente les feux comme vulnérabilité particulière de notre système d'aménagement face aux changements climatiques. J'analyse également des stratégies d'aménagement encore peu utilisées (e.g., Triade, IntelliFeu) qui permettraient de concilier les objectifs d'aménagement durable des forêts et d'adaptation aux changements climatiques en facilitant l'intégration du risque de feu dans la planification forestière stratégique et tactique. L'objectif de ce chapitre est de livrer aux professionnels de la forêt des applications pratiques des connaissances développées dans les chapitres précédents.
1.1 Résumé
À travers la forêt boréale québécoise, des changements synchrones dans les régimes de feu régionaux ont été observés. Ce synchronisme suggère que les régimes de feu sont influencés par la variabilité climatique à grande échelle. La présente étude examine l'influence des variations climatique à grande échelle sur l'activité régional des feux, telle que reflétée par la distribution régionale des classes d'âge. Les variations interdécénnales de l'activité des incendies forestiers de la région de Waswanipi, dans le centre du Québec ont été reconstituées pour la période 1920 2000. Cette reconstitution a ensuite été analysée à l'aide de différents indices climatiques tels que l'Oscillation Pacifique Décénnale (OPD) et l'Oscillation Nord Atlantique pour la période 1880-2000. Nous avons estimé le cycle de feu global à environ 153 ans, avec un allongement de 99 and avant 1940 à 282 ans après 1940. Les corrélations entre la variabilité décennale de l'activité des feux et les indices climatiques indiquent une influence positive de l'OPD. Cette relation a été validée à l'échelle interannuelle pour les années de grands feux entre 1899 et 1996.
1.2 Abstract
The synchrony of regional fire regime shifts across the Québec boreal forest, eastern Canada, suggests that regional fire regimes are influenced by large-scale climate variability. This study investigated the influence of large scale climate variations on the regional fire activity as it is reflected by the regional age-class distribution. The interdecadal variation in forest fire activity in the Waswanipi area, northeastern Canada, was reconstructed over AD 1720-2000. Next, the 1880-2000 reconstructed fire activity was analyzed using different proxies of the Pacifie Decadal Oscillation (PDO) and the North-Atlantic Oscillation. We estimated the global fire cycle around 153 yr, with a major lengthening of the fire cycle from 99 yr before 1940, to 282 yr after 1940. Correlations between decadal fire activity and climate indices indicated a positive influence of the PDO. The positive influence of PDO on regional fire activity was also validated using t-tests between fire years and non-fire years between 1899 and 1996.
1.3 Introduction
Numerous studies have documented regional fire regimes throughout the boreal forest (Mann et al. 1995; Flannigan et al. 1998; Bridge 2001; Kasischke et al. 2002; Bergeron et al. 2004a, 2006; Parisien et al. 2004). These regional fire regimes
result from the combination of local weather conditions, topography, forest fuels, and ignition agents (lightning and human activities). Given that volcanic activities, solar radiation and chemical composition of the atmosphere constantly influence the global climate dynamics (Bonan 2002), and that there is a strong linkage between climate and fire activity, variations in historical observations of fire activity due to changes in the climate are expected (Flannigan and Harrington 1988; Johnson 1992; Swetnam 1993). The fire regime integrates several variables describing the fire activity such as the mean fire size, the annual area burned, the fire severity, the fire frequency, and the mean fire return interval (or fire cycle) (Weber and Flannigan 1997). While regional fire regimes vary widely from one area to another, cornmon temporal patterns in historical fire regime shifts have been reported. In the context of the past 300 years, many regional fire regimes of the Canadian boreal forest, as reconstructed from dendroecological analysis, experienced a decrease in fire frequency after 1850 (Bergeron and Archambault 1993; Larsen 1996) and a further decrease after 1940 (Bergeron et al. 2001, 2004a,
2004b, 2006). Conversely, analyses of fire statistics from provinces and Canadian agencies suggested that during the past three decades, area burned and fire frequency have increased throughout much of boreal Canada (Skinner et al. 1999, 2002; Stocks et al. 2003; Kasischke and Turetsky 2006). Whatever the temporal
scale investigated, the synchrony of long-term temporal trends in fire activity across the Canadian territory suggests the persistence of a large-scale climatic control of fire activity (Bergeron et al. 2001, 2004, 2006).
Large-scale climatic variations in the Northern Hemisphere are typically described by recurrent oceanic and atmospheric circulation patterns, sorne of which are originating from the Pacific and Atlantic Oceans and acting at interannual to interdecadal timescales. In Canada, several modes were held responsible for temporal and spatial variations in the countrywide weather conditions conducive to
fire activity. These include the global long-term trend in ocean temperatures (Skinner et al. 2006), the El Nino - Southern Oscillation (ENSO) and related Pacifie Decadal Oscillation (PDO) (Girardin et al. 2006a; Skinner et al. 2006; Macias Fauria and Johnson 2006), the North Atlantic Oscillation (NAO) (Girardin et al. 2004), the Arctic Oscillation (AO) (Macias Fauria and Johnson 2006), and the Atlantic Multidecadal Oscillation (AMO) (Skinner et al. 2006). The influence of these modes on historical fire activity is heterogeneous across Canada and reflects the dynamics of the upper atmosphere longwave patterns (ridges and troughs) over oceans and lands (Bonsal et al. 1993; Bonsal and Lawford 1999; Skinner et al. 1999; Macias Fauria and Johnson 2006).
This study investigates the influence of large-scale climate variability on the regional fire activity as reflected by the age-class distribution, and on the occurrence oflarge fire years in the Waswanipi area, central Québec. First, we reconstructed the historical fire activity between 1720 and today over an area of 11 500 km2 using
dendroecological sampling along with forest inventories, aerial photographs, and ecoforest maps. The fire cycle in the Waswanipi area was estimated for different time periods to identify temporal trends in fire activity. Second, decadal fire departures obtained from the forest-age distribution were correlated to oceanic and atmospheric circulation indices. The regional fire activity was examined in light of climate index regime shifts at the interdecadal scale. Final1y, fire years as documented by replicated tire scars and recent tire data were used to explore the influence of variations in oceanic and atmospheric circulation patterns on the occurrence of large fire years in the Waswanpipi area. Determination of the link between fire and climate is an essential step toward understanding the dominant forcing of landscape-scale disturbance of boreal forests. Additionally, such analysis yields valuable tools for planning fire management activities and to improve forecasts of climate change impacts on the boreal forest (Flannigan et al. 2005; Duffy et al. 2005; Skinner et al. 2006). Several studies have documented the temporal correlations (or teleconnections) between climate and ocean circulation indices and regional fire activity as documented by fire scars and tree-ring chronologies (Swetnam and Betancourt 1990; Sibold and Veblen 2006). Recently,
Brown (2006) documented the influence of climate indices on the tree recruitment dynamics in ponderosa pine forests. However, our study is the first to our knowledge linking oceanic and atmospheric circulation indices to stand-age distribution in boreal Canada.
1.4 Methods 1.4.1 Study area
The study area (49.5-50.5° N; 75-76.5° W; Fig. 1.1) lies in the north-central commercial forest of Québec and covers more than 11 500 km2 (Fig. 1.1). Situated in the western black spruce - feather moss bioclimatic domain (MRNFQ 2000), the forest consists principaUy of black spruce (Picea mariana) and jack pine (Pin us banksiana) stands. Situated on the Canadian Precambrian Shield, the landscape has a high density of lakes and is dominated by morainal till deposits with scattered rocky outcrops covering 10-30% of the landscape (Robitaille and Saucier 1998; Centre for Land and Biological Resources Research 1996). The relief is relatively rugged, consisting of a 10-30% slope going east that produces a weU-drained landscape overall. The mean annual temperature is o°C, with January and July being the coldest and the warmest months, respectively. The area receives an average 961 mm of total annual precipitation, about one-third of which faUs as snow. The growing season is from April to October with 1235 growing degree-days above 5°C (data from Chapais weather station 1971-2000 climate normals, Environment Canada 2004).
Fire is the main disturbance of these forests. Using provincial fire data (1945-1998), Lefort et al. (2004) identified a gradient in the fire activity (increasing northward) across the broader region containing our study area. They estimated a fire cycle between 200 and 500 yr for the southern part and a fire cycle shorter than 200 yr for the northern part, where the Waswanipi area lies. This relatively high fire activity in our study area is corroborated by the high proportion of stands younger than 100 yr, and is one of the criteria underlying the current northern limit of the commercial forest in central Québec (MRNFQ 2000).
Colonization in the Waswanipi area began after 1940. It primarily hinged on mining and later on forest management, but no agricultural activities took place in the study area. Cree populations live around the Waswanipi Lake in the southwestern corner of the study area (Fig. 1.1) and on the shores of the Waswanipi River; a small fraction is scattered across the study area. The modern Waswanipi community was established in the 1970s. The nearby Chapais village developed in the 1950S to carry out mining activities. Thus, human influence had historically little effect on the natural fire regime when compared with the adjacent Abitibi and Lac-Saint-Jean areas where colonization started earlier, and converted forest territories to agriculturallands using slash and burn techniques (Lefort et al. 2004). Fire suppreesion over the study area started in 1958 (Langlois 1994).
1.4.2 Field sampling
The fire history (1720-2000) was reconstructed using forest inventories, aerial photographs, ecoforest maps, and field sampling to determine the cumulative time since-Iast-fire (TSF) distribution for the study area (Johnson and GutseIl1994). Two hundred sampling points were randomly located over the terrestrial area of the study area (when excluding rivers and lakes) using the Generate Randomly Distributed Points script in ArcView GIS 3.2. Of these, 84 sampling points were located inside the burned areas compiled in the provincial fire database (Ministère des Ressources naturelles et de la Faune, MRNFQ) and were consequently dated using the most recent inventoried fire. Of the remaining 116 points, 67 were field sampled during the summers of 2002 and 2003. At each sampling point, 10 dominant trees of typically pioneer species (jack pine, or if not available, black spruce) were sampled by taking a cross section or two opposite increment cores from the trunk base ca. 30 cm above the ground. Forty-nine points, located outside
the documented burned areas, were considered inaccessible (~ 5 km from road access). These points were situated mostly in the northern part of the study area where the road network is sparse. For 15 of these points, permanent plots of the MRNFQ were sufficiently close (< 2 km) to provide a non-censored estimate of TSF from the oldest tree documented in each plot. For the 34 remaining points, stand ages from the ecoforest maps were used as a censored minimum TSF estimate, with
120 yr being the maximum age considered. As sampling was based on a random spatial distribution of sampling points, we assumed that each sampling point is representative of the same proportion of the study area (0.5%) and that the TSF distribution derived from the 200 random sampling points approximated the complete TSF distribution for the entire study area.
1.4.3 Dendrochronological analysis
Sampled cores (n
=
792), and cross sections (n=
430) were dried, sanded, and aged by counting tree rings under a dissecting microscope, following standard procedures proposed by Yamaguchi (1991), Fritts (2001), and Stokes and Smiley (1968). Pith locators were used to estimate the number of missing rings to the pith on incomplete cores (Phipps 1985). Diagnostic rings allowed visual crossdating to confirm sampIe age. Among the sampled cross sections, 46 fire scarred trees allowed us to accurately estimate the fire date for 31 different sampling sites. Replicated fire scars (recorded on ~ 2 trees, Brown 2006) were used to develop the regional fire-year chronology. Replicated fire scars were found in distant sampling points and were generally confirmed by cohort age originating from fire that fire scarred trees survived. AlI fires reported are thus stand-replacing fires. To crossdate snags and living trees, we measured tree-ring width using a Velmex system coupled with the MEASUREJ2X 3.1 package for Windows (VoorTech 2001). Cross-dating of all sampIes was validated with COFECHA (Holmes 1999).1.4.4 Fire history
The frequency of sampled sites was computed per decades to identify major fire decades. The global TSF distribution was computed to evaluate whether the fire frequency was constant over space and time (Johnson and GutsellI994). Assuming that the hazard of burning is independent of stand age, the TSF distributions should follow the negative exponential model and should appear as a straight line on a semilog scale (Van Wagner 1978; Johnson and Gutsell 1994). Fire cycles were computed using the LIFEREG procedure in SAS 9.1 (SAS Institute Inc. 2000), which is a standard maximum-likelihood procedure for analyzing survival data while taking into account censored data (Allison 1995). Our TSF estimates
(survivorship) were considered censored when no accurate date could be attributed to the fire; in these cases, we used a minimum TSF estimate, i.e., the age of the oldest individual when no tree cohort could be clearly identified (Bergeron et al. 2004b). Thirty-one and a half percent of the data were censored. Finally, the LIFEREG procedure provides a Lagrange Multiplier Statistic based on a x2-test to evaluate whether the scale parameter of the exponential model was significantly different from one, thereby alJowing us to determine if the data distribution followed a negative exponential model (p > 0.05) or not (p < 0.05). If this is the case, then the corresponding mean forest age provides a good estimate of the fire cycle.
TSF distributions were also computed for different parts of the study area and for different time periods to determine if the variations observed in the global fire activity (slope breaks on the TSF distribution) was related to spatial and/or temporal variations in the fire activity. Spatial patterns were investigated by a spatial sub-sampling. The dataset was divided into four equivalent sectors containing about 50 sampling points each (northeastern, northwestern, southeastern and southwestern sectors). Different periods were delimited according to documented period of changes in the fire activity in other parts of the boreal forest (end of the Little lce Age ca.ISso, and 1940) to verify if the Waswanipi area has similar temporal variations or not. The LIFEREG procedure was used to test these variations as this procedure allowed the evaluation of the effect of class covariables (sectors or time periods) using a X2 test, while taking into account censored data.
Reed (2006) underlined the limits of estimating the fire cycle using TSF distributions. We however chose to estimate this fire regime parameter to allow comparisons with other fire history studies using the same standard approach, and to provide a parameter useable for disturbance-based forest management. Also, the TSF distribution approach allowed us to take into account minimum TSF date when no accurate fire date could have been attributed to the sampling site. The fire cycle was also estimated using the LIFETEST procedure to estimate the hazard function
(burn rate) associated with the life table survival estimates. This allowed us to provide an estimate of the fire cycle (l/burn rate) taking into account the censored data without constraining the survival function to follow the exponential negative distribution (which is required when using the LIFEREG procedure).
1.4-5 Clïmate indices
In this study, we used several climate indices to analyze the influence of large-scale climate variability on the Waswanipi fire history. The indices considered were the Pacifie Decadal Oscillation (PDO), the North Atlantic Oscillation (NAO), and the Atlantic Multidecadal Oscillation (AMO).
The PDO corresponds to a long-lived El Nifio-like pattern acting as a decadal mode of North Pacifie sea surface temperature (SST) variability (Mantua et al. 1997; Zhang et al. 1997). Pacifie SST anomalies have been linked with atmospheric
circulation patterns consisting in ridging over western North America during warm coastal SSTs (Bonsal et al. 1993; Bonsal and Lawford 1999). The blocking highs
typically persist for several days to several weeks and influence the fire weather conditions and the area burned across large Canadian regions (with greater area burned occurring downstream from the ridges; Johnson and Wowchuk 1993; Skinner et al. 1999; 2002; 2006; Girardin et al. 2006a). The PDO index of Mantua et al. (1997) is an instrumental series covering the period 1900 to the present
(available at http://jisao.washington.edu/pdo) and is obtained from the leading principal component of North Pacifie monthly SST poleward of 200 N. Smith and Reynolds (2003) extended this index back to 1854 using the most recently available SST data from the International Comprehensive Ocean-Atmosphere Data Sets (available at ftp://ftp.ncdc.noaa.gov/pub/data/ersst-V2j). The remaining three PDO datasets were paleoclimatological reconstructions derived from proxy data. The annual PDO reconstruction of D'Arrigo et al. (2001), extending from 1700 to
1979, is based on tree-ring chronologies from coastal Alaska and Pacifie Northwest regions and accounts for up to 53% of the instrumental PDO variance. The annual PDO reconstruction of Biondi et al. (2001) is based on tree-ring data from
California and extends from 1661 to 1983. The annual Shen et al. (2006) record is
based on proxy summer rainfall of eastern China and covers the 1470-2004 period.
The NAO index is based on the difference of normalized sea-level pressures (SLP) between the subtropical (Azores, Portugal) high and the subpolar (Stykkisholmur, Iceland) low pressure systems of the NAO (Hurrell 1995). The strongest and most climatologically effective expression of the NAO occurs during winter when the north-south pressure gradient is particularly stable between its two centres of action. Strong positive NAO phases are usually associated with ab ove-normal temperahlres in the northeastern United States and across northern Europe, and below-normal temperatures in Greenland and in Mediterranean regions (Visbeck et al. 2001). Instrumental monthly NAO series from Jones et al. (1997) and monthly
NAO reconstructions from Luterbacher et al. (1999) were used. The Luterbacher
monthly NAO index, covering the period 1659-2001, is based on early European instrumental SLP, temperature and precipitation. These two monthly databases were used to calculate seasonal NAO indices (December-January-February, March April-May, June-July-August, and September-October-November). We also used the NAO series from Glueck and Stockton (2001), which is a tree-ring based winter reconstruction (1429-1983) calibrated against the Lisbon-Iceland NAO (from HurrellI995)·
The PDO and the NAO reconstructions were extended to 1999 using the instrumental series (from Mantua et al. 1997 for the PDO, and from Jones et al.
1997 for the NAO) after adjusting the variance to that of the reconstructions.
The AMO corresponds ta a basin-wide low-frequency (65-80 yr) component of SST variability (Kerr 2000). Enfield et al. (2001) have documented reduced summer
rainfall and river flow regimes over the United States during warm AMO phases, while Skinner et al. (2006) have documented a negative influence of warm AMO
phase on fire weather conditions across northern Ontario and Québec. We used the 1567-1990 annual North Atlantic sea surface temperature anomaly (SSTA) reconstruction of Gray et al. (2004). This annual reconstruction is based on the
leading principal component of twelve tree-ring chronologies from southeastern North America, southern Europe, Scandinavia, western North Africa and the Middle East. The corresponding AMO index is a 10-yr running mean of the SSTA
reconstruction. For the purpose of this study, we used the AMO variable for the decadal correlation with TSF distribution and the SSTA reconstruction for the analysis of fire years versus non-fire years to avoid the autocorrelation bias
associated with the lO-yr smoothing.
1.4.6 Climate influence on the decadalfire activity
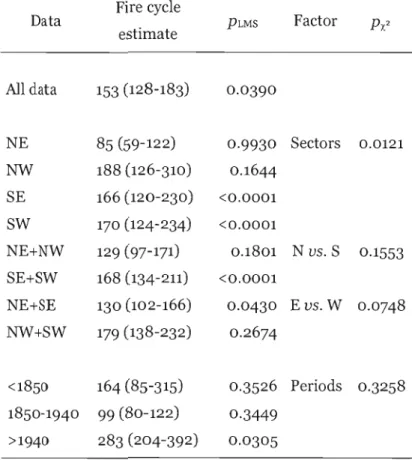
We were interested in characterizing the departures from the average area burned per decade. Because recent fires tend to eliminate information relevant to past fires, an exponential curve (as previously computed using the LIFEREG procedure) was fit to the stand-age distribution using survival analysis. The mean forest age for the whole period was estimated at 153 years with 95% confidence intervals [128; 183]. Decadal departures from the average area burned were calculated by subtracting the theoretical exponential curve from the stand-age distribution.
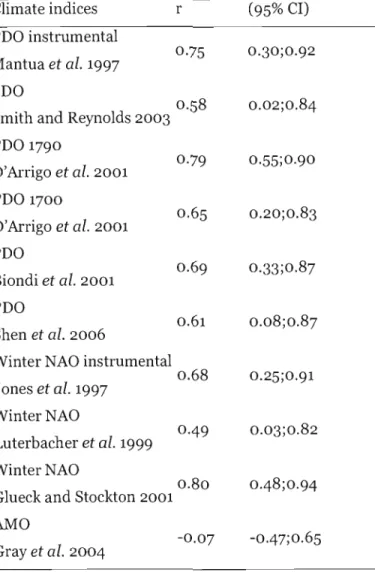
Next, annual values of atmospheric and oceanic circulation indices were averaged by decades and correlated with decadal fire departures. We restricted our analyses to the 1880-1990 time period as the previous fire decades were had a high proportion of censored data. Pearson correlations between decadal fire departures and decadal averages of the climate indices were computed using the PEARSONT program (Mudelsee 2003). This program uses a nonparametric stationary bootstrap to calculate the 95% confidence interval associated with the Pearson correlation coefficient and resamples blocks of data pairs to account for the presence of seriaI correlation in the time series. When the confidence interval contains zero, the hypothesis of 'no correlation' cannot be rejected at the 95% level. The normality of the data was verified prior to the correlation analyses using the Shapiro-Wilk normality test (Zar 1999). AlI variables satisfied the normality assumption (p > 0.2), except the decadal averages of the PDO series of Shen et al. (2006), the winter NAO of Glueck and Stockton (2001) and the winter NAO computed using the monthly NAO reconstruction from Luterbacher et al. (1999). For the two first variables,
correlations were computed on ranked data as no transformation made it possible to reach normality. For the winter NAO from Luterbacher et al. (1999), an exponential transformation was used to reach normality (p 0.65 after transformation). Scatterplots of the decadal fire departures and decadal climate indices (not shown) confirmed that relationships were linear and that Pearson correlations are an appropriate method for analyzing them.
1.4.7 Climate influence on the occurrence offire years
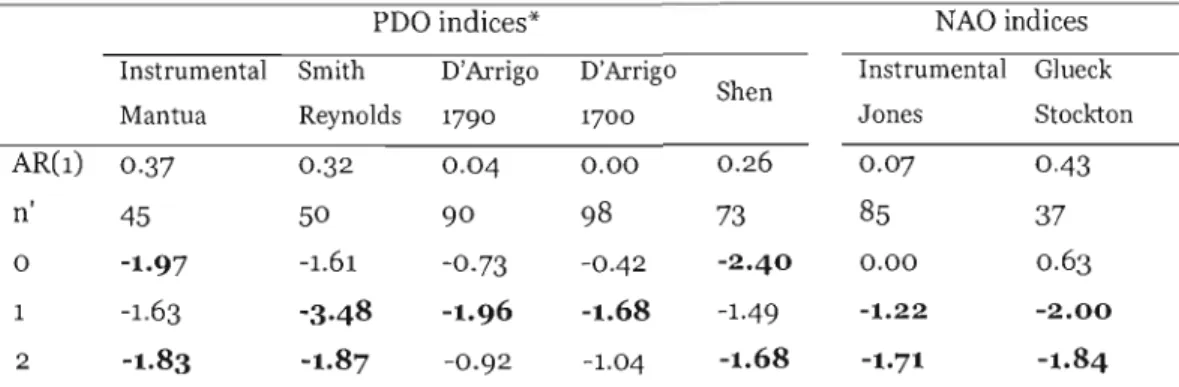
The influence of interannual climate vari avility on the occurrence of large fire years in the Waswanipi area was investigated by computing differences in mean climate indices (POO, NAO, AMO) for fire years and non-fire years. Two-sample mean tests (Zar 1999) were computed using SYSTAT 11 (Systat Software Inc. 2004) on unlagged climate indices as weIl as on climate indices lagged by one and two years previous to the reported fire year. Critical t-values were adjusted to account for autocorrelation in data. AlI climate indices satisfied the normality assumption (according to the Shapiro-Wilk normality test, Zar 1999). Twelve fire years documented by replicated fire scars (1899, 1907, 1915, 1916, 1925, 1934, 1940, 1966, 1982, 1984, 1985, and 1994) were used to discriminate the fire years from the non fire years. Also, three major fire years (1983, 1986 and 1996) that are not reported by our fire scar sampling and that accounted for more than 5% of the total area burned during the 1905-1998 period were added to the regional fire year chronology.
Regime shift analyses were computed on different responsive POO and NAO indices using the program developed by Rodionov (2004). This analysis is based on a sequential t-test to detect regime shifts, where the time scale to be detected is controlled primarily by the eut-off length. Both eut-off length and probability level affect the statistically significant difference between regimes, and hence the magnitude of the shifts to be detected (Rodionov and Overland 2005). These analyses aimed to verify the synchrony of regime shifts from positive to negative phase and vice versa, with decadal fire departures and with the frequency of reported fire years. Results were highly sensitive to the eut-off length chosen,
primarily in relation to the amplitude of interannual variations of the climate index considered. We used a eut-off length of 10 yr because we were primarily interested in the decadal influence of POO on the TSF distribution, which also was gathered in lO-yr classes.
Finally, stepwise multiple regression analyses (SYSTAT 11, Systat Software Inc. 2004) were computed to prospect potential combination effects of teleconnections from the Atlantic and the Pacifie oceans.
1.5 Results
1.5.1 The Waswanipifire history
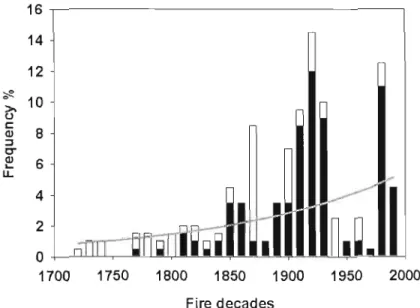
The early 20th century (1900-1940) was characterized by high fire activity, with
43.5% of the area burned recorded from 1720-2000 (Fig. 1.2). Three time periods of relatively high fire activity were observed: 1850-1860, 1910-1940, and 1980-1990. The 1870 peak of censored data corresponded to inaccessible sampling points that were documented by the oldest age-class reported on ecoforest maps (120 yr). The 1720-2000 mean forest age was estimated to be about 153 yr and the survival curve suggested changes in the fire frequency through time and/or space (Table 1, Fig. 1.3a).
The mean forest age varied according to the different sectors (p
=
0.0121, Table 1.1), but was neither due to a latitudinal (North versus South), nor to a longitudinal (Eastversus West) effect (p > 0.05, Table 1.1). It was instead related to the combination of latitude and longitude as only the northeastern sector had the shorter mean forest age (85 yr) when compared with the three others (around 170 yr, Fig. 1.3b, Table 1.1). The TSF distributions for the sectors displayed mixed distributions with synchronous changes in the fire frequency around 1940 and 1840 (Fig. 1.3b, Table 1.1). The temporal changes of fire frequency for each sector were not tested because of insufficient sample size.
TSF distributions corresponded to relatively constant fire activity for the <1850 and the 1850-1930 periods. The 1940-2000 period had a weaker fit to the exponential
model, likely due to the 1980-1990 higher fire activity (Fig. 1.3C, Table 1.1). The mean forest age was estimated to be about 164 yr before 1850, 99 yr for the 1850 1940 period, and 283 yr for the 1940-2000 period. Although striking, differences in the mean forest age over these intervals were not significant (Table 1.1).
An examination of the temporal evolution of the decadal bum rate through time (1820-2000) indicated a mean fire cycle of 132 yr \-vith a 98-yr fire cycle before 1940 and a 232-yr fire cycle after 1940 (Fig. 1-4a). Moreover, the sequential computation of the fire cycle estimates during the 1820-2000 period confirmed that fire cycle varied significantly before and after the decades 1920, 1930, 1940, 1950, and 1960 (Fig. 1.4b). The fire cycle oscillated around 143-yr for the last 180 yr, \-vith a constant increase from 1940 to 1980 (Fig. 1-4b). Hence, the temporal change in the regional fire activity around 1940 echoed synchronous change in neighbouring forested areas documented in the literature (Bergeron et al. 2001, 2004a, 2004b, 2006),
suggesting a large-scale control of multidecadal trends in regional fire activity. Below, the reconstructed Waswanipi fire activity is analyzed \-vith respect to large scale climate variability.
1.5.2 Climate influence on recentfire activity
The visual inspection of the PDG series (Fig. 1.5a, 1.5b, 1.5C, 1.5d) and of the decadal fire departures (Fig. 1.5f) suggested a synchrony of phases of higher PDG (around 1860, before 1947, and after 1977) and periods ofhigh fire activity in the Waswanipi area (1900-1940 and 1980-1990 fire decades). Conversely, a lower PDG phase is
synchronous to the 1950-1970 low fire decades (Fig. 1.50. The relationship is not as clear prior to 1880, perhaps because ofthe high amount of censored data in our fire departures prior to that period. AlI PDG time series tested were weIl correlated with
the Waswanipi fire departures for the 1880-1990 period (r > 0.58, Table 1.2). The best predictors of the decadal fire departures were the instrumental PDG series of
Mantua et al. (1997), and the 1790-1997 PDG reconstructions of D'Arrigo et al.
(2001) (r > 0.75, Table 1.2). Significant positive correlation was also found \-vith the \-vinter NAü series of Luterbacher et al. (1999) and of Jones et al. (1997). Stepmse
combination effect of the PDO and the winter NAO according the following regression models:
y
=
0.5655 + 8.5134PDO + 4. 1304NAOj (Eq. 1.1)y
=
-3.2752 + 8.9911PDO + 5.5710EXP(NAOgs ) (Eq. 1.2)where y are decadal fire departures, PDO is the 1790-1997 PDO reconstruction of D'Arrigo et al. (2001) (that alone explained about 58% of the variance in the 1880
1990 decadal fire departures, p
=
0.004, not shown), NAOj is the winter NAO series calculated using the Jones et al. (1997) dataset, and NAOgs is the winter NAü reconstruction of Glueck and Stockton (2001). These models explained respectively about 71% (adjusted R2=
0.64, P=
0.004, NAO regression coefficient with t =2.0085 and p
=
0.0755), and 74% (adjusted R2=
0.68, P=
0.002, NAO regression coefficient with t=
2.3459 and p=
0.0436). The winter NAO index from Glueck and Stockton (2001) did not fully satisfy normality after an exponential transformation according to a Shapiro-Wilk normality test (p=
0.17). This index was used to confirm the results shown by Eq. 1.1. Both regression models suggested a reinforcing influence of the winter NAO on the positive relationship between PDO and the decadal fire departures.As indicated by the correlation analysis on decadal averages of proxy climate indices, the distribution of fire years also followed weIl the long-term variations of the PDO. The t-tests indicated higher PDO values during reported fire years and for the two years previous to the reported fire years and higher NAO values for one and two years previous to the reported fire year (Table 1.3). Regime shift analysis confirmed coherent regime shift of the PDO indices around 1950 (from a positive to a negative phase) and around 1977 (from a negative to a positive phase). Only one fire year was reported for the negative PDO phase (1947-1966) while the other fire years were reported during higher PDO phases. The 1790-1997 PDO index of D'Arrigo et al. (2001) (Fig. 1.5c) also displays a higher regime before 1850, while no
regime shift was detected on the other PDO indices before 1900 (PDO index of Smith and Reynolds (2002), Fig. l.Sb) or 1930 (PDO index of Shen et al. (2006), Fig. l.Sd). The different NAO indices gave no coherent regime shifts, so only the winter NAO reconstruction of Glueck and Stockton (2001) was used to compare visually the regime shifts detected with the decadal fire departures. The winter NAO had a higher regime around 1930 and changed from a negative to a positive phase around 1977 (Fig. l.se).
1.6 Discussion
1.6.1 The Waswanipifire history
Conversely to other studies located south of our study area (Bergeron et al. 2001, 2004b), we did not detect any change at the end of the Little Ice Age ca.18so. The only significant change in the Waswanipi fire activity occurred around 1940. The fire cycle has lengthened from 99 yr (18SO-1940) to 283 yr (1940-2000). This lengthening at ca. 1940 has been also reported from central to western Québec (Bergeron et al. 2001) and in southwestern Québec (Grenier et al. 200S; Drever et al. 2006). This may reflect the reported decrease in the incidence of extreme fire
years at the scale of the Boreal Shield (Girardin et al. 2006b). In Québec, the early
20lh century is usually associated with the onset of European settlement and the use
of slash-and-burn techniques to clear forested lands for agriculture (Bergeron et al.
2001; Lefort et al. 2003; Grenier et al. 200S). As the Waswanipi area was settled later (after 1940) than the neighbouring regions of Abitibi and Lac-Saint-Jean (Lefort et al. 2004), and given that no agricultural activities took place in this area,
the higher fire activity of the early 20th century cannot be explained by settlement
and was mainly prompte<:! by climate. Girardin et al. (2006b) suggested this climate
effect prevailed over the Boreal Shield. Their reconstructions of an nuaI area burned using tree-ring data suggested that greater fire activity occurred in the first half of the 20lh century than after 19S0.
It should however be noted that the 1980-1990 decades were also marked by a high fire activity in the Waswanipi area. These decades were also reported as being major fire decades in Eastern Abitibi and in Central Québec (Bergeron et al. 2001), two
locations close to the Waswanipi area. These higher fire decades were also reported in other parts of the Canadian boreal forest (Gillett et al. 2004; Skinner et al. 1999, 2002; Macias Fauria and Johnson 2006). Moreover, the years 2002 and 2005, two major fire years in the Waswanipi area, are not included in our fire cycle estimates. Also, the fire cycle estimates computed using the survival analyses with the negative exponential model is very sensitive to the distribution of high fire years: while we presented a 283-yr fire cycle estimate for the 1940-2000 period, the fire cycle estimate for the 1920-2000 period is about 173 yr (not shown). This suggests that numerical estimates of fire cycle varied greatly depending on the inclusion or the exclusion of the 1920-1930 high fire decades. Given the sensitivity of the fire year distribution and the fact that we did not include the recent high fire years in our analyses, our estimates probably overestimate the recent fire cycle. However, the global 1820-2000 mean fire cycle estimates (132 and 143 yr) are close to the 153-yr mean forest age calculated for the 1720-2000 period using the negative exponential model.
1.6.2 Climate influence on recentfire activity
Our results reported a positive influence of the PDO on the fire activity in the Waswanipi area at least for the 1880-1990 period. Skinner et al. (2006) also
reported that warm winter El Nino - PDO events lead to fire-conducive droughts in northern Ontario and Québec. However, large spatial variability was found and sorne regions, such as the Great Lakes regions of southern Ontario and central Québec, are showing an inverse relationship to these Pacific processes. Their analyses of the relationship between fire-weather conditions across Canada during the 1953-1999 period and the Pacific SSTs could reconcile our results with those of Girardin et al. (2006a) who suggested a negative influence of PDO on fire
conducive drought conditions over eastern boreal Canada (i.e., cool PDO phase associated with greater fire activity) as our study area is situated north of that of Girardin et al. (2006a). Finally, Macias Fauria and Johnson (2006) also reported a
positive influence of the PDO variability on interdecadal variation of area burned in several areas east of the Canadian Rocky Mountains, including our study area. The positive influence of PDO on decadal fire departures could have prevailed earlier as