Water temperature dynamics downstream of reservoirs
Research Report #1347
By
André St-Hilaire
1, Audrey Maheu
1, Laurie Beaupré
1,
Anik Daigle
1, Daniel Caissie
1,21.
Statistical Hydroclimatology Research Group
Institut national de la recherche scientifique
Centre Eau, Terre et Environnement
(INRS-ETE)
490 De la Couronne, Québec, G1K 9A9
2.
Fisheries and Oceans Canada, PO Box 5030, Moncton, N.B.
Prepared for the
Center of Expertise on Hydropower Impacts of Fish and Fish habitat –
Fisheries and Oceans Canada
Reference to be cited :
TABLE OF CONTENT
TABLE OF CONTENT ... I
LISTE OF TABLES ... III
LIST OF FIGURES ... IV
1.0 INTRODUCTION ... 1
2.0 METHODS ... 2
2.1 STUDY SITES AND TEMPERATURE MONITORING ... 2
2.2 THERMAL INDICES ... 4
3.0 RESULTS ... 5
3.1 THERMAL INDICES ON HYDRONET RIVERS ... 5
3.2 MONITORING OF WINTER TEMPERATURE ON THE FOURCHUE RIVER. ... 11
4.0 CONCLUSION AND FUTURE WORK ... 12
5.0 REFERENCES ... 13
LISTE OF TABLES
TABLE 1.LIST OF RIVERS AND THEIR LOCATIONS. ... 2
LIST OF FIGURES
FIGURE 1.LOCATION OF THE RECOVERED THERMOGRAPHS DEPLOYED DURING THE 2011-2012 WINTER IN
THE FOURCHUE RIVER. ... 4
FIGURE 2.BOX PLOTS OF A SUBSAMPLE OF THERMAL INDICES OF THE BATCHAWNA AND MAGPIE RIVERS. .... 7
FIGURE 3.BOX PLOTS OF A SUBSAMPLE OF THERMAL INDICES OF THE AUBINADONG AND MISSASIGI RIVERS. 8
FIGURE 4.BOX PLOTS OF A SUBSAMPLE OF THERMAL INDICES OF TWILICK BROOK AND WEST SALMON
RIVER. ... 9
FIGURE 5.BOX PLOTS OF A SUBSAMPLE OF THERMAL INDICES OF PETIT-SAGUENAY AND ST-JEAN RIVERS. . 10
1.0 INTRODUCTION
Fisheries and Oceans’ Center of Expertise on the Effects of Hydropower on Fish and Fish Habitat (CHIF) is conducting research in partnership with the HYDRONET NSERC (Natural Science and Engineering Research Council) network. As part of this partnership, researchers from the Gulf Region (D. Caissie) and INRS-ETE (A. St-Hilaire, A. Daigle, A. Maheu and L. Beaupré) are involved in investigating the potential impact of dams on the thermal regime of rivers. A large part of this research deals with water temperature modelling and is being conducted as a sub component of HYDRONET project dealing with the thermal regime of rivers. In addition, the present project, which is funded by CHIF, deals with the characterization of the thermal regime on impounded and natural rivers.
The specific objectives of this project are complementary to those of HYDRONET subcomponent 6.3.2 (Effects of dams on the thermal regime of rivers). These objectives include: 1) to monitor both regulated and unregulated (control) HYDRONET sites for comparison purposes and assess the degree of thermal modifications, with an emphasis on winter thermal conditions and summer extremes, 2) to study the spatial variability of thermal conditions immediately downstream of reservoirs and to define thermal indices that characterize this variability. Additional specific objectives identified in the proposal have not been addressed in the present study, but will be components of the theses of the two graduate students involved in the project (L. Beaupré and A. Maheu).
2.0 METHODS
2.1
Study sites and temperature monitoring
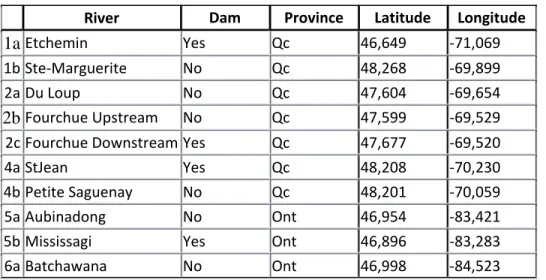
Within the research framework of HYDRONET, study sites include paired rivers (one impounded, one natural) located in the provinces of Newfoundland and Labrador, Québec, Ontario, Manitoba, Alberta and British Columbia. Water temperature monitoring was initiated in 2011 in a subset of those rivers in Ontario, Québec and Newfoundland (Table 1). In some cases, the initial selection of HYDRONET pairs was respected. However, other rivers were also added due to close proximity and field logistics. The Fourchue River was monitored both upstream and downstream of its dam. The upstream reach of the Fourchue was selected in addition to its original paired river (Du Loup), because the Du Loup River is located mostly in the agricultural portion of the watershed, whereas the reach of the Fourchue river located downstream of the dam is mostly draining a forested region. The Etchemin River, a regulated river, was monitored, but no nearby natural river was monitored. To compensate, the Ste-Marguerite River was added to the list. Water temperature was recorded in a total of 13 rivers. A Microsoft Access database was constructed and is made available to all CHIF and HYDRONET researchers.
Table 1. List of Rivers and their locations.
River Dam Province Latitude Longitude
1a Etchemin Yes Qc 46,649 ‐71,069 1bSte‐Marguerite No Qc 48,268 ‐69,899 2aDu Loup No Qc 47,604 ‐69,654 2b Fourchue Upstream No Qc 47,599 ‐69,529 2cFourchue DownstreamYes Qc 47,677 ‐69,520 4aStJean Yes Qc 48,208 ‐70,230 4bPetite Saguenay No Qc 48,201 ‐70,059
5aAubinadong No Ont 46,954 ‐83,421
5bMississagi Yes Ont 46,896 ‐83,283
River Dam Province Latitude Longitude
6bMagpie Yes Ont 48,035 ‐84,827
7aWest Salmon Yes NFL 48,171 ‐56,228
7bTwilick Brook No NFL 48,117 ‐55,577
Thermographs were deployed during the ice-free period on all rivers listed in Table 1. Given the large spatial dispersion of the selected sites, the deployment was conducted in collaboration with local HYDRONET research partners. This explains in part the variability of the onset of the monitoring period across the country. On all rivers except the Fourchue and Du Loup, water temperature was recorded using Onset Hobo Pendant temperature logger (precision of 0.5 °C). On the three aforementioned river reaches, Hobo Pro V2 (precision of 0.2 °C) were used. Ten thermographs were deployed on each river, except for the Fourchue River, where 20 loggers were deployed per reach.
In addition to water temperature monitoring during the ice-free season, an attempt was made to monitor the thermal regime of the Fourchue River during the winter of 2011-2012. Six thermographs were deployed (three upstream and three downstream of the dam) on 21 November 2011. Of the six deployed, four (two upstream and two downstream of the dam) were recovered on 16 March 2012 (Figure 1).
Figure 1. Location of the recovered thermographs deployed during the 2011-2012 winter in the Fourchue River.
2.2
Thermal Indices
The comparison of the thermal regimes of different rivers can be partly achieved by calculating thermal indices from the recorded time series. Thermal indices are descriptive statistics of the magnitude (e.g. monthly minimum, mean or maximum), timing (e.g. date of occurrence of the monthly maximum) or variability (e.g. standard deviation) of the water temperature time series. The indices that were calculated on the recorded time series are listed in Table 2.
Table 2. Definition of thermal indices.
Mean Monthly mean (°C) for the stated month (7=July, 8=August, 9=September). Means are only calculated on complete monthly time series Max Maximum water temperature for the stated period (e.g. max 07‐09 means the maximum value recorded between July and September).
Julian day of max Date of occurrence of the maximum temperature SD Standard deviation of monthly temperature (°C). Max_Dailyrange Maximum observed daily temperature range for the stated period (°C). Julian day of max range Date of occurrence of the Maximum observed daily temperature range. Degreedays Sum of daily mean temperature of the stated period (°C‐days).
3.0 RESULTS
3.1 Thermal indices on HYDRONET Rivers
Figures 2-5 show boxplots of some of the thermal indices for four pairs of HYDRONET rivers. Tables of indices are in Appendix. Each boxplot represents the empirical distribution of the thermal index, calculated individually for all thermographs deployed in the river. The red line is the median, the limits of the rectangle represent the 25th and 75th percentiles, while the whiskers represent the 10th and 90th percentiles. Outliers are shown as asterisks. On each plot, the natural river is represented by the left-hand side box, and the impounded river by the right-hand side box.
All river pairs show contrasts in the median values of most magnitude indices. Three of the four pairs show higher median mean monthly temperatures for natural rivers than regulated rivers. Monthly means (July, August and September) show median differences varying 0.6 °C and 3.14 °C (difference in medians of monthly means of July between the Magpie and Batchwana rivers). The Abinadong River, which is unregulated, had lower monthly means than its regulated counterpart, the Mississagi River, for the months of August and September.
The date of occurrence of the maximum temperature did not show a systematic difference between regulated and unregulated rivers. Both the Magpie and Mississagi rivers, which are regulated, reached their maximum temperature at a later date than their unregulated counterpart. However, the occurrence of maximum temperature was only separated by one day in the case of Twilick Brook and West Salmon Rivers and maximum occurred on the same day for the St-Jean and Petit Saguenay rivers.
The date of occurrence of maximum daily range showed high variability and no consistent differences between regulated and natural rivers.
Degree-days were summed up for the monitoring period on each river to approximate heat accumulation over the summer. Again, results showed a marked difference between pairs of rivers, with three pairs showing higher degree-days in the impounded river than in the unregulated river and two pairs showing lower degree-days for the regulated system than for the unregulated river.
19 _ 18.8 U ~18,'6 B Cl.. 184 • E 18.2 41 1-18 234 1 233.8 233.6 233.4 Mean 08 1= 1 ~
é3
Twilick Brook West Salmon
SDOS
Twilick Brook W&stSalmon
Julian dary of max
Max 08 26 ~ Û ~ 24 B ~ 22 ~ 20 ~
Twilick Brook West Salmon
Max daily range
Twilick Brook W&stSalmon
Ju r an day of max ra ng:e Degree-days
230
580
3.2 Monitoring of winter temperature on the Fourchue River.
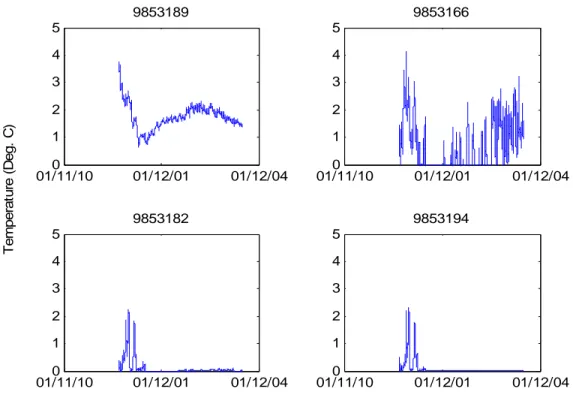
Figure 6 shows the time series of water temperature measured at four sites on the Fourchue River (two below the dam and two upstream of the reservoir, see Figure 1). As expected, the two thermographs that were deployed downstream of the dam show more variability than the thermographs located in the unregulated reach of the river, upstream of the reservoir during winter. Thermograph 9853189, located 100 m downstream of the dam, recorded positive temperatures throughout the winter, with an average of 1.7 °C and a maximum of 3.8 °C in 2011 and 2.4 °C in 2012. Thermograph 9853166, located approximately five km downstream of the dam and 10 m below a breached weir showed high variability, with temperatures ranging from 0°C to 4.1 °C. In the unregulated reach, temperatures varied for the first few weeks, but stabilize to near-zero values in mid-January and showed little variability for the rest of the sampling period.
01/11/100 01/12/01 01/12/04 1 2 3 4 5 9853189 01/11/100 01/12/01 01/12/04 1 2 3 4 5 9853166 3 4 5 T e mp er at u re ( D eg . C ) 9853182 3 4 5 9853194
4.0 CONCLUSION AND FUTURE WORK
This report highlights the recent and ongoing activities of our CHIF project.
In summary:
Water temperature monitoring was initiated in 2011 and will continue in the forthcoming years. The number of rivers to be monitored will be increased during the summer of 2012.
A water temperature database was created and is available in a Microsoft Access format. This database will be expanded in 2012-2013.
Thermal indices were calculated for a limited number of pairs of rivers to characterize the thermal regime. These indices clearly show that the approach will allow contrasting the water temperature magnitude, variability and timing of events on regulated and natural rivers.
Our first attempt at monitoring water temperature during the winter was successful. The winter time series clearly show striking differences in the thermal regime of the regulated vs. unregulated reaches of the Fourchue River.
It is anticipated that an additional four rivers will be monitored during the ice-free season of 2012. Thermal indices during the spring will be calculated on the Fourchue River to complete summertime indices. In addition to the Fourchue River, water temperature on a second pair of rivers will be monitored during the winter of 2012-2011. Thermal indices will be calculated on all time series. Prior to making a final selection on a limited number of indices to be used to compare impounded and natural rivers, the initial list of indices will be expanded to include a characterization of event frequency and duration (e.g. number of consecutive days above biologically relevant thresholds). The choice of indices will be completed using a combination of multivariate approaches (e.g. Daigle et al., 2011) and enthropy measures (Yoo et al., 2011)
5.0 REFERENCES
DAIGLE, A., A. ST-HILAIRE, D. BEVERIDGE, D. CAISSIE, L. BENYAHYA. 2011. Multivariate analysis of low flow regimes in eastern Canadian rivers. Hydrological
Sciences Journal 56(1):51-67.
YOO, CHULSANG; KU HYEJIN, K. KEEWOOK. 2011. Use of a Distance Measure for the Comparison of Unit Hydrographs: Application to the Stream Gauge Network Optimization. Journal of Hydrologic Engineering, 198.73.162.9: 880-890.
6.0 APPENDIX: THERMAL INDICES
Batchawana-MagpieRiver FlowRegime SerialNum Mean 07 Mean 08 Mean 09 Max07‐ 08 Date_max07‐08 SD07 SD08 SD09 Max_range07‐ 08 Date_max_rangen07‐ 08 Degr‐days07‐ 08 Batchawana NR 2368437 21.82 20.22 ‐‐ 27.08 2011‐07‐18 17:30 1.89 2.18 ‐‐ 5.72 2011‐08‐15 1061.40 Batchawana NR 2368441 22.11 20.48 15.71 27.47 2011‐07‐18 19:00 1.88 2.09 2.65 5.48 2011‐08‐04 1105.65 Batchawana NR 2368444 21.98 20.33 15.60 27.08 2011‐07‐18 18:30 1.87 2.07 2.67 5.54 2011‐07‐15 1097.77 Batchawana NR 2368447 22.10 20.50 15.73 27.47 2011‐07‐18 18:15 1.90 2.13 2.73 5.67 2011‐08‐04 1106.82 Batchawana NR 2368450 21.95 20.30 15.55 27.27 2011‐07‐18 18:30 1.87 2.10 2.64 5.47 2911‐08‐04 1095.24
Batchawana NR 2368464 21.92 20.24 nan 27.17 2011‐07‐18 18:00 1.83 2.17 nan 5.91 2011‐08‐15 1079.71
Batchawana NR 2368466 22.06 20.42 15.68 27.17 2011‐07‐18 18:30 1.87 2.08 2.66 5.55 2011‐07‐15 1102.68
Batchawana NR 9742670 21.97 20.31 15.57 27.08 2011‐07‐18 18:30 1.87 2.08 2.66 5.45 2011‐07‐15 1100.42
Batchawana NR 9742675 22.13 20.54 15.79 27.47 2011‐07‐18 18:00 1.91 2.12 2.71 5.58 2011‐08‐04 1109.83
Batchawana NR 9742682 21.98 20.30 nan 27.27 2011‐07‐18 18:00 1.83 2.16 nan 5.91 2011‐08‐15 1083.66
Batchawana NR 9742683 22.07 20.42 nan 27.37 2011‐07‐18 17:00 1.89 2.20 nan 6.10 2011‐08‐15 1091.12
Batchawana NR 9742708 21.91 20.23 nan 27.08 2011‐07‐18 17:30 1.81 2.15 nan 5.82 2011‐08‐15 1080.15
Magpie R 2368430 18.95 20.09 nan 22.81 2011‐08‐08 17:30 1.47 1.05 nan 3.81 2011‐08‐01 1105.50
Magpie R 2368433 18.76 19.74 nan 22.72 2011‐08‐08 17:30 1.47 1.13 nan 4.09 2011‐08‐01 1082.35
Magpie R 2368434 18.85 19.49 nan 23.68 2011‐07‐30 17:15 1.63 1.48 nan 5.92 2011‐07‐30 1060.34
Magpie R 2368436 18.30 18.78 nan 23.77 2011‐08‐07 20:00 2.05 2.06 nan 8.40 2011‐08‐28 986.08
Magpie R 2368440 19.01 19.64 nan 24.74 2011‐07‐30 15:30 1.69 1.54 nan 6.88 2011‐07‐30 1068.42
Magpie R 2368442 18.92 20.07 nan 24.26 2011‐08‐08 18:00 1.54 1.22 nan 5.81 2011‐09‐26 1108.70
Magpie R 2368449 18.73 19.86 nan 22.91 2011‐08‐07 17:45 1.48 1.12 nan 4.47 2011‐08‐01 1092.11
Magpie R 9742677 18.68 19.65 nan 22.72 2011‐08‐08 17:30 1.52 1.15 nan 6.50 2911‐09‐17 1072.26
Magpie R 9742678 18.72 19.75 nan 22.62 2011‐08‐08 17:30 1.49 1.11 nan 4.00 2011‐08‐01 1084.51
Magpie R 9742688 18.89 19.55 nan 23.68 2011‐07‐30 17:30 1.64 1.49 nan 5.92 2011‐07‐30 1066.02
Magpie R 9742696 19.00 19.99 nan 23.29 2011‐08‐08 18:00 1.53 1.28 nan 4.68 2011‐09‐17 1090.85
Magpie R 9742701 18.85 19.49 nan 23.68 2011‐07‐30 17:30 1.62 1.48 nan 5.92 2011‐07‐30 1060.71
Magpie R 9742706 18.94 20.02 nan 22.91 2011‐08‐08 17:15 1.52 1.18 nan 4.00 2011‐08‐01 1101.24
Magpie R 9742711 18.71 19.63 nan 24.45 2011‐07‐30 16:00 1.64 1.29 nan 6.31 2011‐07‐30 1078.62
Aubinadong-Nississagi
River FlowRegime SerialNum Mean07 Mean08 Mean09
Max07‐
09 Date_max07‐09 SD07 SD08 SD09 Max_range07‐09 Date_max_range07‐09 Degays07‐09
Aubinadong NR 2368453 22.35 20.41 15.51 26.88 2011‐07‐21 1.64 2.11 2.85 5.713 2011‐08‐23 1790.63 Aubinadong NR 2368427 22.41 20.49 15.54 27.37 2011‐08‐05 1.67 2.21 2.86 6.496 2011‐08‐15 1795.84 Aubinadong NR 2368448 22.39 20.56 15.66 26.39 2011‐07‐21 1.56 1.97 2.92 5.714 2011‐09‐09 1801.02 Aubinadong NR 2368462 22.42 20.46 15.26 26.68 2011‐07‐21 1.61 2.13 2.88 8.584 2011‐09‐17 1786.84 Aubinadong NR 2368465 22.40 20.42 15.55 27.08 2011‐07‐21 1.66 2.11 2.90 6.108 2011‐08‐15 1793.52 Aubinadong NR 2368473 22.21 20.30 15.42 26.68 2011‐07‐21 1.63 2.07 2.86 5.723 2011‐08‐15 1779.79 Aubinadong NR 2405508 22.50 20.62 15.72 26.59 2011‐08‐05 1.58 2.09 2.88 5.81 2011‐08‐23 1808.03 Aubinadong NR 2405513 22.46 20.64 15.73 26.59 2011‐07‐21 1.56 1.94 2.89 5.522 2011‐09‐09 1807.71 Aubinadong NR 9742671 22.44 20.45 15.56 26.98 2011‐07‐21 1.62 2.11 2.84 5.713 2011‐08‐23 1796.10 Aubinadong NR 9742672 22.48 20.68 15.78 26.39 2011‐07‐21 1.55 1.94 2.89 5.525 2011‐09‐08 1810.85 Aubinadong NR 9742674 22.55 20.67 15.76 26.49 2011‐07‐21 1.57 2.06 2.88 5.618 2011‐08‐23 1812.17 Aubinadong NR 9742676 22.64 20.83 16.03 26.98 2011‐07‐21 1.61 1.99 2.98 6.192 2011‐09‐08 1828.17 Aubinadong NR 9742681 22.41 20.49 15.59 26.78 2011‐07‐21 1.61 2.05 2.86 5.629 2011‐08‐15 1797.47 Aubinadong NR 9742685 ‐‐ 20.69 15.79 ‐‐ ‐‐ ‐‐ 1.94 2.88 ‐‐ ‐‐ ‐‐ Aubinadong NR 9742686 22.60 20.81 15.89 26.59 2011‐07‐21 1.55 1.92 2.88 5.522 2011‐09‐09 1822.31 Aubinadong NR 9742692 22.55 20.69 15.76 26.88 2011‐08‐05 1.62 2.12 2.92 6.192 2011‐08‐23 1813.00 Aubinadong NR 9742699 22.69 20.67 15.84 28.06 2011‐07‐21 1.78 2.16 2.97 6.398 2011‐08‐15 1818.93 Mississagi R 2368432 ‐‐ ‐‐ ‐‐ ‐‐ ‐‐ ‐‐ ‐‐ ‐‐ ‐‐ ‐‐ ‐‐ Mississagi R 2368445 19.96 21.00 18.08 23.00 2011‐08‐05 1.27 0.75 1.55 3.521 2011‐07‐04 1812.34 Mississagi R 2368446 19.69 21.07 18.33 22.53 2011‐08‐0 1.39 0.54 1.46 2.951 2011‐07‐10 1813.36 Mississagi R 2368451 20.02 21.34 18.49 22.81 2011‐08‐05 1.37 0.57 1.49 2.854 2011‐07‐09 1836.76 Mississagi R 2368460 ‐‐ 20.69 15.79 ‐‐ ‐‐ ‐‐ 1.94 2.88 ‐‐ ‐‐ ‐‐ Mississagi R 2368474 ‐‐ ‐‐ ‐‐ ‐‐ ‐‐ ‐‐ ‐‐ ‐‐ ‐‐ ‐‐ ‐‐
Mississagi R 2358476 ‐‐ ‐‐ ‐‐ ‐‐ ‐‐ ‐‐ ‐‐ ‐‐ ‐‐ ‐‐ ‐‐ Mississagi R 9742668 19.97 21.25 18.39 22.91 2011‐08‐05 1.36 0.59 1.49 2.854 2011‐07‐09 1829.20 Mississagi R 9742673 20.26 21.33 18.30 24.93 2011‐07‐31 1.27 0.69 1.55 3.84 2011‐07‐31 1838.00 Mississagi R 9742679 20.09 21.36 18.52 23.39 2011‐08‐05 1.30 0.56 1.49 3.72 2011‐07‐10 1840.77 Mississagi R 9742687 20.25 21.39 18.45 23.68 2011‐08‐05 1.23 0.60 1.52 3.998 2011‐09‐24 1844.05 Mississagi R 9742693 19.97 21.29 18.49 23.10 2011‐08‐05 1.37 0.57 1.47 2.854 2011‐07‐09 1833.70 Mississagi R 9742703 ‐‐ ‐‐ ‐‐ ‐‐ ‐‐ ‐‐ ‐‐ ‐‐ ‐‐ ‐‐ ‐‐ Mississagi R 9742704 20.12 21.36 18.52 23.58 2011‐08‐05 1.32 0.57 1.49 4.576 2011‐07‐08 1841.39 Mississagi R 9742705 ‐‐ ‐‐ ‐‐ ‐‐ ‐‐ ‐‐ ‐‐ ‐‐ ‐‐ ‐‐ ‐‐ Mississagi R 9742707 ‐‐ ‐‐ ‐‐ ‐‐ ‐‐ ‐‐ ‐‐ ‐‐ ‐‐ ‐‐ ‐‐ Mississagi R 9742710 20.02 21.10 18.20 23.29 2011‐08‐05 1.26 0.71 1.53 3.336 2011‐07‐12 1820.46
Twilick-West Salmon
River FlowRegime SerialNum Mean08 Max08 Date_max08 SD08 Max_range08 Date_max_range08 Degdays08
Twilick Brook NR 9916681 18,97 26,097 2011‐08‐22 2,296 6,868 2011‐08‐19 588,1318 Twilick Brook NR 9916682 18,86 25,513 2011‐08‐22 2,258 6,387 2011‐08‐19 584,7828 Twilick Brook NR 9916694 18,83 25,513 2011‐08‐22 2,265 6,482 2011‐08‐19 583,7251 Twilick Brook NR 9916695 18,94 25,805 2011‐08‐22 2,282 6,675 2011‐08‐19 587,2512 Twilick Brook NR 9916708 18,88 25,708 2011‐08‐22 2,276 6,483 2011‐08‐19 585,3491 Twilick Brook NR 9916709 18,81 25,319 2011‐08‐22 2,230 6,386 2011‐08‐19 583,2269 Twilick Brook NR 9916710 18,91 25,708 2011‐08‐22 2,278 6,579 2011‐08‐19 586,2434 Twilick Brook NR 9916720 18,91 25,805 2011‐08‐22 2,288 6,579 2011‐08‐19 586,0638 West Salmon R 9916668 17,89 20,043 2011‐08‐21 1,039 1,523 2011‐08‐13 554,6787 West Salmon R 9916669 17,95 20,043 2011‐08‐21 1,039 1,427 2011‐08‐13 556,3941 West Salmon R 9916683 17,90 20,043 2011‐08‐21 1,041 1,523 2011‐08‐13 555,0099 West Salmon R 9916684 18,00 20,329 2011‐08‐21 1,060 1,809 2011‐08‐13 557,8826 West Salmon R 9916697 18,10 20,805 2011‐08‐21 1,111 2,379 2011‐08‐13 561,1935 West Salmon R 9916707 17,93 20,138 2011‐08‐21 1,045 1,618 2011‐08‐13 555,8992 West Salmon R 9916719 17,98 20,519 2011‐08‐21 1,098 2,189 2011‐08‐13 557,4866
Petit-Saguenay-St-Jean
River FlowRegime SerialNum Mean07 Mean08 Mean09
Max07‐ 09 Date_max SD07 SD08 SD09 Max_range07‐ 09 Date_max_range07‐ 09 Deg‐days07‐09 Petite Saguenay NR 2368456 20.11 17.97 14.67 24.35 2011‐07‐18 1.74 1.79 1.94 4.292 2011‐08‐06 1620.58 Petite Saguenay NR 2368637 20.06 18.07 14.70 24.16 2011‐07‐18 1.64 1.76 1.93 3.913 2011‐08‐06 1623.01 Petite Saguenay NR 9742691 19.99 17.95 14.65 24.06 2011‐07‐18 1.66 1.75 1.93 4.101 2011‐08‐06 1615.48 Petite Saguenay NR 9916677 20.07 18.08 14.72 24.06 2011‐07‐18 1.63 1.74 1.90 3.912 2011‐08‐06 1624.38 Petite Saguenay NR 9916689 20.27 18.17 15.07 24.55 2011‐07‐18 1.69 1.78 2.01 4.576 2011‐09‐27 1643.97 Petite Saguenay NR 9916690 15.61 15.80 ‐‐ ‐‐ ‐‐ 1.33 0.94 ‐‐ ‐‐ ‐‐ ‐‐ Petite Saguenay NR 9916705 20.09 18.09 14.73 24.16 2011‐07‐18 1.63 1.75 1.92 4.008 2011‐08‐06 1625.5206 St‐Jean R 9742694 18.98 17.72 ‐‐ ‐‐ ‐‐ 1.52 1.26 ‐‐ ‐‐ ‐‐ ‐‐ St‐Jean R 9916675 18.87 17.30 14.06 22.91 2011‐07‐18 1.48 1.59 1.64 4.006 2011‐07‐16 1543.04 St‐Jean R 9916678 18.89 17.30 14.06 23.10 2011‐07‐18 1.50 1.60 1.65 4.197 2011‐07‐16 1543.57 St‐Jean R 9916702 18.96 17.31 14.04 22.53 2011‐07‐18 1.53 1.63 1.62 3.713 2011‐07‐28 1545.96 St‐Jean R 9916704 19.07 17.39 14.12 22.62 2011‐07‐18 1.51 1.63 1.61 3.617 2011‐07‐28 1553.98