Science Arts & Métiers (SAM)
is an open access repository that collects the work of Arts et Métiers Institute of
Technology researchers and makes it freely available over the web where possible.
This is an author-deposited version published in:
https://sam.ensam.eu
Handle ID: .
http://hdl.handle.net/10985/12050
To cite this version :
Tristan RÉGNIER, Guillaume FROMENTIN, José OUTEIRO, Bertrand MARCON, Alain
D'ACUNTO, Arnaud CROLET - Experimental Investigation and Modelling of Burr Formation
during Orthogonal Cutting of A356+0.5Cu Aluminium Alloy - In: XIII International Conference on
High Speed Machining (HSM), France, 2016-10-04 - XIII International Conference on High Speed
Machining (HSM) - 2016
Any correspondence concerning this service should be sent to the repository
Administrator :
archiveouverte@ensam.eu
Experimental Investigation and Modelling of Burr Formation during Orthogonal Cutting
of A356+0.5Cu Aluminium Alloy
T. Régnier1, G. Fromentin1, J. Outeiro1, B. Marcon1, A. D’acunto2, A.Crolet3 1LaBoMaP – Arts et Métiers ParisTech, Cluny, France
2LEM3 – Arts et Métiers ParisTech, Metz, France 3Montupet / Linamar, Laigneville, France
Abstract
Burr formation during parts manufacturing is a significant problem that companies try to minimise or eliminate. The present work aims to study the burr formation mechanisms in a cast aluminium alloy. Orthogonal cutting tests are performed using different uncut chip thicknesses and tool rake angles. To analyse burr formation mechanisms, the work material state of stress and triaxiality distribution in the chip root was investigated via numerical simulations. Results show that the uncut chip thickness has an effect on burr morphology and burr cumulation while tool rake angle influences burr height on high uncut chip thicknesses.
Keywords:
Burr formation mechanisms, Orthogonal cutting, Aluminium alloy
1 INTRODUCTION
A burr is defined by ISO 13715 [1], as a “rough remainder of material outside the ideal geometrical shape of an external edge, residue of machining or of a forming process”. Because of their sharpness and their ability to deteriorate mechanical systems, burrs must be avoided. However, burr formation during machining is an inevitable phenomenon. Because deburring processes are time-consuming, companies are constantly trying to minimise burrs occurrence; therefore it is preferable to reduce burr formation during the machining process. To quantify a burr dimension, different criteria exist. Schafer [2], introduces a burr value g, which is the result of different parameters combined such as burr height, burr thickness, burr root radius and burr root thickness. This method, employing a destructive characterisation, implies average values of every parameter to be determined on several cross sections of a burr. Another method, described by the norm ISO 13715 [1], consists of measuring the burr height from the theoretical exit edge of a workpiece.
The difference in burr morphology on brittle or ductile workpiece material is studied by Hashimura et al. [3]. Their experimental and numerical study during orthogonal cutting shows that two kind of burrs might appear. During ductile material cutting, “positive” burrs are produced. This kind of burrs is similar to an uncut piece of material stuck at the exit edge of the workpiece. On the other hand, a brittle material cutting exhibits another type of burrs, known as “negative” burrs, which appear like chamfers with small break out growth.
A few studies investigate the burr height cumulation from one pass to the other. This phenomenon occurs when the burr root thickness is greater than the uncut chip thickness used for the next pass, causing a much higher burr. Hashimura et al. [4], are the first to show such phenomenon during their experimental study on copper. A study regarding the burr height cumulation is also conducted during milling of stainless steel by Da Silva et al. [5], who demonstrate that the burr height increases if no deburring is performed between each pass.
To understand these phenomena, several analytical studies are conducted using different methods. Ko and
Dornfeld [6], use their experiments in orthogonal cutting of plasticine to provide several hypothesis for the model. They split the burr formation process into three steps: burr initiation, its development and its formation. They observe the occurrence of negative burrs as well as positive ones in ductile materials. Toropov and Ko [7], use the slip-line theory to predict burr height and thickness during orthogonal cutting of ductile materials. However, no negative burr has been encountered during the experimental verifications on copper, which is due to low uncut chip thickness.
Gillespie [8], is the first to study burr formations during milling. He discovers that, different types of burr are developed from different edges produced from various types of milling. However, the study does not take into account the difference between the entrance and exit of the teeth of the cutting tool when the mill begins and ends the cut. In fact, Bourlet [9], shows that as the cutting velocity is higher than the feed rate, teeth enter and exit the workpiece from the start of the cut, hence the burrs become entrance burrs on one side of the mill and exit burrs on the other. The influence of the cutting parameters on burr height is investigated by several papers. Olvera and Barrow [10], focus on the depth of cut effect during side milling. They observe a transition depth of cut at which bottom burrs height highly decreases. The burrs morphology is different as well, whereby burrs change from long and thin known as primary burrs, to short and thick, named secondary burrs. These observations are confirmed by Chern [11], during face milling of Aluminium alloys. The transition depth of cut is evaluated with respect to different in-plane exit angles. The paper shows that the increase of the in-plane exit angle causes a deeper transition cut.
Up until now, the majority of the papers investigating the influence of cutting parameters and analysing the cumulative burr phenomenon is conducted using milling as the cutting process. Nevertheless, milling is a geometrically complex operation.
This paper aims thus to study the mechanisms of positive and negative burrs formation, in situ, using a high speed camera during orthogonal cutting tests. The burrs cumulation from one pass to another is also investigated to
comprehend the phenomenon. Uncut chip thickness and rake angle will vary to analyse their influence on burr morphology and cumulation.
2 EXPERIMENTAL PROCEDURE 2.1 Experimental procedure
The orthogonal cutting tests are conducted in a 3 axis CNC machine DMG DMC85V. The X axis of the machine provides the cutting velocity, set at 120 m/min. To analyse burr formation, a high speed CCD camera (PHOTRON SA - Z), shown in Figure 1, is used. For this study, the camera films the end of the cut with a frame rate of 50,400 fps. A magnification is performed by a x10 Mitutoyo objective together with lens tubes to reach an observation window of approximately 1.5 × 1.5 mm².
Figure 1: Experimental setup.
Before each test, a coarse surfacing is performed for the entire surface of the sample. After this operation, one pass is considered done, followed by a sample scan with a 3D scan based on focal variation method (Alicona SL). The sequence, as represented in Figure 2, is repeated 5 times for each test. To measure burr height, the ISO 13715 [1] norm procedure, described in the introduction, is employed.
Figure 2: Tests procedure.
2.2 Tool data, work material and cutting conditions Two uncoated tungsten carbide tools (WC) are used during the experiments. The tools properties and input variables used during the experiment are listed in Table 1.
PARAMETERS VALUES
Tool material Uncoated tungsten carbide (WC) Cutting velocity (Vc) 120 m/min Uncut chip thickness (h) 0.01 mm to 0.20 mm
Cut width (b) 4 mm
Rake angle (γ) -5° ; 7° Clearance angle (α) 5° Edge sharpness (rβ) 5 μm (for γ = 7°)
12 μm (for γ = -5°) Table 1: Material / tool properties and cutting conditions.
The studied workpiece material is a cast aluminium alloy A356+0.5Cu with a T6 heat treatment with chemical composition as followed: 6.5 – 7.5% Si; 0.19% Fe; 0.5% Cu; 0.1% Mn; 0.25 – 0.45% Mg; 0.07% Zn; 0.25% Ti; 0.1% other, after NF EN 1706 [12]. This material exhibits a ductile behaviour in compression and a brittle one in tension, due to the relatively large amount of Silicon. The workpiece material properties are listed below in Table 2.
PROPERTY VALUE
(average [min ; max]) Work material A356 – T6 + 0.5% Cu
Density 2.66 g/cm3
Young Modulus 78.5 [74.2 ; 82.6] GPa Elongation at break 2.1 [0.9 ; 3.9] % Tensile Yield strength 250.3 [243.9 ; 257.2] MPa
Tensile Maximum
strength 295.6 [276.5 ; 317.1] MPa
Poisson ratio 0.33
Table 2: Material properties.
3 EXPERIMENTAL RESULTS AND ANALYSIS 3.1 Influence of uncut chip thickness on burr
formation
The first investigation was conducted on the influence of the depth of cut on burr height. Figure 3 shows the result of the tests.
Figure 3: Burr height with respect to uncut chip thickness. At a certain uncut chip thickness, named htr, the burr height
is noticed to have decreased considerably. This can be seen from the pictures taken with the high speed camera in Figure 4. For the 7° rake angle, the transition htr occurs
when the uncut chip thickness reaches between 0.03 mm and 0.05 mm during the first two passes. After two passes, the transition occurs between 0.05 mm and 0.1 mm. As for the -5° rake angle, the transition occurs constantly between 0.05 mm and 0.10 mm.
The figure shows that the burr formation is different for low h and high h. If the uncut chip thickness is lower than htr,
the burr is formed by the tilting of a small amount of the chip, the burr is therefore a rollover burr; else if the uncut chip thickness is higher than htr, a crack appears along a
new shear zone. The propagation of the crack creates a negative burr, i.e. a chamfer with a break out growth, similar to a tearing burr. Such burrs according to Hashimura et al. [3] is due to a brittle behaviour of the material.
0 20 40 60 80 100 120 140 0 0.05 0.1 0.15 0.2 0.25 Bh ( μ m) h (mm) γ = -5°
h
tr Tool Camera Sample VcFigure 4: Burr formation for (a): (h = 0.03 mm, γ = 7°) and (b): (h = 0.1 mm, γ = 7°).
This difference of behaviour might be due to the relatively high cutting edges radii of the tools compared to the uncut chip thickness, when the latter is low. As a result, micro-cutting conditions are preponderant, engendering more plastic deformation through ploughing effect, which in turn create a higher burr.
3.2 Influence of rake angle on burr height
The influence of tool geometry has been investigated through the rake angle of the tools. The result, represented in Figure 5, shows that before htr, the negative rake angle
exhibits slightly higher burrs. This small difference might be due to the higher dimension of the -5° rake angle tool’s cutting edge radius, causing a higher ploughing effect as explained in chapter 3.1. However, the behaviour is quite similar. After htr, the burr height increases for a positive
rake angle whereas it seems more stable for a negative one.
Figure 5: Difference of burr height with respect to uncut chip thickness for two rake angles.
This difference might be due to a higher ratio between the cutting force (Fc) and the normal one (Fp) for the 7° rake
angle, compared to the -5° one. As a result, the angle between the resultant force (Fr) and the cutting direction
(ε), represented in Figure 6, is lower, tearing the burr more along the cutting direction.
Figure 6: Influence of rake angle on resultant angle.
3.3 Analysis of burr cumulation from one pass to another
One of the major problems concerning burr formation is burr growth from one pass to another, also known as burr cumulation. This phenomenon occurs frequently during industrial machining processes, for example, during rollover side burrs formation in shoulder milling. The aim of this part is to analyse the burr cumulation behaviour during the cut.
Figure 7: Burr height with respect to the number of passes (h = 0.03 mm).
Figure 7 presents the burr height increase from one pass to another. For a rake angle of -5°, the burr growth seems to stabilise after 4 passes. Figure 8 shows that the burr starts to roll over itself after 3 passes, showing the consistency of burr height. The formed burr morphology is similar to the rollover burrs encountered during shoulder milling.
Figure 8: Highlight of the burr cumulation after every pass (h = 0.03 mm, γ = 7°).
A new parameter can help to enlighten this phenomenon: the burr length. It consists of measuring the perimeter of the spiral. However, this measure implies destructive method if an average value all along the width of the sample is 0 20 40 60 80 100 120 140 0 0.05 0.1 0.15 0.2 0.25 B h ( μ m) h (mm) γ = -5° γ = 7°
h
tr 0 10 20 30 40 50 0 0.05 0.1 0.15 0.2 0.25 R es u ltan t an gl e (° )Uncut chip thickness (mm) γ = -5° γ = 7° 0 50 100 150 200 0 1 2 3 4 5 6 Bh (μ m) Pass number γ = -5° γ = 7° 40 μs 80 μs 0 μs (a) (b) h h Vc Vc P1 P2 P4 P5 Bh Bh Bh Bh B h P3
expected. Here the value is only taken on pictures provided by the camera. Results are shown in Figure 9.
Figure 9: Evolution of burr length with respect to the pass number.
When h is higher than htr, different circumstances may
happen, as shown in Figure 10. If h is higher than the height of the chamfer formed, a new negative burr is formed. If h is lower than the height of the chamfer, the cut will reduce this height without forming a new burr.
Figure 10: Highlight of the absence of burr cumulation during 5 passes (h = 0.10 mm, γ = 7°).
The different circumstances of burr formation encountered during the cut are summarised in Figure 11.However, the second case for positive burrs has not been encountered during the study and is just a hypothesis.
Figure 11: Different configurations of burr formation from one pass to another.
4 MODELLING APPROACH AND RESULTS 4.1 Modelling approach and parameters
To further comprehend the negative burr formation behaviour, a modelling study is carried out. Firstly, the
result of the simulation is compared to the experimental one. It is followed by the analysis of the state of stress and of the stress triaxiality distribution during burr formation. An implicit FEM software using Lagrangian-mesh method with adaptative remeshing SFTC DEFORM v11.1 is used in this study. The boundary conditions, seen in Figure 12, are implemented in the model.
Figure 12: Model boundary conditions.
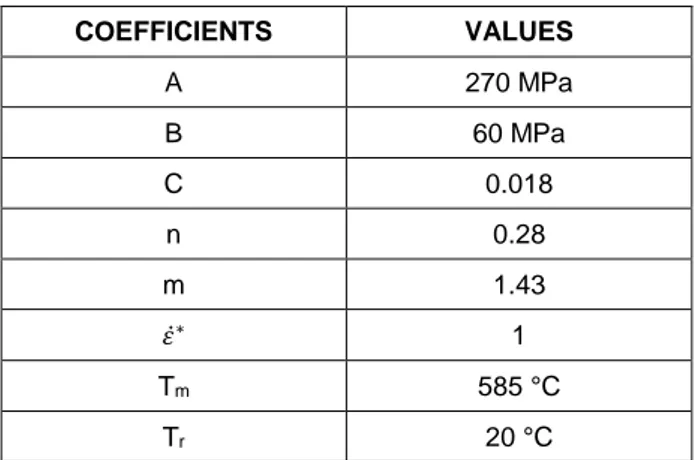
On the workpiece, three different elements sizes are defined with respect to the cutting zone and the number of Q4 elements is set as 4000. For the cutting tool, two zones are defined, and the number of Q4 elements is also set as 4000. The cutting condition tested is h = 0.1 mm for γ = 7°. The friction coefficient has been set as 0.729 (Coulomb), estimated by Faverjon et al. [13] for friction between a tungsten carbide pin and an A324.0 aluminium alloy tube. Such estimation is considered to be similar to our studied material, at 120 m/min. Moreover, a hypothesis that the friction coefficient does not change significantly between cutting process and burr formation has been made. A Johnson-Cook plasticity law has been implemented. The coefficients defined for an A356 alloy in the law, are retrieved from Gupta et al. [14], which are represented in Table 3. COEFFICIENTS VALUES A 270 MPa B 60 MPa C 0.018 n 0.28 m 1.43 𝜀̇∗ 1 Tm 585 °C Tr 20 °C
Table 3: Johnson - Cook plasticity coefficients for an A356 alloy material.
To simulate chip and burr formation, a damage evolution model has been implemented according to Zhang et al. [15] method, who use Hillerborg’s fracture energy. The evolution of plastic strain at failure with respect to stress triaxiality is analysed using a Rice and Tracy model with coefficients based on Mae et al. [16] results. The coefficients of the damage evolution and the plastic strain at failure models are shown in Table 4.
0 50 100 150 200 250 0 1 2 3 4 5 6 Bu rr le n gth (µm ) Pass number γ = 7° γ = -5° P1 P2 P3 P4 P5 Bh Bh Bh Bh Bh h > htr Negative burr h < htr Positive burr
COEFFICIENTS VALUES
Kc 24 MPa/m0.5
D0 0.155
D1 0.443 [15]
D2 -2.281 [15]
Table 4: Coefficients for damage evolution model and plastic strain at failure model.
4.2 Comparison between predicted and measured results
The burr height and morphology simulated are compared to the experimental one. The result of the simulation is presented in Figure 13.
Figure 13: Value of simulated burr height (h = 0.1 mm, γ = 7°).
The figure shows that a negative burr is obtained, which fits well with experimental results. However, the burr height simulated (16.4 μm) is twice lower than the experimental one (30.1 μm). This difference might be due to the high heterogeneity of the material, which has not been taken yet into account with this kind of models.
5 BURR FORMATION ANALYSIS
The effective stress distribution during burr formation is shown in Figure 14.
Figure 14: State of effective stress simulated during burr formation.
The simulation shows that the stress is concentrated along a curved negative shear zone which resembles the chamfer formed at the end of the cut.
The stress triaxiality in the material influences highly the plastic strain at failure of a material. The stress triaxiality close to the cut, during burr formation, is shown in Figure 15.
Figure 15: Stress triaxiality distribution during burr formation.
As the Figure 15 shows, close to the cutting edge, the triaxiality is positive and close to 1, around this zone, the triaxiality is contained between 0 and 1. It means that the zone is under traction and shearing, conditions where the plastic strain at failure is minimum. Meanwhile, the triaxiality close to the exit surface of the workpiece is negative, and even equal to -1 at the burr root, synonym of compression, where the plastic strain at failure is maximum.
These observations correlates with high speed camera observations and the schematic illustration of Hashimura et al. [3], for brittle materials. Due to the low plastic strain at failure close to the cutting edge, a crack can initiate as a direct consequence of the cut and grows until it reaches the compression zone. At this step, the compression creates an important plastic strain creating the burr.
6 CONCLUSIONS AND DISCUSSIONS
This paper provides investigations on burr formation during orthogonal cutting of A356+0.5Cu Aluminium alloy. Observations with high speed camera help to visualise the formation during the cut.
Uncut chip thickness and tool rake angle effects are analysed. The experimental results are then compared to those obtained during the simulation.
The main conclusions regarding experimental investigation are listed below:
- The uncut chip thickness influences mainly burr height
- A transition uncut chip thickness, htr, is defined
which represents the transition between positive and negative burr formation
- The tool rake angle slightly influences burr height and the value of htr
- Burr cumulation is highlighted for positive burr, i.e. under htr
- A model of burr formation configuration regarding precedent pass of the tool is proposed
The simulation results help to understand negative burr formation behaviour. The burr height is underestimated but the morphology is coherent regarding experimental results. The state of stress and stress triaxiality distribution analyses from the simulation and the observations on the high speed camera pictures during the bur formation help to understand how the chamfer is generated. When the tool approaches the end of the cut, the appearance of a traction zone close to the cutting edge and of a compression one close to the exit side of the workpiece causes the crack initiation and its growth. As the cut continues, so is the growth of the crack, leading to the creation of a chamfer at the end of the cut.
A more complete numerical study should be carried out, using better flow stress, damage and mesh models. The influence of the microstructure will be taken into account. Last but not least, the same study will be undergone during interrupted orthogonal disk cutting with higher cutting velocity (around 2000 m/min) and PCD tools. These conditions represent closely to an industrial process. 7 REFERENCES
[1] NF ISO 13715, 2000, Technical drawings - Edges of undefined shape - Vocabulary and indication on drawings.
[2] Schafer, F., 1975, Product design influences on deburring, Society of Manufacturing Engineers.
[3] Hashimura, M., Chang, Y.-P., Dornfeld, D. A., 1999, Analysis of burr formation mechanism in orthogonal cutting, Journal of Manufacturing Science and Engineering, Transactions of the ASME, 121/1:1-7. [4] Hashimura, M., Hassamontr, J., Dornfeld, D. A., 1999, Effect of in-plane exit angle and rake angles on burr height and thickness in face milling operation, Journal of Manufacturing Science and Engineering, Transactions of the ASME, 121/1:13-19.
[5] Carlos da Silva, L., Rosa da Mota, P., Bacci da Silva, M., Okechukwu Ezugwu, E., Rocha Machado, A., 2015, Study of burr height in face milling of PH 13-8 Mo stainless steel– Transition from primary to secondary burr and benefits of deburring between passes., CIRP Journal of Manufacturing Science and Technology, 319.
[6] Ko, S.-L., Dornfeld, D. A., 1991, A study on burr formation mechanism, Journal of Engineering Materials and Technology, 113.
[7] Toropov, A. A., Ko, S.-L., 2006, A new burr formation model for orthogonal cutting of ductile materials, Annals of the CIRP, 55/1.
[8] Gillespie, L. K., 1973, The Formation and Properties of Machining Burrs, PhD thesis, Utah State Univ. [9] Bourlet, C., Fromentin, G., Harika, E., Crolet, A., 2016, Analysis and Modeling of Burr Formation During the Plane Milling of Cast Aluminum Alloy Using Polycrystalline Diamond Tools, J. Manuf. Sci. Eng, 138/8:081010 081010. [10] Olvera, O., Barrow, G., 1995, An experimental study of burr formation in square shoulder face milling, Int. J. Mach. Tools Manufact., 36/9:1005-1020.
[11] Chern, G.-L., 2006, Experimental observation and analysis of burr formation mechanisms in face milling of aluminum alloys, International Journal of Machine Tools and Manufacture, 46/12 /13:1517-1525.
[12] NF EN 1706, 2010, Aluminium and aluminium alloys - Castings - Chemical composition and mechanical properties.
[13] Faverjon, P., Rech, J., Leroy, R., 2013, Influence of Minimum Quantity Lubrication on Friction Coefficient and Work-Material Adhesion During Machining of Cast Aluminum With Various Cutting Tool Substrates Made of Polycrystalline Diamond, High Speed Steel, and Carbides, J. Tribol, 135/4.
[14] Gupta, S., Abotula, S., Shukla, A., 2014, Determination of Johnson–Cook Parameters for Cast Aluminum Alloys, J. Eng. Mater. Technol, 136/3.
[15] Zhang, Y. C., Mabrouki, T., Nelias, D., Gong, Y. D., 2011, Chip formation in orthogonal cutting considering interface limiting shear stress and damage evolution based on fracture energy approach, Finite Elements in Analysis and Design, 47/7:850 863.
[16] Mae, H., Teng, X., Bai, Y., Wierzbicki, T., 2009, Ductile fracture locus of AC4CH-T6 cast aluminium alloy, Archives of Computational Materials Science and Surface Engineering, 1/2:100-105.