Asymmetric Dependence Modeling and Implications for International
Diversification and Risk Management
par
Georges D. Tsafack K.
Département de sciences économiques Faculté des arts et des sciences
Thèse présentée à la Faculté des études supérieures en vue de l’obtention du grade de
Philosophiae Doctor (Ph.D.) en sciences économiques
Septembre 2007
o
de Montréal
Direction des bihIothèques
AVIS
L’auteur a autorisé l’Université de Montréal à reproduire et diffuser, en totalité ou en partie, pat quelque moyen que ce soit et suc quelque support que ce soit, et exclusivement à des fins non lucratives d’enseignement et de recherche, des copies de ce mémoire ou de cette thèse.
L’auteur et les coauteurs le cas échéant conservent la propriété du droit d’auteur et des droits moraux qui protègent ce document. Ni la thèse ou le mémoire, ni des extraits substantiels de ce document, ne doivent être imprimés ou autrement reproduits sans l’autorisation de l’auteur.
Afin de se conformer à la Loi canadienne sur la protection des
renseignements personnels, quelques formulaires secondaires, coordonnées ou signatures intégrées au texte ont pu être enlevés de ce document. Bien que cela ait pu affecter la pagination, il n’y a aucun contenu manquant. NOTICE
The author of this thesis or dissertation has granted a nonexclusive license allowing Université de Montréal to reproduce and publish the document, in part or in whole, and in any format, solely for noncommercial educational and research purposes.
The author and co-authors if applicable retain copyright ownership and moral rights in this document. Neither the whole thesis or dissertation, nor substantial extracts from it, may be printed or otherwise reproduced without the author’s permission.
In compliance with the Canadian Privacy Act some supporting forms, contact information or signatures may have been removed from the document. While this may affect the document page count, it does not represent any loss of content from the document.
Cette thèse intitulée:
Asymmetric Dependence Modeling and Implications for International
Diversification and
Risk
Management
présentée par Georges D. Tsafack K.
a été évaluée par un jury composé des personnes suivantes:
président -rapporteur drecteur de recherche
membre du jury examïnteur externe
‘.:.
représentant du doyen de la FES
Nous traitons dans cette thèse les problèmes de modélisation de la dépendance asymétrique et nonlinéaire avec ses implications sur le choix de portefeuille et la gestion de risque. L’asymétrie de la dépendance désigne un fait stylisé bien établi selon lequel les marchés sont plus corrélés dans les mauvais moments que dans les bons. Dans le premier chapitre nous proposons un nouveau modèle bien adapté à ce phénomène. Nous établissons ensuite un lien entre cette dépendance asymétrique et la coskewness et montrons comment elle peut expliquer la très faible diversification internationale observée et la grande tendance a investir dans les actifs moins risques par rapport à ce que le modèle moyenne-variance prévoit. Le chapitre 2 prouve que le fait d’ignorer cette asymétrie conduit à la sous-estimation du risque mesuré par la Valeur à Risque (VaR) ou par la Perte moyenne au-delà de la VaR. Le chapitre 3 restaure la crédibilité de la VaR comme mesure cohérente du risque dans un contexte pratique.1
Dans le premier Chapitre, nous examinons les problèmes liés à la modélisation du phénomène d’asymétrie de la dépendance selon lequel les rendements négatifs des actifs financiers sont plus dépendants que les rendements positifs. Premièrement, nous montrons analytiquement qu’un mod èle multivarié du type GARCH ou a changement de régime avec des innovations normales ne peut pas reproduire la dépendance extrême. Nous proposons un modèle alternatif qui permet de la dépendance pour les rendements négatifs tout en gardant l’indépendance pour les rendements posi tifs. Ce modèle est appliqué aux marchés d’actions et d’obligations internationaux pour analyser leur structure de dépendance. Il est constitué d’un état normal dans lequel la dépendance est symétrique et d’un état asymétrique. Les résultats empiriques suggèrent que la dépendance entre les actifs internationaux du même type est plus large dans les deux états tandis que la dépendance entre les actions et les obligations reste assez faible même dans le même pays. La volatilité du taux d’échange apparaît comme un facteur influant sur la dépendance extrême. Nous analysons ensuite dans le cadre de l’asymétrie, le problème de la faible diversification du portefeuille international encore appelé le « home bias puzzle ». Les explications principales de ce phénomènes reposent sur
‘Le premier chapitre de cette thèse a été écrit en collaboration avec René Garcia. Le troisième chapitre a été écrit en collaboration avec René Garcia et Eric Renault.
les deux premiers moments : les coûts de transactions affectent le rendement espéré pendant que le risque du taux de change et la corrélation entre actifs internationaux affectent la volatilité des
rendements. Ang et Bekaert (2002) utilisent un modèle avec changement d’état markovien pour analyser l’effet de la corrélation asymétrique sur la diversification internationale et concluent qu’il est assez faible. Nous proposons ici une explication basée sur le troisième moment est proposée en montrant qu’il est lié à l’asymétrie de la dépendance. Nous montrons aussi que la même intuition explique le « fiight to safety » le fait d’aller un peu plus que prévu vers les actifs moins risqués.
Le deuxième chapitre est consacré à l’analyse des implications de l’asymétrie de la dépendance
sur la gestion du risque extrême. Nous montrons qu’en présence de dépendance asymétrique, un modèle de portefeuille basé sur les modèles classiques de GARCH avec des innovations normales ou plus généralement symétrique conduit à une sous-estimation de la valeur à risque (VaR) du portefeuille de même que celle de la perte moyenne au-delà de la VaR. Ces mesures du risque ont tendance à croître dès lors que les rendement négatifs deviennent de plus en plus dépendants par rapportaux rendements positifs, les distributions marginales restants inchangées. Pour la précision dans l’estimation de ces mesures de risques extrêmes en situation de dépendance asymétrique, nous constatons de manière générale une supériorité de la copule de Gumbel qui prend en compte l’asymétrie observée dans la structure de dépendance.
Le but du troisième chapitre est de restaurer la crédibilité de la VaR comme mesure cohérente
du risque dans im contexte pratique. Artzner et al (1999) mettent en exergue l’absence de la sous-additivité de la VaR requise pour être une mesure cohérente du risque. L’idée clef dans ce chapitre est que si l’épaisseur des queues de distributions est responsable de la violation de la sous additivité, une utilisation appropriée de l’information conditionnelle pourrait rendre la VaR plus rationnelle pour la gestion décentralisée du risque. L’argumentation est triple. Premièrement, dès lors que les traders sont embauchés sur la base qu’ils possèdent sur leur segment de marché une information plus riche que le gestionnaire central, Ils doivent simplement respecter les contraintes prudentielles imposées par celui-ci pour que le contrôle de la VaR décentralisée fonctionne de façon cohérente. Deuxièmement, dans ce contexte de décentralisation, nous montrons que si le gestionnaire central a accès ex-post à la composition du portefeuille des traders individuels, il
pourra récupérer une bonne part de leur information privée. Cette composition du portefeuille peut être utilisée pour améliorer le backtesting dans le but de vérifier que la contrainte prudentielle a été respectée par les traders. Finalement, nous montrons que l’épaisseur exigée des queues pour violer la sous-additivité même pour les petits niveaux de probabilités, induit une situation tellement extrême qu’elle correspond à une information tellement faible que la perte espérée est infinie. Nous concluons dont que l’incohérence de la gestion décentralisée par la VaR caractérisée par l’absence de sous-additivité avec une information assez riche, est une exception et non une règle.
Mots clés: corrélation asymétrique, dépendance asymétrique, copule, dépendance des queues, GARCH, modèles à changement de régime, finance internationale, valeur à risque, « expected shortfall », DCC, mesures cohérente de risque, sous-additivité, distributions à queues épaisses, distributions stables.
Summary
We address in this dissertation the issue of asymmetric and nonlinear dependence modeling with its implications for international portfolio choice and risk management. We speak of asymmet rie dependence when downside market returns are more dependent than upside market returns, a well established stylized fact. In the first chapter, we propose a new multivariate model to capture this fact and establish the link between this asymmetric dependence and coskewness to demonstrate how it can explain the lack of international diversification, while chapter 2 shows that by ignor ing this asymmetry, one underestimates the risk measured with Value at Risk (VaR) or Expected Shortfall (ES). Chapter 3 restores the credihulity of VaR as a coherent risk measure in a practical context.
In the first chapter, we examine the problems associated with modeling the stylized fact that asset returns are more dependent in bear markets than in buli markets, called asymmetric depen dence. First, we analytically show that a multivariate GARCH or regime switching model with Gaussian innovations cannot reproduce extreme dependence. We propose an alternative model which allows tau dependence for lower returns and keeps tau independence for upper returns. This model is applied to international equity and bond markets to investigate their dependence structure. It includes one normal regime in which dependence is symmetric aiid a second regime characterized by asymmetric dependence. Empirical resuits suggest that the dependence between international markets in the same class of assets is large in both regimes, while equity and bond markets exhibit littie dependence, even in the same country. Exchange rate volatility appears to be related to asymmetric extreme dependence. We also use this model to analyze the lack of in ternational portfolio diversification known as the home bias puzzle. The previous explanations for this pheriomenon are relied on the first two moments: transaction costs affect the expected return, while exchange rate risk and correlation between international assets affect the voÏatility. Ang and Bekaert (2002) with a regime changing correlation investigate the effect of asymmetric correlation on international diversification and conclude that the costs of ignoring regimes are small. We pro pose an explanation based on the third moment and using a stochastic dominance argument, we prove its link with dependence asymmetry. Using the same framework, we show that asymmetric
dependence amplifies the investment in the bonds, while reducing the investment in equities. This
is another diversification phenomenon known as « ftight to safety ».
We analyze in the second chapter the implications of the asymmetric dependence on the mari agement of extreme risks. We show that in the presence of asymmetric dependence, a portfolio model based on a multivariate symmetric GARCH with Gaussian or Student-t innovations will lead to an underestimation of the portfolio value at risk (VaR) or expected shortfall. The latter will increase when negative returns become more dependent and positive returns less dependent, while the marginal distributions are left unchanged. In fact, we show that the strong dependence for Iow returns increases the downside risk and this additional risk cannot be captured by the Gaussian distribution. By introducing lower tau dependence, the Student-t distribution corrects this shortcoming of the Gaussian distribution. However, the symmetric property of the Student-t means also the same dependence in the upper tail and this will reduce the downside risk. The risk model that takes into accoimt asymmetric dependence should allow lower tau dependence and upper tail independence as put forward by Longin and Solnik (2001). The Gumbel copula captures this asymmetry and shows superiority compared to Gaussian and student-t while combined with DCC in terms of accuracy of extreme risk measures.
The third chapter addresses the problem of credibility of VaR as a risk measure in a practical context. As stressed by Artzner et al. (1999), VaR may not possess the subadditivity property required to be a coherent measure of risk. The key idea of this chapter is that, when tau thickness
is responsible for violation of subadditivity, eliciting proper conditioning information may restore
a VaR rationale for decentralized risk management. The argument is threefold. First, since mdi
vidual traders are hired because they possess richer information on their specific market segment than senior management, they just have to follow consistently the prudential targets set by senior management to ensure that decentralized VaR control will work in a coherent way. Second, in this decentralization context, we show that if senior management lias access ex-post to the portfolio
shares of the individual traders, it amoiints to recovering some of their private information. These shares cari be used to improve backtesting in order to check that the prudential targets have been enforced by the traders. Finally, we stress that tau thickness required to violate subadditivity, even
for small probabilities, remains an extreme situation since it corresponds to such poor conditioning information that expected loss appears to be hifinite. We then conclude that lack of coherency of decentralized VaR management, that is VaR non-subadditivity at the richest level of information, should be an exception rather than a mie.
Key words: asymmetric correlation, asymmetric dependence, copula, tau dependence measures, GARCH, regime switching models, international finance, Value at Risk, expected shortfall, DCC, coherent measures of risk, subadditivity, heavy-tail distributions, stable distributions.
Contents
Sommaire j Summary iv Dédicace xvii Remerciements xviii Introduction générale 1Chapter 1: Dependence Structure and Extreme Comovements in International Equity and Bond Markets with Portfolio Diversification Effects 5
1. Introduction 6
2. Extreme Asymmetric Dependence and Modeling Issues 10
2.1 Empirical Facts 10
2.2 Tau Dependence 12
2.3 Why classical multivariate GARCH and RS model cannot reproduce asymptotic
asymmetries7 13
3. A Copula Mode! for asymmetric dependence 15
3.1 Disentangling the marginal distributions from dependence with copulas 16
3.2 Specification of the Marginal Distributions 18
3.3 Specification of the Dependence Structure 18
3.4 An adapted parsimonious model 21
3.5 Estimation 21
3.6 Testing asymmetry in dependence 24
investigation 25
4.1 Data 25
4.2 Marginal distributions 26
4.3 Dependence structure in bond and equity markets
. 27
4.3.1 US-Callada Dependence Structure 27
4.3.2 France-Germany Dependence Structure 28
4.3.3 Link between asymmetric dependence and the exchange rate 29
5. Asymmetric Dependence Effect on International Diversification 30
5.1 Investor Problem 32
5.2 Asymmetric Dependence and Cross-Country Portfolio Diversification: Home Bias
Investment 33
5.3 Asymmetric Dependence Effect on Domestic Diversification: Ftight to Safety 35 5.4 Monte Carlo Optimization Procedure for Portfolio Choice under each Regime
. . 35
6. Conclusion 36
Chapter 2: Asymmetric Dependence Implications for Extreme Risk Management 69
1. Introduction 70
2. Portfolio Risk and Dependence Structure Modeling 71
2.1 Gaussian Case 72
2.2 Multivariate GARCH 73
2.2.1 Univariate Distribution Model 73
2.2.2 Dynamic Conditional Correlation (DCC) 74
2.3 Asymmetric Dependence Distributions and Extreme Risk Measures 75
2.3.1 Beyond Symmetric Dependence: Copula 75
2.3.2 Underestimation of VaR and ES 76
3.1 Backtesting 78
3.1.1 Unconditional Coverage 78
3.1.2 Conditional Coverage 79
3.2 Testing the Extreme Risk Underestimation $0
3.2.1 A Simple Test of VaR Underestimation 80
3.2.2 A Simple Test of ES Underestimation 80
4. Empirical Investigation 81 4.1 Data 81 4.2 Dependence Structure 82 4.3 Testing Resuits 82 4.3.1 Equity Portfolio 82 4.3.2 Bond Portfolio 83
4.3.3 Underestimation of VaR and ES 83
5. Conclusion 84
6. Appendix A 85
Chapter 3: Proper Conditioning for Coherent VaR in Portfolio Management 95
1. Introduction 96
2. VaR Decentralization with Differential Information 98 3. Conditioning Information, Tails and VaR Subadditivity 100
3.1 Tails and Subaddivity 101
3.2 Tails and Conditioning Information 105
4. Proper Conditioning for Subadditive VaR 107
5. A Simple Illustration of a Rent-a-Trader System 110
5.2 Subadditivity Issues . 113
5.3 Backtesting VaR requirements 114
6. Conclusion 115
List of Tables
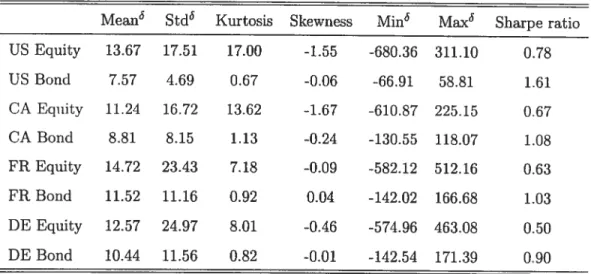
Summary statistics of weekly bond and cquity index returns for the four countries. Ail
returns are expressed in US dollars on a weekly base from January 01, 1985 to Deccmbcr 21,
2004, what corresponds to a sample of 1044 observations.
(
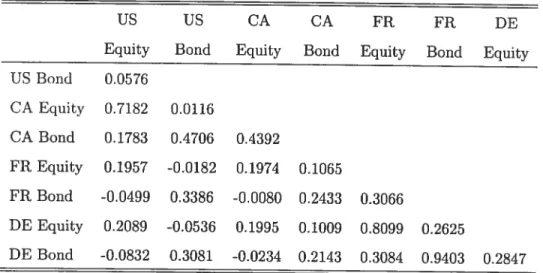
Denotes annualized percent). Sharpe ratio represents the ratio of the mean over the standard deviation of return 512 Unconditional correlations between different assets (bond and equity) of four considered
countries
52
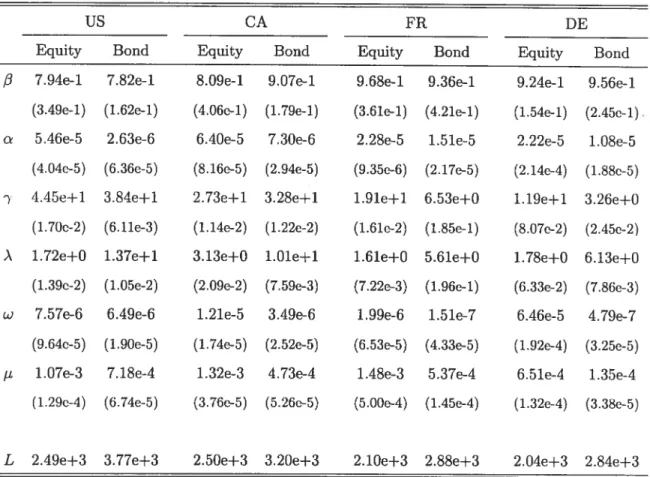
3 Estimates of M-GARCH (1, 1) parameters for ail bond and equity rctunis of four countries. The figures between brackets represent standard deviations of the parameters. L is the value
of the log likelihood function 53
4 Box-Pierce and Ljung-Box statistics for tests of independence of residuals. For each series,
the statistic is computed for different uumbers oflags (1, 4, 6, and 12). * and **
means that we cannot reject independence at the 1 and 5 percent levels respectiveiy 54
5 Dependence structure between the United States and Canada in equity and bond markets.
Correlation coefficients are reported for the normal regime, while tail dependence coefficients describe the asymmetric regime. The tail dependence coefficient is obtained as the product of
parameterTand the respective weight ir for cross-asset dependence and 1-ir for cross-country
deperidence. Standard deviations are reported hetween parentheses for all parameters esti
mated directly from the model. The last raw reports the diagonal elements of the transition
probability matrix 55
6 Dependence structure bctween France and Germany in equity and bond markets. Correlation
coefficients are reported for the normal regime, while tail dependence coefficients descrihe the asymmetric regime. The tail dependence coefficient is obtained as the product of parameterT
and the respective weight r for cross-asset dependence and 1-ir for cross-country dependence.
Standard deviations are reported between parcntheses for all parameters estimated directly
from the inodel. The iast raw reports the diagonal elements of the transition probability
matrix
7 Subperiod I (period before the introduction of the Euro currency: from January 01, 1985 to
December 29, 1998 for a sample of 731 observations). Dependence structure between France and Germany in equity and bond markets. Correlation coefficients are reportcd for the
normal regime, while tail dependence coefficients describe the asymmetric regime. The tail dependence coefficient is obtained as the product of parameter r and the respective weight ir for cross-asset dependence and 1-ir for cross-country dependence. Standard deviations are reported between parentheses for alt parameters estimated dircctly from the model. The last
raw reports the diagonal elements of the transition probability matrix 57 8 Subperiod II (period afrer the introduction of the Euro currency: from January 05, 1999 to
December 21, 2004 for a sample of 313 observations). Dependence structure between France and Germany in equity and bond markets. Correlation coefficients are reported for the normal regime, while tail dependence coefficients describe the asymrnetric regime. The tau dependence coefficient is obtained as the product of parameterr and the respective weight ir for cross-asset dependence and 1-ir for cross-country dependence. Standard deviations are rcported between parentheses for all parameters estimated directly from the model. The last
raw reports the diagonal elements of the transition probability matrbc 58
9 vIont.e Carlo Tests of Asymmetric Dependence. LR is the likelihood ratio statistic computed from the data. The p— value is obtained from 1000 Monte Carlo repetitions with size 1043
(equal to the sample size) each 59
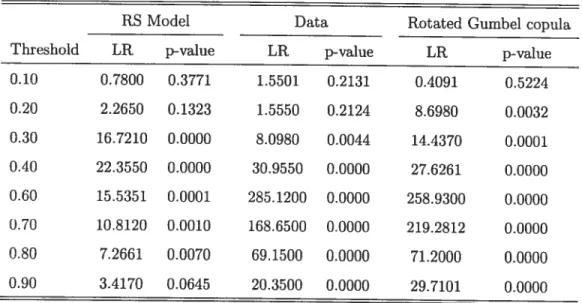
10 Longin and Solnik (2001) likelihood ratio test for extreme dependence correlation equal to zero at different thresholds. We apply this test on data, the regime switching model of Ang and Chen (2002), and the rotated Gumbel copula. we estimate the RS model and rotated Gumbel copula model and use estimates to simulate 10 000 Monte Carlo replications. We
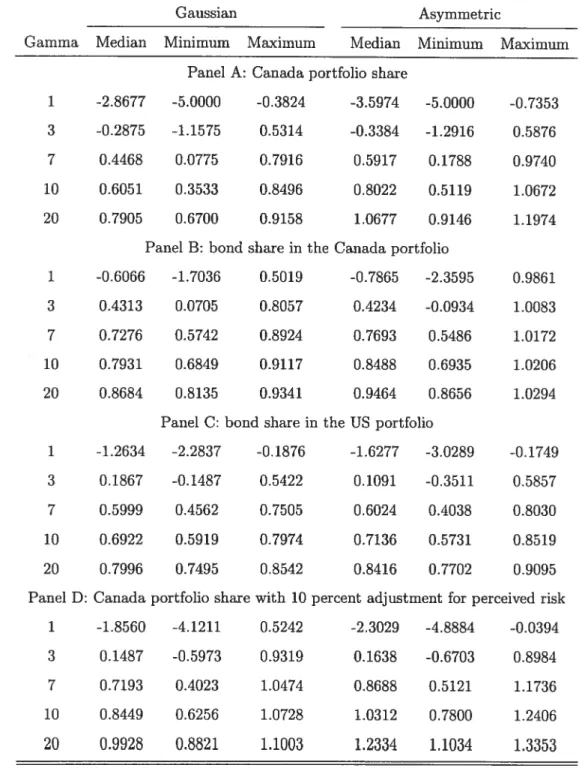
11 Resuits of Monte Carlo estimation of different weights for a canadian investor portfolio with bond and equity &om Canada and US. The panel A represents the share of home assets
in the whole portfolio, the panel B and C the bond share in the Canada and US portfolio respectively, while the panel D represents Canada portfoiio share with 10 percent adjustrnent for foreign (US) perceivcd risk. for 100 simulations we present the median as the estimate and also the minimum alld maximum
60
12 Estimates of GARCH (1, 1) parameters for ail bond and cquity rcturns. The figures between brackets reprcsent standard deviations of the parameter estimates 89
13 Sample correlation coefficient (Corr) and left tau dependence coefficient (TDC) computed
with the Gumbel copula
90 14 Aikaike (AIC) and Schwarz’s Bayesiari (BIC) information criteria for two symmetric copulas
(Gaussian and Studcnt-t and two asymmetric copula (Clayton and Gumbel). Estimation is
performcd over the in-sample period 91
15 Test results over the full sample for the US and Canada equity 50/50 portfolio (w
= 0.5) the first panel presents the unconditional backtest. LR is the likelihood ratio for uncondi
tional coverage with a
x
distribution. In the second panel, LR is the likelihood ratio forconditional coverage with a
x
distribution. ir in the third panel is the sample estimation of violation probability which is used to test the underestimation. The last panel prescntsthe test resuits for the ES. e is the differerice between the sample mean of violations and the
ES produced by the model. Three dependence models are tested. The Gaussian (Gauss.),
the Studcnt-t (t), and the Gumbel (Gumb.). Numbers in bold empliasize thc statistical
16 Test resuits over the full sample for the US and Canada bond 50/50 portfolio (w = 0.5)
the first panel presents the unconditional backtest. LR is the likelihood ratio for uncondi tional coverage with a distribution. In the second panel, LR is the likelihood ratio for conditional coverage with a distribution. itT in the third panel is the sample estimation
of violation probability which is used to test the underestimation. The last panel presents the test resuits for the ES. c is the difference between the sample mean of violations and the ES produced by the model. Three dependence models are tested. The Gaussian (Gauss.), the Student-t (t), and the Gumbel (Gumb.). Numbers in bold emphasize the statistical
List of Figures
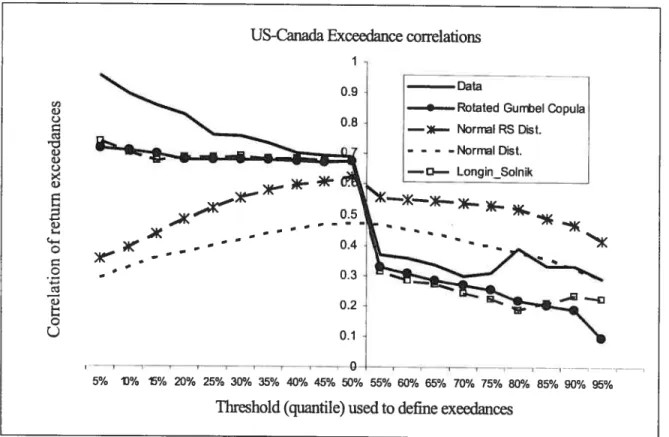
Calculates correlations from US-Canada equity returns data for different values of threshold8, which is normallzed. For O less than 50% the correlation is calculated for left tau and for O greater than 50%, the correlation is calculated for right tau. O = 80% means that we calculate the correlation conditional on 20% greatest observations for both U.S. and Canadian equity returns, and O = 10% means that we calculate the correlation conditional on 10% lowest observations for both U.S. and Canadian equity returns. Solid une represents the exceedance correlations calculated directly from data. For Rotated Gumbel Copula (with Gaussian Margins), Normal Regime Switching Distribution, and Normal Distribution, we first estimate the model and use estimates to generate 50 000 Monte Carlo simulations to calculate correlations. LonginSolnik exceedances correlations are obtained by Longin and Solnik (2001)
estimation method 61
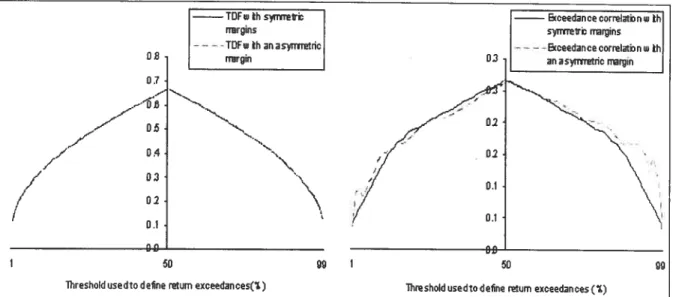
2 Effect of marginal distribution asymmetry on Tail Dependence function and Ex ceedance correlation: Firstly we simulate standard bivariate Gaussian distribution with correlation 0.5 and compute TDF and Exceedance correlation. Secondly, we create asymmetry in one marginal distribution by replacing the N(0, 1) by a mixture
of N(0, 1) and N(4, 4) with equal weight 62
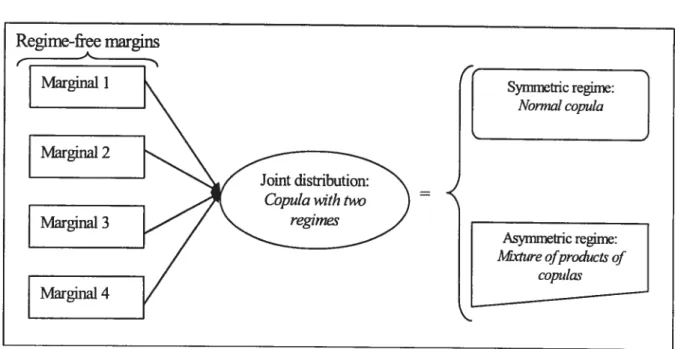
3 Model structure: Disentangling marginal distributions from the dependence struc ture with a two-regime copula, with one symmetric regime and one asymmetric
regime. The marginal distributions are regime-ftee 63
4 Illustration of the three components of asymmetric copula. Each component is the product of the two bivariate copulas representing the corresponding encircled couple
ofreturns 63
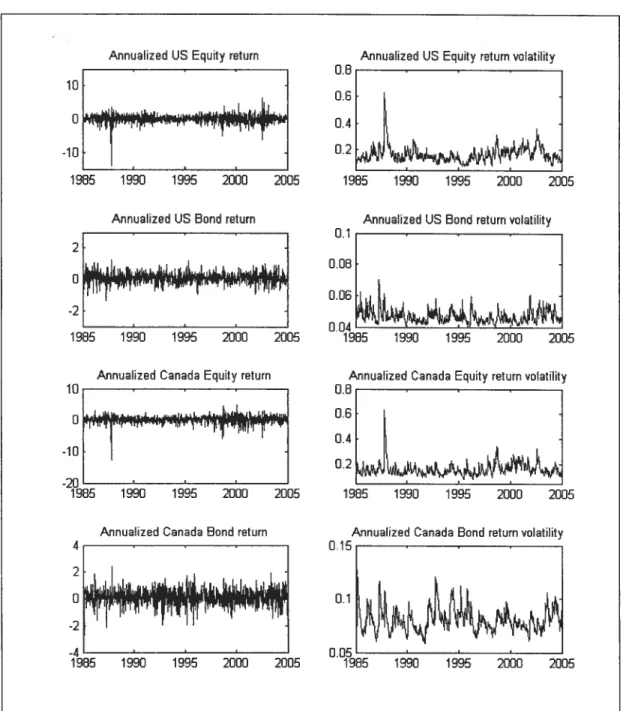
5 Annualized bond and equity returns time series for US and Canada, with their conditional volatilities obtained using the M-GARCH (1,1) 64 6 Annualized bond and equity returns time series for France and Germany, with their
Z Conditional probability denotes the probability to be in asymmetric regime condi
tional to available information. Exchange rate volatility is the conditional volatïlity
filtered with the M-GARCH (1,1) model 66
8 Canadian (home) portfolio share inside the international portfolio including both
bonds and equities from Canada and US. The dash lime represents optimal weight under normal dependence regime, while solid lime represents optimal weight under asymmetric dependence structure. The second graph assume 10% more perceived risk for foreign (US) market. The standard deviations for US bond and equity are multïplied be 1.1
67
9 The bond share inside home (Canadian) portfolio and foreign (US) portfolio. The
dash line represents optimal weight under normal dependeuce regime, whule solid une represents optimal weight under asymmetric dependence structure 68
10 Out-of-sample forecasts for the equity portfolio 1% VaR using the three dependence
À
ma femme, Yottande,à mon fils, Wittiam. à ma
fit
te, Etka, à mon père, David,à ma mère, Marie, à mes frères et soeurs et à tous mes amis et camarades.
Remerciements
Je tiens ici à remercier de nombreuses personnes et institutionspour leur soutient et leur aide dans l’accomplissement de cette thèse. Tout d’abord mou directeur de recherche René Garcia qui a su orienter et guider mes recherches de manière fructueuse. Durant les années de préparation de cette thèse, il a su m’encourager, me prodiguer des conseils et surtout me soutenir dans les moments les plus difficiles. Sans son soutien, j’aurais sûrement abandonné.
Je voudrais remercier mon co-auteur Éric Renallit pour sa collaboration significative dans le troisième chapitre de cette thèse. Ce dernier m’a beaucoup appris et je lui suis très reconnaissant. Je voudrais aussi remercier les nombreux organismes qui m’ont soutenu par leur financement: Centre Interuniversitaire de Recherche en Analyse des Organisations (CIRANO), Centre Interuni versitaire de Recherche en Économie Quantitative (CIREQ).
Je voudrais surtout remercier mon épouse Yollande pour tout son soutient, sa comprehension et ses encouragements tout au long de la redaction de cette thèse. Je remercie également mon fils William, ma fille Elka, mon père David, ma mère Marie, mes frères et soeurs sans oublier mes amis et camarades.
Je ne saurais terminer sans rendre grâce à l’éternel Dieu tout puissant sans qui cette thèse n’aurait jamais pu aboutir.
Introduction générale
La spécification de la distribution des rendements des actifs financiers revêt une importance capitale dans la gestion de portefeuilles et la gestion du risque. Dès lors, il est impératif de mieux comprendre le comportement stochastique de ces rendements, leurs caractéristiques et surtout la structure de leur dépendance.
Des travaux récents notamment de Longin et Solnilc (2001) et Ang et Chen (2002) ont révélé l’existence d’une asymétrie dans la corrélation des rendements des actifs internationaux. En effet, ils ont constaté une forte corrélation entre des rendements pendant les périodes de détresse et une faible corrélation entre les rendements lors des booms sur les marchés internationaux. Poussant leur analyse plus loin au moyen de la théorie des valeurs extrêmes, Longin et Solnik (2001) se sont rendu compte que la corrélation était nulle pour les rendements extrêmement élevés, alors qu’elle restait strictement positive pour des rendements extrêmement bas. Bien que la théorie des valeurs extrêmes permette d’établir de façon précise l’existence de cette asymétrie, elle ne permet ni de la modéliser dans une distribution globale, ni de déterminer quel modèle est capable de la reproduire.
L premier chapitre de cette thèse s’attaque d’abord à l’analyse des modèles classiques dans
le but de voir s’ils sont capables ou non de reproduire cette asymétrie dans la dépendance. En établissant un lien entre la corrélation extrême et la dépendance des queues, nous montrons que les modèles à changement de régime et les modèles GARCH classiques la reproduisent partiellement ou ne la reproduisent pas du tout. En fait, les modèles GARCH classiques utilisent la loi normale ou la loi t de Student qui sont des lois symétriques et de ce fait, bien que la dynamique dans la volatilité soit capable de changer la dépendance dans les queues elle ne peut modifier la symétrie de cette dépendance tant que la moyenne reste constante dans le temps. Par contre, comme le constate Aiig et Bekaert (2002), le modèle a changement de régime quant à lui reproduit de l’asymétrie dans la dépendance, mais cette asymétrie disparait lorsqu’on va plus loin dans les queues. Nous proposons alors un modèle basé sur les copules qui permet de prendre en compte l’asymétrie dans la dépendance.
relier les distributions univariées pour en construire des distributions multivariées. Elles définissent complètement la structure de dépendance et permettent d’aller au delà de la dépendance linéaire (corrélation) pour prendre en compte les nonlinéarités observées dans les faits.
En utilisant ces outils, nous avons pu construire un modèle à quatre variables, qui nous per met non seulement d’analyser le comportement de la corrélation mais aussi la dépendance dans les queues. Notre modèle comprend deux régimes de dépendance: la dépendance normale (ou Gaussi enne) qui est caractérisée par une structure symétrique, et une dépendance dite « rotated Gumbel » qui présente une asymétrie avec une dépendance dans la queue basse et une indépendance dans la queue supérieure. Ces deux régimes alternent dans le temps selon un processus dit « markovien » qui n’est cependant pas observable. L’utilisation des copules nous permet d’autre part de modéliser séparément les distributions marginales et la structure de la dépendance. Ainsi, nous avons utilisé les modèles GARCH univariés pour modéliser chaque rendement pris individuellement.
Ce modèle nous a permis d’analyser le comportement des rendements des actions et des oblig ations sur les marchés internationaux. Pour cela, deux paires de pays ont été considérées. Le Canada et les Etats-Unis d’une part, la France et l’Allemagne d’autre part. Les résultats em piriques ont révélé une plus forte dépendance internationale entre les actifs du même type par rapport à la dépendance entre les obligations et les actions même lorsqu’on considère le même pays. D’autre part, nous avons mis en exergue une relation entre la volatilité du taux d’échange et l’asymétrie dans la dépendance. Ainsi, la dépendance entre la France et l’Allemagne s’est révélée très asymétrique avant l’introduction de la monnaie unique européenne (Euro), alors que cette asymétrie a considérablement diminué après l’introduction de cette monnaie.
L’application de ce modèle dans la diversification internationale de portefeuille a permis d’apporter un élément d’explication additionnelle aux phénomènes tels que la faible diversification interna tionale et la tendance des investisseurs à se rabattre sur les actifs moins risqués comme les oblig ations au détriment des actions. L’intuition derrière cette explication est qu’en présence d’une forte dépendance dans les moments de baisse sur les marchés, les bénéfices liés à la diversification diminuent du fait que l’effet de la diversification s’estompe au moment ou les investisseurs en ont
le plus besoin.
Dans le second chapitre, nous analysons les implications de cette asymétrie de la dépendance sur les mesures de risques extrêmes. Notamment la valeur-à-risque (VaR) qui représente le niveau de perte maximale encourue sur une période déterminée et avec un seuil de confiance donné. Mais aussi sur la « Expected Shortfall >
(ES) qui représente la perte moyenne lorsqu’elle dépasse la VaR. Nous montrons que lorsque cette asymétrie n’est pas prise en compte dans un modèle et que la loi Gaussienne est utilisée comme c’est souvent le cas dans la pratique, ces mesures de risques extrêmes sont sous-estimées.
Dans une analyse empirique, en utilisant le cadre du modèle DCC de Engle (2002) dans lequel nous introduisons différente structure de dépendance et en l’appliquant à des portefeuilles équi pondérés d’actions américaines et canadiennes d’une part et d’obligations de ces deux mêmes pays d’autre part. Nous nous sommes rendu compte que bien que ce cadre général estime assez bien la VaR au niveau 5% pour toutes les structures de dépendance, il sous-estime cette mesure pour des niveaux beaucoup plus prudentiels (1%, 0.5%) lorsque l’asymétrie présente dans les données n’est pas prise en compte. Nous avons obtenu par contre un résultat inattendu bien que explicable pour
ce qui est de l’estimation de la ES. En effet, les modèles de dépendance asymétrique comme la
Gaussienne et la t de Student sous-estiment cette seconde mesure au niveail 5%, bien qu’ils aient donné plutôt une bonne estimation de la VaR à ce même niveau de couverture. Une explication peu être liée au fait que si ces distributions génèrent des portefeuilles avec des queues moins épaisses qu’elles devraient l’être, alors elles auraient tendance à sous-estimer la moyenne dans les queues. Pour la précision dans l’estimation des mesures de risques extrêmes en situation de dépendance asymétrique, nous avons constaté de manière générale une supériorité de la copule de Gumbel qui prend en compte l’asymétrie observée dans la structure de dépendance.
Le problème de la cohérence de la VaR comme mesure de risque est aborde dans le troisième chapitre. En effet Artzner et al (1999) ont formulé quatre propriétés qu’une mesure de risque doit satisfaire pour être considérée comme cohéreilte. L’une de ses propriétés notamment la sous additivité n’est pas toujours vérifiée par la VaR. La pertinence de cette propriété repose sur le fait
que la diversification est considérée comme un moyen de réduction du risque, cependant pour que
ce soit le cas, il faudrait que la mesure de risque soit sous-additive. L’idée clef de notre démarche est
que si l’épaisseur des queues de distributions est responsable de la violation de la sous-additivité, une utilisation appropriée de l’information conditionnelle pourrait rendre la VaR plus rationnelle pour la gestion décentralisée du risque. Nous développons une triple argumentation. Premièrement, partant du fait que les traders possèdent sur leur segment de marché une information dite privée plus riche que le gestionnaire central, Ils doivent simplement respecter les contraintes prudentielles imposées par celui-ci pour que le contrôle de la VaR décentralisée fonctionne de façon cohérente. Nous montrons par la suite, que dans ce contexte de décentralisation, si le gestionnaire central a accès ex-post à la composition du portefeuille des traders individuels, il pourra récupérer une bonne part de leur information privée. Cette composition du portefeuille peut être utilisée pour améliorer le backtesting dans le but de vérifier que la contrainte prudentielle a été respectée par
les traders. Finalement, en utilisant les distributions à queues épaisses telles que les lois stables
et les lois de type Pareto, nous montrons que l’épaisseur exigée des queues pour violer la sous additivité même pour les petits niveaux de probabilités, induit une situation tellement extrême qu’elle correspond à une information tellement faible que la perte espérée est infinie. Nous concluons dont que l’incohérence de la gestion décentralisée par la VaR caractérisée par l’absence de sous additivité avec une information assez riche, est une exception et non une règle, d’autant plus que dans la pratique, la moyenne conditionnelle ou inconditionnelle est en général supposée finie. En d’autres termes, sans remettre en cause la validité mathématique du résultat selon lequel la VaR peut dans certaines conditions violer la sous-additivité, nous recentrons le débat sur le plan pratique en montrant qu’elle est cohérente non seulement dans le cadre des lois normales, mais aussi dans un contexte plus général des distributions fréquemment utilisées dans la modélisation des valeurs extrêmes telles que les lois de type Pareto et les lois stables tant que la moyenne est finie.
Chapter 1
Depeildence Structure and Extreme Comovements in
International Equity
and
Bond Maikets with PortfoÏio
1.
Introduction
Negative returns are more dependent than positive returns in financial markets, especially in international asset markets. This phenomenon known as asymmetric dependence has been reported by rnany previous studies including Erb et al (1994), Longin and Solnik (2001), Ang and Bekaert (2002), Ang and Chen (2002), Das and Uppal (2003), Patton (2004), and references therein. This asyrnmetric dependence lias important implications for portfolio choice and risk management.’ However, measuring and modeling asymmetric dependence remains a challenge.
Previous studies commonly use simple, dynamic or exceedance correlation to investigate the dependence structure between financial returns.2 These measures are adequate for linear and especially when the returns are jointly normal or conditionally normal, a property which is rarely verified empirically, especially at high frequency. Boyer et al (1999) and Forbes and Rigobon (2002) remark that correlations estimated conditionally on high or low returns or volatility suifer from some conditioning bias. Correlation asymmetry may therefore appear spuriously if these biases are not accounted for. To avoid these problems, Longin and Solnik (2001) use extreme value theory (EVT) by focusing on the asymptotic value of exceedance correlation.3 The benefit of EVT resides in the fact that the asymptotic resuit holds regardless of the whole distribution of returns. However, as emphasized by Longin and Solnik (2001), EVT cannot help to determine if a given return-generating process is able to reproduce the extreme asymmetric exceedance correlation observed in the data.
‘Patton (2004) finds that the knowledge of asymmetric dependence leads to gains that arc economically significant, while Ang and Bekaert (2002), in a regime switching setup, argue that the costs of ignoring the difference bctween regimes of high and low dependence are small, but increase with the possibility to invest in a risk-frec asset.
2The cxceedance correlation between two series of returns is defined as the correlation for a sub-sample in which the returns of both series are simultaneously lower (or greater) than the corresponding thresholds 01 and02. Formally, exccedance correlation of variables X and Y at thresholds0 and 02 is expressed by
f
corr(X, YIX<01,Y <02) for 0 <0 and 02<0Ex corr (Y, X; 01,02) =
—
— — . Longin and Solnik (2001) use
corr(X, YIX 6,, Y 02), for 01 O and02 O
6, — 0 0, whilc Ang and Chen (2002) use0, = (1 +0)
and 02= (1 +0)i,where andiare the means of Y
and X rcspectively.
Extrcmc Value Theory (EVT) is used to characterize the distribution of a variable conditionally to the fact that
This paper provides a first solution to this shortcoming. By using the concept of tau depen dence instead of exceedance corelation, we are able to investigate which model can reproduce these empirical facts. The tau dependence coefficient can 5e seen as the probability of the worst event in one market given that the worst event occurs in another market. Contrary to exceedance correla tion, the estimation of the tau dependence coefficient is not subject to the problem of choosing an appropriate threshold and the use of extreme value distributions such as the Pareto distribution. Another difference is that tau dependence is cornpletely defined by the dependence structure and is not affected by variations in marginal distributions.
Thanks to the tau dependence formulation of asymptotic dependence, we establish important analytical results. We show that the multivariate GARCH or regime switching (R$) models tvith Gaussian innovations that have been used to address asymmetric dependence issues (see Ang and Bekaert, 2002, Ang and Chen, 2002, and Patton, 2004) cannot reproduce an asymptotic exceedance correlation. The key point is that these classes of models can 5e seen as mixtures of symmetric distributions and cannot produce asymptoticadly an asymmetric dependence. 0f course this does not mean that at fuite distance a mixture of these classes cannot produce sorne asymmetric depen dence. The RS model of Ang and Chen (2002) offers a good example. However, the asyrnrnetry put forward disappears asyrnptotically. When we go far in the tails, we obtain a sirnilar dependence for the upper and lower tails. In RS models, extreme positive (or negative) returns are independent. Moreover, the asymmetry in this RS model cornes from the asymmetry created in the marginal distributions with regirne switching in the mean. Hence it is not separable from the marginal asymmetry or skewness. ‘
We propose au alternative model based on copulas that allows tau dependence for lower returns and keeps tail independence for upper returns as suggested by the findings of Longin and $olnik (2001). We apply this model to international equity and bond markets to investigate their depen deuce structure. It includes one normal regime in which dependence us symrnetric and a second
4Ang and Chen (2002) conclude that even if regime-switching modcls perform best in explaining the amount of correlation asymmetry reflccted in the data, these models stili leave a significant amount of correlation asymmctry in the data unexplained.
regime characterized by asymmetric dependence. We separately analyze dependence between the two leading markets in North-America (US and Canada) and two major markets of the Euro zone (France and Germany). We further investigate the implications of this asymmetric dependence on international portfolio choice especially its abiiity to explain the home bias investment and ffight to safety.
Copulas are functions that build miiltivariate distribution functions from their unidimensional marginal distributions. The theory of this useful tool dates back to Sklar (1959) and a clear pre sentation can be foiind in Neisen (1999). Well designed to analyze nonlinear dependence, copulas were initially used by statisticians for nonparametric estimation and measure of dependence of fan-dom variables (see Genest and Rivest, 1993 and references therein). Their application to financial and economic problems is a new and fast-growing field of interest. Here, the use of this concept
is essentialiy motivated by the fact that it ailows to separate the features due to each marginal
distribution from the dependence effect between ail variables. This helps overcoming the curse of dimensionaiity associated with the estimation of models with several variables. For example, in multivariate GARCH models, the estimation becomes intractable when the number of series being modeied is high. The CCC of Bolierslev (1990), the DCC of Engle (2002), and the R$DC of Pelletier (2004) deal with this problem by separating the variance-covariance matrix in two parts, one part for the univariate variances of the different marginal distributions, another part for the correlation coefficients. This separation aliows them to estimate the modei in two steps. In the first step, they estimate the marginal parameters and use them in the estimation of the correlation parameters in a second step. Copulas offer a tool to generalize this separation while extending the linear concept of correlation to nonlinear dependence.
The empirical investigation shows that the dependence between equities and bonds is low even in the same country, while the dependence between international assets of the same type is large in both regimes. Extreme dependence appears across countries in both the bond and equity markets, but it is nonexistent across the bond and the equity markets, even in the same country. Another finding is that the correlation in the normal regime differs from the unconditional correlatiori.
This may be due to nonlinear dependence of international returns characterized by the presence of extreme dependence that is absent in the tau of a multivariate normal distribution. Exchange rate volatility seems to be a factor contributing to asymmetric dependence. With the introduction of a flxed exchange rate the dependence between France and Germany becomes less asymmetric and more normal than before. High exchange rate volatility is associated with a high level of asymmetry. These resuits are consistent with those of Cappiello, Engle and Sheppard (2003) who find an increase in correlation after the introduction of the Euro durrency.
We use this model in a simple portfolio choice framework with a CRRA utility function in volving the same categories of assets. We explore the implications in ternis of diversification, both internationally (the home bias phenomenon) and domestically (the flight to safety phenomenon). The main resuit is that asymmetric dependence increases the downside risk and therefore, very risk averse investors tend to switch toward less risky assets when downside dependence increases. So, for a Canadian investor who holds US and Canadian bonds and equities, the share invested in Canada increases with the asymmetric dependence since the Canadian market in our sample is less risky. A similar behavior is observed for the bond and equity trade-off. In the asymmetric dependence regime, the very risk averse agent increases the fraction of its wealth in bonds.
The rest of this paper is organized as follows. Section 2 reformulates the empirical facts about exceedance correlation in terms of tail dependence and shows how classical GARCH or regime switching models fail to capture these facts. In section 3 we develop a model with two regimes that clearly disentangles dependence from marginal distributional features and allows asymmetry in extreme dependence. As a resuit, we obtain a model with four variables that features asymmetry and a flexible dependence structure. Empirical evidence on the dependence structure is examined in section 4, while section 5 analyses the implications of asymmetric dependence on international and domestic diversification. Conclusions are drawn in section 6.
2.
Extreme Asymmetric Dependence and Modeling Issues
In this section we present empirical facts about exceedance correlation in international equity market returns put forward by Longin and Solnik (2001) and the related literature. We next argue that these facts can be equivalently reformulated in terms of tau dependence. The latter formulation will allow us to explain why classical return-generating processes such as CARCH and regime switching models based on a multivariate normal distribution fail to reproduce these empirical facts.
2.1 Empirical Facts
Longin and Solnik (2001) investigate the structure of correlation between various equity markets in extreme situations. Their main finding is that equity returns exhibit a high correlation in extreme bear markets and no correlation in extreme buli periods. They arrive at this conclusion by testing the equality of exceedance correlations, one obtained under a joint normality assumption and the other one computed using EVT. For the latter distribution, they model the marginal distributions of equity index returns with a generalized Pareto distribution (GPD) and capture dependence through a logistic furiction. Their a.nalysis brings forward two important facts. First, there exists asymmetry in exceedance correlation, that is large negative returns are more correlated than large positive returns. Ang and Chen (2002) who develop a test statistic based on the difference between exceedance correlations computed from the data and those obtained from a given model.5 They find as in Ang and Bekaert (2002) that regime switching models cari reproduce the above fact. However, in their regime switching model, it is difficult to separate asymmetric dependence from marginal asymmetries or skewness in the marginal distributions.
tN 11/2
5Ang and Chen (2002) define n tcst statistic H
— which is the distance between ex coedance correlations obtained from the normal distribution (p(t9t) ...,p(9N))and excecdance corretations estimatcd
from the data ((9y),...,(9N)) for a set of N selected thresholds fi9 3N} In the same way they dehne H
and H by considering negative points for H and nonnegative points for H such that H2 = (Hj2 + (Hj2. Thcy can therefore couclude to asymmetry if H differs from H+. Their resuits depend on the choice of the set of thresholds and can only account for asymmetry at finite distance but not asymptotically.
The second fact relates to exceedance correlation in the limit. Longin and Solnik find that exceedance correlation is positive and statistically different from zero for very large negative returns and not different from zero for very large positive returus.
We illustrate these facts and the capacity of models to reproduce them in Figure 1 with US and Canadian returns. We specify thresholds in term of quantiles: 01 = Fj (cv) and 02 = F1 (a) where Fx and Fy are the cumulative distribution functions of Y and X respectively. Follow ing Longin and Solnik (2001) and Ang and Chen (2002) exceedance correlations are symmetric if
E:rcorr (Y, X: 0) ExcorT(Y, X;82) ;a E (0, 1). Correlations of return exceedances exhibit
the typical shape put forward in Longin and Solnik (2001) for the US equity market with various European equity markets. For the models, we chose to retain the multivariate normal, as a bench mark case to show that correlations go to zero as we move further in the tails, as well a normal regime switching model, as in Ang and Chen (2002). The last model produces some asymmetry in correlations for positive and negative returns but not nearly as much as in the data. We also exhibit the exceedance correlations estimated from the model used by Longin and Solnik (2001). It is evidently much doser to the data. Finally, tve also report the correlations obtained from a
rotated Gumbel copula for the dependence function (see Appendix for a definition), with Gaussian marginal distributions. The graph is very close to the Longin and Solnik (2001) one.
Since asymptotic exceedance correlation is zero for both sides of a bivariate normal distribution, Longin and $olnik (2001) interpreted these findings as rejection of normality for large negative returns and non-rejection for large positive returns. In the conclusion of their article, Longin and Solnik stress that their approach lias the disavantage of not explicitly specifying the class of return-generating processes that fail to reproduce these two facts.
We provide a first answer to this concern by characterizing some classes of models which cannot reproduce these asymmetries in extreme dependence. The difficulty in telling which model can reproduce these facts is the lack of analytical expressions for the asymptotic exceedance correlation and its intractability even for classical models such as Gaussian GARCH or regime switching models. In order to investigate this issue, we introduce the concept of tau dependence.
2.2 Thil Dependence
Ta measure the dependence between an extreme event an ane market and a similar event an anather market, vie define twa dependence fnnctians ane far the lower tau and ane far the upper tau, with their correspanding asymptatic tau dependence caefficients. Far twa randam variables X and Y with cumulative distributian functians Fx and Fy respectively, we call the lawer tail dependence functian (TDF) the conditianal prabability rL(cx) Pr [X < F’ (cx) Y <Fi’ (cx)] and similarly, the upper tail dependence function is rU (cx) Pr [X F’ (1— cx) Y F/’ (1
—cx)] far cx E (0, 1/21.6 The tail dependence coefficient (TDC) is simpiy the limit (when it exists) of this function
when cx tends ta zero. Mare precisely lower TDG is rL = limr’ (cx) and zipper TDC is rU = limrU (cx). As in the case of joint normality, vie have lower tail-independence when rL = O and upper tail-independence for rU = 0.
Compared ta exceedance carrelation used by Longin and Solnik (2001), Ang and Chen (2002), Ang and Bekaert (2002), and Patton (2004), one of the advantages of TDF and correspanding TDCs
is their invariance ta modifications of marginal distributions that do not affect the dependence
structure. Figure 2 gives an illustration of tbis invariance. We simulate a bivariate Gaussian distribution N (0, I,j, where I,, is the twa dimensionai matrbc with standard deviations equal ta ane in ail elements of the diagonal and p = 0.5 is the correlation coefficient outside the diagonal elements. Bath exceedance correlation and tau dependence measures show a symmetric behavior of dependence in extreme returns. However, when vie replace one of the marginal distributions
AT(0, 1) by a mixture of normals one N (0, 1) and one N (4,4) with equal weights and let the
other marginal distribution and the dependence structure unchanged, the TDF remains the same while the exceedance correlation is affected. In fact, the correlation coefficient and the exceedance correlation are a function of the dependence structure and of the marginal distributions while the tail dependence is a sole function of the dependence structure, regardless of the marginal distributions.
61n the literature (sec Rodriguez, 2004 and references therein), oniy the iimit of this function is considered.
Here, we define thc TDF for every cx € (0, leoer2j te make a cemparisen with cenditienal cerrelatien, which is aise n function cf a threshold. The taU dependence mensure is aise reiated te the concept cf lewer (upper) erthant dcpendence concept (sec Denuit and Scaillet, 2004).
Another disadvantage of exceedance correlation is that asymptotic exceedance correlation cannot be estimated without sample bias since fewer data points are available when we move further into the tails of the distribution. Longin and Solnik (2001) determine by simulation an optimal threshold and use the subsample beyond this threshold to estimate the asymptotic exceedance correlation. But this shortcoming does not compromise the resuits of Longin and Solnik (2001) since they choose different levels of threshold and stiil obtain the same resuit. With tau dependence, the estimation
is donc using ail data points in the sample and the estimators of the tau coefficients are unbiased.
By observing that for the logistic function used by Longin and Solnik (2001), the zero value for the asymptotic correlation coefficient is exactly equivalent to tau independence, we can reformulate their asymptotic resuit as foiiow : iower extreme returns are tail-dependent, while upper extreme returns are tail-independent.7
This reformulation presents at least two main advantages. Compared to exceedance correlation. the tau dependence coefficient is generally casier to compute and analytical expressions can be obtained for almost ail distributions. This is not the case for exceedance correlation even for usual distributions. Moreover, we can easily derive the tau dependence of a mixture from the tau dependence of the different components of the mixture. The last property will be used below to investigate which model can or cannot reproduce the resuits of Longin and Solnik (2001).
23
Why classical multivariate GARCH and RS model cannot reproduce as
ymptotic asymmetries?
Ang and Chen (2002) and Ang and Bekaert (2002) try to reproduce asymmetric correlations facts with classical models such as GARCH and RS based on a multivariate normal distribution. Afrer examining a number of models, they found that GARCH with constant correlation and fairly asymmetric GARCH cannot reproduce the asymmetric correlations documented by Longin and Solnik. However, they fouixd that a RS model with Gaussian innovations is better at reproducing
7For the logistic function with parameter a, the correlation coefficient of extremes is 1_cs2 (see Longin and Solnik,
2001). We find that the upper tau dependence coefficient is 2—2’. Then, both coefficients are zero when n equals 1
asymmetries in exceedance correlation. They clearly reproduce asymmetric correlations at finite distance, however the asymptotic asymmetric dependence put forward in Longin and $olnik (2001). Their finite distance asyrnmetric correlation cornes from the asymrnetries produced in the marginal distributions with a regime switching in rneans.8 Therefore it becornes difficuit to distinguish asymmetries in dependence from asyrnmetry in marginal distributions.
By reinterpreting Longin and Solnik (2001) resuits in terrn of TDC instead of asymptotic cx ceedance correlation, we show analytically that ail these models cannot reproduce asyrnptotic asym metry even if sorne can reproduce fuite distance asymmetry. These resuits are extended to the rejection of more general classes of return-generating processes. The key point of this resuit is the fact that many classes of rnodels including Gaussian(or Student) GARCH and RS ca.n be seen as mixtures of symmetric distributions. We establish the following resuit.
Proposition 2.1:
(i) Any GARGH modet with constant mean and symmetric conditionat distribution lias a sym
rnetric unconditionat distribution and hence lias a symmetric TDC.
(ii) If the conditionat distribution of a RS modet lias a zero TDC, then the unconditionat dis
tribution atso lias a zero TDC.
(iii) From a muttivariate distribution with symmetric TDC, it is impossibte to construct an asymmetric TDC with a mixture procedure (as GARCH, RS OT any otheT) by keeping alt marginal
distributions unchanged across mixture components. Proof: see Appendix A.
This proposition allows us to argue that the classical GARCH or RS models cannot reproduce asymmetries in asymptotic tau dependence. Therefore, the classical GARCH rnodels (BEKK, CCC
8Ang and Bekaert (2002) note that the ability of RS model (compared to GARCH model) to reproduce a.sym mctries, derives from the fact that it accounts the persistence in both first and second moments while the GARCH accounts this persistence only in second moments. We give analytical arguments to this intuition.
or DCC) with constant mean can be seen as a mixture of symmetric distributions with the same flrst moments and therefore exhibit a symmetric tau dependence function as well as a symmetric TDC.9 When the mean becomes time-varying as in the GARCH-M model the llnconditional distribution can allow asymmetry in correlation (Ang and Chen, 2002), but this asymmetry cornes from the mixture of the marginal distributions. The resulting skewness cannot 5e completely disentangled from the asyrnrnetric correlation, since correlations are affected by marginal changes. $irnilarly. the classical RS model with Gaussian innovations is a discrete mixture of normal distributions which has a TDC equal to zero on both sides. Therefore, by (ii) we argue that both its TDCs are zero. However, at finite distance, when the mean changes with regimes, the exceedance correlation is not symmetric. This asymmetry is found by Ang and Chen (2002) and Ang and Bekaert (2002) in their RS model, but it disappears asymptotically and it cornes from the asymrnetry created in the marginal distributions by regime switching in means. Hence, the asymmetries in correlation are not separable from the marginal asymmetry, exactly like in the GARCH-M case. The part (iii) of proposition 2.1 extends this intuition in terms of more general multivariate mixture models based on symmetric innovations. Actually when the marginal distributions are the same across ail symmetric TDC components of a mixture, it is impossible to create asymmetry in TDCs.
Two relevant questions arise from the above discussion. First, how can we separate the mar ginal asymmetries from the asymmetry in dependence? Second, how can we account not only for asymmetries at finite distance but also for asymptotic dependence? In the next section, we propose a flexible model based on copulas that addresses these two issues.
3.
A Copula Model for asymmetric dependence
Our model aims at capturing the type of asymmetric dependence found in international equity returns. Our discussion in the last section showed that it is important to disentangle the marginal
9The BEKK proposed by Engle and Kroner (1995) is the straightforward generalization of the GARCH model to a multivariate case which guarantees positive definiteness of the conditional variance-covariance matrix. In the CCC model proposed by Bollerslcv (1990) the conditional variance-covariance matrix is assumed constant, while in the DCC of Engle (2002) this matrix is dynamic.
distributions from the dependence structure. Therefore, we need to allow for asymmetry in tau dependence, regardless of the possible marginal asymmetry or skewness. Copulas, also known as dependence functions, are an adequate tool to achieve this aim.
3.1
Disentangling the marginal distributions from dependence with copulas
Estimation of multivariate models is difficuit because of the large number of parameters irivolved. Multivariate GARCH models are a good example since the estimation becomes intractable when the number of series beïng modeled is high. The CCC of Bollerslev (1990), the DCC of Engle (2002), and the RSDC of Pelletier (2004) deal with this problem by separating the variance-covariance matrix into two parts, one for the univariate variances of the different marginal distributions, the other for the correlation coefficients. This separation allows them to estimate the model in two steps. In the first step, they estïmate the marginal parameters and use them in the estimation of the correlation parameters in a second step. Copulas offer a tool to generalize this separation while extendhig the linear concept of correlation to nonlinear dependence.
Copulas are functions that build multivariate distribution functions from their unidimensional margins. Let X (X1,...,X,) be a vector of n univariate variables. Denoting F the joint n
dimensional distribution function and Fi,...,F, the respective margins of Xi,
...,X,. Then the
Sklar theorem states that there exists a function C called copula which joins F to F1, ...,F1,, as
fo)lows.10
F(xi,...,x.)=C(fi(xi) F(x)) (3.1)
This relation can be expressed in term of densities by differentiating with respect to all argu ments. We can therefore write (2.1) equivalently as
f(xi,...,x) =c(Fi(xi),...,F(x)) x llfj(xj) (3.2) where
f
represents the joint density firnction of the n-dimensional variable X andf
the densit,r function of the variable X for i = 1, ...,n. The copula density function is naturally defined by‘°Sec Nelsen (1999) for a general presentation. Note that if F is continuous for any j 1 n then the copula C
c fui,...,u)
O8tC(ui, ...,un). Writing the joint distribution density in the above form,
we nnderstand why it can be said that copula contains ail information about the dependence
structure.11
We now suppose that our joint distribution function is parametric and we separate the marginal parameters from the copula parameters. So the relation (3.2) can be expressed as:
f(xi,...,x;6,O) = c(ui,...,u0;O)xflf(x;); (3.3) = F (xi; Si) for j = 1,..., n
where S = (Sf7 ...,S) are the parameters of the different margins and O denotes the vector of ail
parameters that describe dependence through the copula. Therefore, copulas offer a way to separate margins from the dependence structure and to build more flexible multivariate distributions.
More recent work aliow some dynamics in dependence. In a bivariate context, Rodriguez (2004) introduces regime switching in both theparameters of marginal distributions and the copula func tion.12 Ang and Bekaert (2002; 2004) allow ail parameters of the multivariate normal distribution to change with the regime. The extension of these models to a large number of series faces the above-mentioned curse of dimensionality. Since the switchiug variable is present in both the mar gins and the dependeiice function, separation of the likelihood function into two parts is not possible and the two-step estimation cannot be performed. Pelletier (2004) uses the same separation as in the CCC or DCC and introduces the regime switching variable only in the correlation coefficients. By doing so, he can proceed with the two-step procedure to estimate the model while limiting the number of parameters to be estimated.’3 We carry out a similar idea but for nonlinear dependence. Therefore, we separate the modeling of marginal distributions from the modeling of dependence
11The tau depcndence coefficients are easily defined through copula as rL 11mC and rL
2n—i+C(i---cs,i—cs)
lim
o—.O cr
‘2The models proposed by Rodriguez (2004) in lis analysis of contagion can reproducc asymmetric dcpendcnce butit cannot distinguish bctween skewncss arid asymmctry in the dependence structure. In fact, a change in regime produces both skewness and asymmetric dependence, two different features that must be characterized separately.
3Since Pelletier (2004) uses the normal distribution with constant mean, the resulting unconditional distribution
by using univariate GARCH models for the marginal distributions and introducing changes in
regime in the copula dependence structure. The pattern of the model with four variables (two
countries, two markets in oui following application) is illustrated in Figure 3a.
3.2 Specification of the Marginal Distributions
For marginal distributions, we use a MGARCH (1,1) model similar to Heston-Nandi (2000):
= + + c7,tz,; N (0, 1); i = 1,... ,4 (3.4)
= w + 43jcri +cj (zj,_i — (3.5)
The variables x1,t and x2,t represent the log returns of equities and bonds respectively for the
first country while X3,t and X4,t are the corresponding series for the second country; o denotes
the conditional variance of x, X, can be iuterpreted as the price of risk and captures potential asymmetries in the volatility effect.’4 In the Heston-Nandi (2000) interpretation, represents the interest rate.15 The parameters of the marginal distributions are grouped into one vector (5 ((5i, ,(54) , with 6 = X,,w,/3,cj,7).
3.3 Specification of the Dependence Structure
Our dependence model is characterized by two regimes, one Gaussian regime in which the de pendence is symmetric (CN) and a second regime that can capture the asymmetry in extreme dependence (CA). The conditional copula is given by:
C (U1,t,...,u4,t;N, A
Ist)
stCN (ÎL1,t, ...,u4,t;N) + (1 — st)CA (fit,...,u4;A) , (3.6)where ui,, = (x,t; (5j), with Ft denoting the conditional cumulative distribution function of xj, given the past observations. The variable s, follows a Markov chain with a time-invarying
4The condition /3 +cvc-y < 1 is sufficient to have the stationarity of the process with finite unconditional mean and variance (sce Heston and Nandi, 2000).
transitional probability matrix
(P 1P
M = ; = Pr(St = 1
Isi
= 1) andQ
= Pr(st = OIst_i
= 0) (3.7)\\1-QQ
)
The normal regime (St = 1) corresponds to the symmetric regime where the conditional joint normality can be supported and the asymmetric regime (St O) corresponds to the asymmetric
regime in which markets are strongly more dependent for large asymptotic negative returns than for large positive returns.
The Gaussian copula CN is defined straightforwardly by (2.1) where the joint distribution
F is the 4-dimensional normai cumulative distribution function with ail diagonal elements
of the covariance matrix equal to one, i.e. CN (ni, •,;pN)
= FN
(—
(n1), ..., I’ (na)), whereF is the univariate standard normal cumulative distribution function.
The asymmetric components of the copula are illustrated in figure 3b. The first one is char acterized by independence between the two countries, but possibly extreme dependence between equities and bonds for each country. The second one is characterized by independence between equity and bond markets but allows for extreme dependence between equity returns and bond returns separately. The third one allows for possible extreme dependence between bonds in one country and equities in another country but supposes indepeudence for the rest.
Formally the asymmetric copula is the mixture of these three components and is expressed as follows
CA (u1, ...,u4;pA) Tr;Cs (ni,u2;rf) x C& (u3,u4;r)
+ir2C
(nl,u3;rj) X C (n2,U4T) (3.8)+ (1 — ri — Tr2)CGS (n1, 114; r) x CGS (112,113;T)
with = (Trl,7r2,rf,r,rk,r,rk,rk), and the bivariate component is the Gumbel survival copula given by