Science Arts & Métiers (SAM)
is an open access repository that collects the work of Arts et Métiers Institute of Technology researchers and makes it freely available over the web where possible.
This is an author-deposited version published in: https://sam.ensam.eu
Handle ID: .http://hdl.handle.net/10985/17972
To cite this version :
Benoît BESSEAU, Guillaume POT, Joffrey VIGUIER, Robert COLLET - Assessment of the error of fiber orientation measurement obtained by laser scanning on several European hardwood and softwood species In: Computational methods in wood mechanics, Suède, 20190617
-Computational methods in wood mechanics - 2019
Any correspondence concerning this service should be sent to the repository Administrator : archiveouverte@ensam.eu
Assessment of the error of fiber orientation measurement obtained by laser scanning
on several European hardwood and softwood species
Benoît BESSEAU†‡*, Guillaume POT†, Joffrey VIGUIER†, Robert COLLET†
†LaBoMaP, Arts et Métiers, Cluny, France, benoit.besseau@ensam.eu
‡
Ducerf groupe, Charolles, France
Scanner measurements allow knot detection and machine strength grading on sawn timber, which answers the construction and sawmilling industry needs at high production rates. In particular, laser scanners measure fiber orientation by means of the so-called tracheid effect explained by the fact that the wood fibers conduct concentrated light better in the direction of fibers than across. Schlotzhauer et al. [1] showed that a red laser scanner (660 nm, 100 mW) is very effective on softwood species like spruce but ineffective on many hardwood species like oak. However, the LaBoMaP has recently developed a fiber orientation scanner effective on hardwood species, especially oak [2]. It is, to the best of authors’ knowledge, the first to use a laser wavelength of 1064 nm and a modulable power (up to 1 W). Assessing the fiber orientation measurement error is important for strength grading purposes. Hu et al. [3] did this work for sugi and Japanese beech species. To the best of authors’ knowledge, there is no such study focusing on European species as oak, beech, Douglas fir, spruce, etc. Furthermore, [3] and other similar studies focused only on the angle of the major axis of the elliptically scattered laser light, while other geometric parameters as the size or minor to major axis ratio of this ellipse are interesting to study. They also did not discuss the intensity of the tracheid effect between species, nor study the influence of laser power.
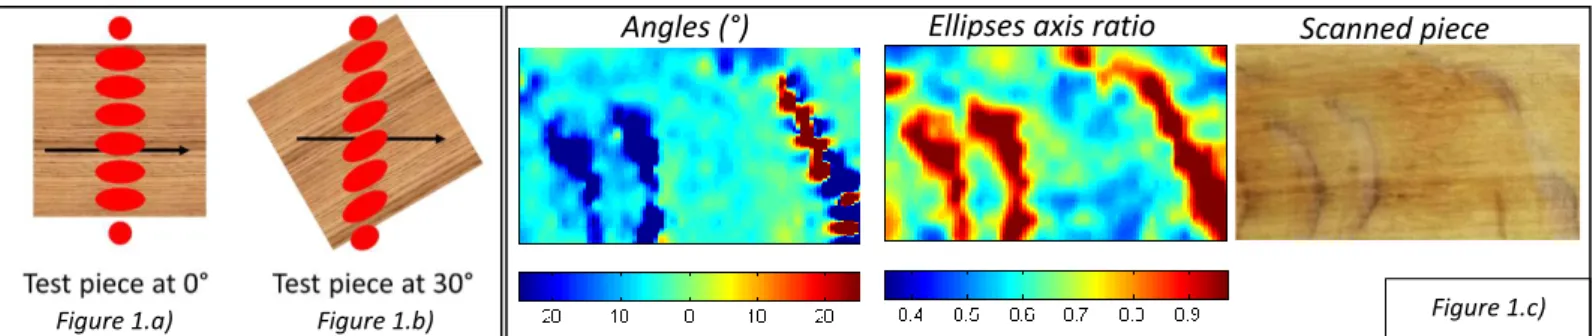
In the present work, not only the fiber orientation measurement error is assessed on several European hardwood and softwood species, but a method to measure the intensity of the tracheid effect according to the species and wood cutting plane (radial-longitudinal or tangential-longitudinal) is also proposed, and several underlying artefacts of the tracheid effect are discussed. To achieve this, clear wood test pieces were first scanned at a 0° orientation (figure 1a). Paying attention to the power of the lasers to be able to make comparison between species, ellipse geometrical parameters were compared to that obtained on an isotropic surface. In a second time, test pieces were scanned at different orientations from 0° to 90°. The measurement error was defined as the difference of mean scanned fiber angle on each iteration and test piece angle between these same iterations.
Results showed that fiber orientation measurement was possible on hardwood species with the LaBoMaP laser scanner. Indeed, ellipses axis ratio observed were distinct enough from that of an isotropic surface. However, for certain species like oak the axis ratio can be highly affected by the parenchymal cells when being in the radial-longitudinal plane (figure 1c). The second part of the experiment showed that measurement error can be less than one degree. The comparisons of the results between species and cutting planes will be presented at the conference.
Figure 1: a) & b) laser scanning on the same piece at 0° and 30°. c) Example of angles and axis ratio maps for oak quarter sawn
Acknowledgement
The authors thank the regional council of Bourgogne Franche-Comté and Ducerf Groupe.
References
[1] P. Schlotzhauer, F. Wilhelms, C. Lux, S. Bollmus: Comparison of three systems for automatic grain angle determination on European hardwood for construction use. European Journal of Wood and Wood Products, 76 (2018), 911-923.
[2] A. Olsson, G. Pot, J. Viguier, Y. Faydi, J. Oscarsson: Performance of strength grading methods based on fibre orientation and axial resonance frequency applied to Norway spruce (Picea abies L.), Douglas fir (Pseudotsuga menziesii (Mirb.) Franco) and European oak (Quercus petraea (Matt.) Liebl./Quercus robur L.). Annals of Forest Science, 75 (2018).
[3] C. Hu, C. Tanaka, T. Ohtani. On-line determination of the grain angle using ellipse analysis of the laser light scattering pattern image. Journal of Wood Science, 50 (2004), 321‑326.
Scanned piece Ellipses axis ratio
Angles (°)