HAL Id: hal-01113532
https://hal.inria.fr/hal-01113532
Submitted on 5 Feb 2015
HAL is a multi-disciplinary open access
archive for the deposit and dissemination of
sci-entific research documents, whether they are
pub-lished or not. The documents may come from
teaching and research institutions in France or
abroad, or from public or private research centers.
L’archive ouverte pluridisciplinaire HAL, est
destinée au dépôt et à la diffusion de documents
scientifiques de niveau recherche, publiés ou non,
émanant des établissements d’enseignement et de
recherche français ou étrangers, des laboratoires
publics ou privés.
Mining Event Logs to Assist the Development of
Executable Process Variants
Ngoc Chan Nguyen, Karn Yongsiriwit, Walid Gaaloul, Jan Mendling
To cite this version:
Ngoc Chan Nguyen, Karn Yongsiriwit, Walid Gaaloul, Jan Mendling. Mining Event Logs to Assist the
Development of Executable Process Variants. 26th International Conference on Advanced Information
Systems Engineering, Jun 2014, Thessaloniki, Greece. pp.548 - 563, �10.1007/978-3-319-07881-6_37�.
�hal-01113532�
Mining Event Logs to Assist the Development of
Executable Process Variants
Nguyen Ngoc Chan1, Karn Yongsiriwit2, Walid Gaaloul2, and
Jan Mendling3
1
Universit´e de Lorraine, Loria UMR 7503, France
2
Telecom SudParis, Samovar UMR 5157, France
3
Institute for Information Business
Wirtschaftsuniversit¨at Wien (WU Vienna), Austria
Abstract. Developing process variants has been proven as a principle
task to flexibly adapt a business process model to different markets. Con-temporary research on variant development has focused on conceptual process models. However, process models do not always exist, even when process logs are available in information systems. Moreover, process logs are often more detailed than process models and reflect more closely to the behavior of the process. In this paper, we propose an activity rec-ommendation approach that takes into account process logs for assisting the development of executable process variants. To this end, we define a notion of neighborhood context for each activity based on logs, which captures order constraints between activities with their occurrence fre-quency. The similarity of the neighborhood context between activities provides us then with a basis to recommend activities during the process of creating a new process model. The approach has been implemented as a plug-in for ProM. Furthermore, we conducted experiments on a large collection of process logs. The results indicate that our approach is feasible and applicable in real use cases.
Keywords: process mining · business process design · neighborhood
context · context matching
1
Introduction
A process variant is an adjustment of a business process to flexibly adapt the business model to a specific context. Enterprises or organizations usually need to support many variants of the same process due to constraints from regulations, geography, religion, etc. For example, car rental companies, such as Hertz, Avis or Sixt, need to customize their reservation process to follows laws in a country or culture of a region. Suncorp, one of the largest Australian insurance group, has developed more than 30 different variants of the process of handling an insurance claim [32].
In recent years, there have been many efforts on facilitating the development of business process variants such as (i) using available reference models to be individualized to fit the requirements [31, 14], or (ii) finding existing similar
models to inspire the new process design [35, 4, 15]. However, the design with reference models is still labor-intensive, which is often the cause for error-prone and time-consuming design [3]. Meanwhile, recommending entire process models costs much computation time, especially when the number of activities is large. Large models are also not handy for a designer who needs to pick a specific piece of functionality from them. In this context, it is desirable to recommend only a small but well-selected set of activities in order to help the designer.
Prior research has emphasized the advantages of recommendations during process model design [21, 11–13]. However, business process models do not al-ways exist in large-scale information systems such as ERP, CRM, or workflow management systems [1], even when process logs are available. Executable pro-cess models also require detailed technical activities to be recommended, while conceptual process models often describe processes in a coarse-granular way [6]. Moreover, process models do not explicitly show the importance of activities or connection flows, which can be a valuable parameter to compute more precisely the similarity between two activities. Meanwhile, this information is recorded in process event logs in the form of traces and their frequency.
In this paper, we propose an approach that builds upon process event logs for making activity recommendations during the development of executable process variants. We examine the relation between activities based on their execution order and frequency as recorded in logs. We define the notion of a neighborhood context of an activity as a fragment of the log-based model that contains the considered activity and relations to its neighbors. Relations between activities and their occurrence frequency provide the basis for the computation of the similarity between activities. In the process design phase, this similarity is used to recommend activities which might be closely related to the one that has just been added to the model.
The rest of the paper is organized as follows. Section 2 presents an example that motivates our approach. Section 3 continues with the process model and the neighborhood context graph extracted from logs. Section 4 defines the recom-mendation approach. Section 5 presents the implementation and experimental results. Section 6 discusses related work before Section 7 concludes the paper.
2
Motivating example
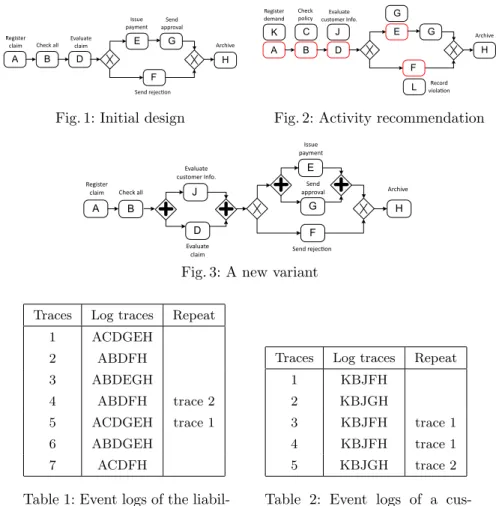
Consider a process designer who is about to develop a new variant of a liability claim process of an insurance company (inspired from[28]). She starts her work by either retrieving an existing process or quickly designing a new one based on her experiences (Fig. 1): first, some data related to the claim is registered (cf. activity A), and then a full check is performed (B). Afterwards, the claim will be evaluated (D), and then it is either rejected (F) or approved (E and G). Finally, the case is archived and closed (H ).
To develop a new variant, the designer may need recommendations for certain positions of the current process. Our approach assist her by providing recom-mended activities for at each selected position. For example, in Fig. 2, K is recommended for A, C is recommended for B and so on. These
recommenda-tions possibly help her easily have new ideas to design a new process variant, for instance, as given in Fig. 3.
A B D
Register
claim Check all Evaluateclaim G
F H Issue payment Send rejec�on Archive E Send approval
Fig. 1: Initial design
A B D Check policy G F H Archive E C J Evaluate customer Info. Record viola�on G L K Register demand
Fig. 2: Activity recommendation
A B E G F H J D Register claim Check all Evaluate claim Issue payment Send rejec�on Archive Evaluate customer Info. Send approval
Fig. 3: A new variant
Traces Log traces Repeat
1 ACDGEH 2 ABDFH 3 ABDEGH 4 ABDFH trace 2 5 ACDGEH trace 1 6 ABDGEH 7 ACDFH
Table 1: Event logs of the liabil-ity claim process ([28])
Traces Log traces Repeat
1 KBJFH
2 KBJGH
3 KBJFH trace 1
4 KBJFH trace 1
5 KBJGH trace 2
Table 2: Event logs of a cus-tomer subscription process
Recommendations for each activity are made based on their similarity. The computation of this similarity can be based on process event logs even when a a-priori process model is not available.
To elaborate the steps to recommendations in our approach, we use the exam-ple of a liability claim process within an insurance company that was presented in [28] and another example of a customer subscription process. Table 1 and Table 2 present the process event logs of these processes. Each process instance is recorded as a trace. Each trace is a sequence of activities, which presents their execution order within a process instance. In a trace, the following activity (ac-tivity on the right) is performed after the followed ac(ac-tivity (ac(ac-tivity on the left). For example, consider a trace σ = ABCD, activity B is performed after activity A and before activity C. The third column of Table 1 and Table 2 presents the repetition of a trace that was previously executed.
In the following, we present an approach to build log-based business process models based on process event logs. These models provide the basis for defining a notion of activity neighborhood context, which we utilize for computing the similarity between activities.
3
Exploiting activity neighborhood context from logs
In this section, we present the log-based business process and the neighbor-hood context that are captured from business process logs. We firstly present some definitions related to business process logs (section 3.1). Then, we present definitions of the log-based business process (section 3.2) and the activity neigh-borhood context (section 3.3).
3.1 Preliminaries
According to [1] and [29], a business process log is defined as follows.
Definition 1 (Log trace, business process log, L). Let A be a set of
activ-ities. A∗ denotes the set of finite sequences over A and σ = a1a2. . . a
n ∈ A∗ is
a log trace. L ∈ P(A∗) is a business process log4.
As explained in [1, 29], a business process log does not consider the repetition of a trace. For example, in Table 1, L includes only traces 1, 2, 3, 6 and 7. Traces 4 and 5 are excluded by L as they repeat traces 2 and 1. In our approach, we extend Definition 1 to define the full business process log (see Definition 2) that includes all log traces.
Definition 2 (Full business process log, L∗). A full business process log is
the business process log that includes all executed traces. The full business log is
denoted by L∗, L∗∈ P∗(A∗). L ⊆ L∗.
For example, in Table 1, L∗ includes all traces from 1 to 7. In Table 2, L∗
includes all traces from 1 to 5, while L includes only trace 1 and 2.
Definition 3 (Log-based ordering relation, >L). Let L be a business
pro-cess log over A, i.e., L ∈ P(A∗). Let a, b ∈ A. a >
L b iff ∃σ = a1a2. . . an,
i∈ {1, 2, . . . , n − 1}: σ ∈ L ∧ ai= a ∧ ai+1 = b.
For example, from the logs given in Table 1, we have A >L B, A >L C,
C >LD, B >LD, and so on.
3.2 Log-based business process
The sequence of activities in a log trace σ = a1a2. . . an ∈ A∗ presents their
ordering relations. A relation between an activity ai and its followed activity
ai+1 in the trace σ, 1 ≤ i ≤ n − 1 can be presented as a directed edge from ai
to ai+1. The activity relations in a business process log L can be presented as a
weighted directed graph where the edge’s weight presents the number of times that the edge was repeated in the log L. This graph is called log-based business process graph (Definition 4).
4
Definition 4 (Log-based business process graph). A log business process
graph is a weighted directed graph GL= (VL, EL, w) built from a business process
log L∗∈ P∗(A∗) where:
– VL= A = {a1, a2, . . . , an},
– EL= {(ai, aj) ∈ A × A : ai>Laj} ⊆ A × A,
– w is a weight function from EL to N :
w: EL −→ N
(ai, aj) 7→ |ai>Laj|
|ai>Laj| is number of times that ai>Laj comes about in the log L∗
w(ai, aj) = 0 if ∄σ = a1a2. . . an, k ∈ {1, 2, . . . , n − 1} : ak = ai∧ ak+1= aj
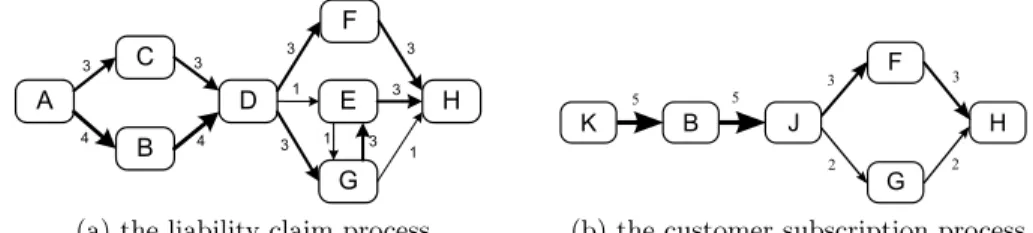
For example, the log-based business process graphs of the event logs given in Table 1 and Table 2 are depicted in Fig. 4. The weight of each flow is the number of times that the flow is executed. It is emphasized by the arrow’s thickness.
A B C E D G F H 3 4 4 3 3 3 1 3 1 3 1 3
(a) the liability claim process
K B J G F H 5 5 3 2 3 2
(b) the customer subscription process Fig. 4: Log-based business process graphs
The log-based graph presents the execution of a business process in reality, regardless its conceptual model. The weights of edges present their execution frequency which indicates the strength of relations between activities. In the following, we present our approach to build the neighborhood context of an activity based on these relations.
3.3 Log-based neighborhood context
We define the log-based neighborhood context as a directed labeled graph that presents the shortest path from an activity to its neighbors. Intuitively, the closeness between activities is presented by the paths connecting them. The shortest path between activities presents their closest relation. The log-based neighborhood context of an activity presents the best relations between the activity and its neighbors.
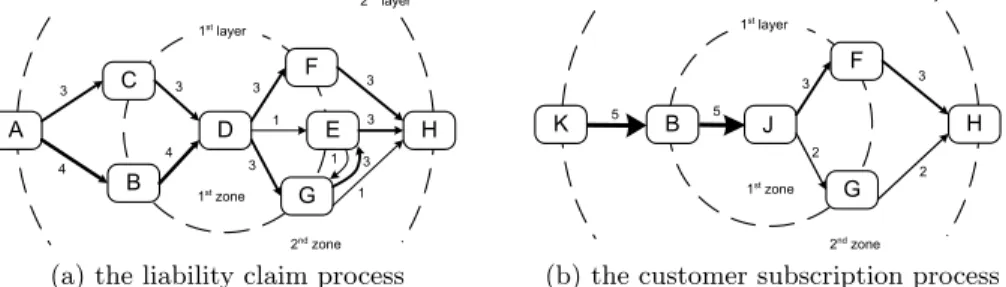
In a log-based neighborhood context graph, each vertex is associated to a number that indicates the shortest path length from it to the associated activ-ity. Vertexes that have the same shortest path length are considered to be located on the same layer around the associated activity. Thus, we name the number
associated to each activity in a neighborhood context graph layer number. The layer number of an activity a is denoted by l(a). The area limited between two adjacent layers is called zone. The edge connecting two vertexes in a neighbor-hood context graph belongs to a zone as the vertexes are on the same or adjacent layers. We assign to each edge a number, so-call zone number, which determines the zone that the edge belongs to.
The edge connecting aj, ak in the neighborhood context graph of an activity
ai is assigned a zone number z(aj, ak) = min(l(aj), l(ak)) + 1. This means, if aj
and ak are located on two adjacent layers, the edge (aj, ak) will belongs to the
zone limited by l(aj) and l(ak). In the case that aj and ak are located on the
same layer, the edge connecting them belongs to the outer zone of their layer,
which is limited by layers l(aj) and l(aj) + 1.
Definition 5 (Activity neighborhood context graph). The neighborhood
context graph of an activity ai, denoted by GC(ai), is an extension of the log-based
graph GL= (VL, EL, w) with vertex layer numbers and edge zone numbers. The
layer number of an vertex aj, denoted by l(aj)GC(ai), is the shortest path length
from aj to aiand the zone number of an edge (aj, ak), denoted by z(aj, ak)GC(ai),
has value min(l(aj)GC(ai), l(ak)GC(ai)) + 1:
1. l(aj)GC(ai)= ShortestP athLength(aj, ai),
2. z(aj, ak)GC(ai)= min(l(aj)GC(ai), l(ak)GC(ai)) + 1, aj>Lak∨ ak>Laj. For example, the neighborhood context graphs of activity D and J in Fig. 4 are depicted in Fig. 5.
A B C E D G F H 1st layer 2nd layer 1st zone 2nd zone 3 4 3 4 3 1 3 1 3 3 3 1
(a) the liability claim process
K B J G F H 1st zone 2nd zone 1st layer 2nd layer 5 3 2 5 3 2
(b) the customer subscription process Fig. 5: Neighborhood context graphs of the given event logs
Definition 6 (kth-neighbor). a is the kth-neighbor of b, iff l(a)
GC(b)= k. Set
of kth-neighbors (k ≥ 1) of an activity a
i is denoted by Nk(ai). Nk(ai) = {aj :
l(aj)GC(ai)= k}.
For example, in Fig. 4a, N1(A) = {B, C}, N2(A) = {D}, N3(A) = {F, E, G},
N1(D) = {C, B, F, E, G}, N2(D) = {A, H}, N3(D) = ∅, and so on.
4
Activity recommendation based on neighborhood
context matching
The layer number and the zone number in a neighborhood context graph present the closeness between activities, while the weights of edges in the log-based graph
present the strength of their relations. In this section, we detail our approach with log-based neighborhood context matching and activity recommendation.
4.1 Neighborhood context matching
To compute the matching between two neighborhood contexts, we (1) compute the matching of their edges in each zone, (2) multiply this matching with a zone-weight value and (3) sum up the matching in all zones.
We apply the vector space model (VSM) to compute the matching of edges in each zone of two neighborhood context graphs. VSM is a common technique used in Information Retrieval to compute the similarity between two items. It presents items in vectors and compute their similarity based on the cosine of the angle between the two corresponding vectors. In our approach, we present each zone as a vector of which elements are edges and values are their corresponding weights. Then, we align elements that connect the same activities in the same layers. Next, we present these vectors in the same space by filling 0 values in corresponding positions of the unaligned elements. Finally, we compute the cosine value of these two zone-vectors.
Particularly, in the first zone, we match the edges that connect the two associated activities to the same activities in the first layer. To formalize our computation, we define the two associated activities as root activities and name
them r0.
Concretely, assume that Pp and Pq are two log-based business processes
con-structed from event logs Lp and Lq. Let Ap, Aq be sets of activities of Pp and
Pq respectively. We compute the similarity between activities a ∈ Apand b ∈ Aq
by applying VSM as following. Let Ek Pp(a) and E k Pq(b) be sets of edges in k th-zone of a ∈ P p and b ∈ Pq
respectively. Let−−→e(a),−−→e(b) be corresponding zone vectors.
EkPp(a) = {(x, y) : z(x, y) = k, x, y ∈ Ap} = {(x1, y1), (x2, y2), . . . , (xm, ym)} −−→ e(a) = (w(x1, y1), w(x2, y2), . . . , w(xm, ym)) EPkq(b) = {(e, f) : z(e, f) = k, e, f ∈ Aq} = {(e1, f1), (e2, f2), . . . , (en, fn)} −−→
e(b) = (w(e1, f1), w(e2, f2), . . . , w(en, fn))
Let Nk−1
c (a, b) and Nck(a, b) be the sets of common neighbors of a and b on
layers k − 1 and k, k > 0. We have:
Nck−1(a, b) = NPk−1p (a) ∩ NPk−1q (b)
Nck(a, b) = NPkp(a) ∩ N
k Pq(b)
As we define the two associated activities as root activities and name them
r, we have: N0 Pp(a) = a = r0, N 0 Pq(b) = b = r0 and N 0 c(a, b) = r0.
Let Ek
c be the set of common edges of a and b in kth-zone.
Eck = {(r, t) : (r ∈ Nk−1
c (a, b), t ∈ Nck(a, b)|r >Lpt∧ r >Lq t)
∪(r ∈ Nck(a, b), t ∈ Nck−1(a, b)|r >Lpt∧ r >Lq t)}
= {(r1, t1), (r2, t2), . . . , (rm, tm)}
Let−−−→ec(a),−−→ec(b) be vectors of weights of these common edges.
−−−→
ec(a) = (w(r1, t1), w(r2, t2), . . . , w(rz, tz)), (ri, ti) ∈ EL(Ap), 1 ≤ i ≤ z
−−→
ec(b) = (w(r1, t1), w(r2, t2), . . . , w(rz, tz)), (ri, ti) ∈ EL(Aq), 1 ≤ i ≤ z
By applying VSM, the similarity between a and b in the kthzone is given by
Equation. 1.
Mk(a, b) =
−−−→ ec(a) ·−−→ec(b)
|−−→e(a)| × |−−→e(b)| (1)
For example, we have: the common neighbors of D and J in the 1st-layer
are N1
c(D, J) = {F, G, B}. So,
−−−→
ec(D) = (w(D, F ), w(D, G), w(B, D)) = (3, 3, 4),
−−−→
ec(J) = (w(J, F ), w(J, G), w(B, J)) = (3, 2, 5) and their matching in the 1st-zone
is:
M1(D, J) = √ 3 × 3 + 3 × 2 + 4 × 5
32+ 12+ 32+ 32+ 42×√32+ 22+ 52 = 0.86
In the 2nd-zone, we have the common edges of these two context graphs are:
(F, G) and (G, H). So, their matching in this zone is:
M2(D, J) = √ 3 × 3 + 1 × 2
32+ 42+ 32+ 32+ 12+ 12+ 32×√52+ 32+ 22 = 0.24
The behavior of an activity is strongly reflected by the connections to its closet neighbors. Therefore, we propose to consider a zone weight in our
match-ing. Concretely, as the zone-weight has to have greater values in smaller kth
connection zone, we propose to assign the zone-weight a value computed by
a polynomial function which is wz
j =
k+ 1 − j
k , where j is the zone number
(1 ≤ j ≤ k), k is the number of considered zones around an associated activ-ity. The closest zone to the associated activity has a weight 1 and the farthest
zone has a weight 1
k. The final matching formula improved with the zone weight
consideration is given in Equation 2.
M∗(a, b) = 2 k+ 1 × k X i=1 k+ 1 − i k × M i(a, b) (2)
For example, the matching between the neighborhood contexts of D and J (in 2 zones) with zone weights is:
M∗(D, J) =2 3 × (M 1(D, J) +1 2 × M 2(D, J)) = 2 3 × (0.86 + 1 2× 0.24) = 0.65
4.2 Activity recommendation
The neighborhood context graph presents the interactions between the ated activity and its neighbors in layers. It can infer the behavior of the associ-ated activity. Therefore, the matching between neighborhood context graphs ex-poses the similarity between the associated activities. In our approach, the higher the matching value is, the more similar the activities are. Basically, the steps to make recommendations based on log-based neighborhood context matching are: 1. We represent the business execution logs in a log-based graph. This graph
contains relations between activities and their weight values.
2. For each activity in the log-based graph, we build a neighborhood context graph which contains the closet relations between the associated activity and its neighbors. In a neighborhood context graph, activities are presented in layers and relations between them are presented in zones.
3. We compute the matching between neighborhood context graphs using vec-tor space model. This matching presents the similar between two correspond-ing activities in terms of relations to their neighbors.
4. Finally, for a selected activity, we sort other activities in descending order of similarity and pick up top-n activities for recommendation.
4.3 Computational complexity
In our approach, only the connection flows connecting common neighbors in two adjacent layers are taken into account for the matching computation. So, by using queues (data structure) to store the common neighbors and track them from the nearest layers to the furthest layers, we avoid the redundant checking of unrelated neighbors. On the other hand, the number of activities as well as the number of
common neighbors in a log-based business process are not great5, our algorithm
can run fast in computing the neighborhood context matching of two activities.
The worst case of this algorithm’s computation time is O(nA× nP × n × k),
where nA is the number of activities, nP is the number of business processes, n
is the maximum number of common activities located on a layer and k is the number of considered layers. The worst case only happens when all the business processes in the system are entirely matched. In addition, the performance of the algorithm can be improved by processing the neighborhood context matching periodically off-line.
5
Implementation and experiments
To validate our approach, we implement a tool that generates recommendations based on business process logs. We also perform experiments on a large pub-lic dataset shared by the IBM Business Integration Technologies (BIT) team. Details of our implementation (section 5.1) and experiments (section 5.2) are presented as follows.
5
On making statistics on the public dataset used in our experiment, we have that in average, there are 11.36 services in a business process (section 5)
5.1 Implementation
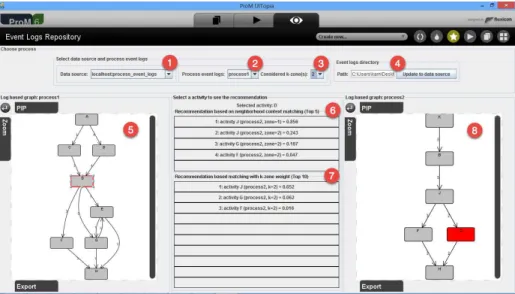
Fig. 6: A screen shot of the log-based activity recommendation application We implemented an activity recommendation plug-in and integrated it into ProM. This plug-in interacts with either a database or log files to retrieve
recom-mendations for each selected activity in the ProM interface. This application6
was developed to validate our approach as a proof of concept.
The screen-shot of our application is shown in Fig. 6. It includes of 8 ar-eas. Areas 1 and 4 allow selecting event log resources, which can be either from a database or a log files directory. The designer selects a working process in area 2 and specifies a zone number to be considered by the algorithm in area 3. The working process is shown in area 5. The designer can select an activity in the working process to obtain recommendations. Area 6 shows the top-5 rec-ommended activities without zone-weight in the computation. Meanwhile, area 7 shows the top-10 recommended activities with zone-weight consideration. If the designer selects a recommended activity in area 6 or 7, this activity and its involved process will be shown in area 8 (the selected activity is highlighted).
5.2 Experiments
A big challenge of our approach is the availability of real business process logs. We attempted to search and contact other research groups for both public and private logs. However, process event logs are not published or they are not under a disclosure agreement. There are very few logs that are shared for the
competi-tion of the BPI challenge7. But they are not usable in our approach as they are
just logs of one business process while we need logs of several different processes.
6
published at: http://www-inf.it-sudparis.eu/SIMBAD/tools/LogRec/
7
We performed experiments on logs generated from real business processes. Data of these processes were shared by the IBM Business Integration Tech-nologies (BIT) team. This dataset includes 735 different processes in Petri net Markup Language (PNML) format. These processes are designed for insurance, banking, customer relationship, as well as construction and automotive supply chain domains [20].
We transformed the collected business process models from PNML format
to the Colored Petri Net (CPN) format. Then, we used CPN Tools8 to load the
transformed process models to generate process event logs, which are resulted in XES files. Finally, these log files were imported by our application, which is a ProM plugin, to display the log-based business process graphs, compute the similarity between activities and show recommendations (as presented in Fig. 6). Details of the log-based dataset is given in Table 3.
Min. Max. Average
Number of process instances of a process model 50 299 189.88
Number of occurring events in a process 31 8283 1004.15
Number of events in a process 2 64 9.02
Number of start events in a process 1 5 1.11
Number of end events in a process 1 13 2.56
Table 3: Details of the dataset in XES format
We perform two experiments to evaluate the feasibility and the accuracy
of our approach. In the first experiment, we vary the kth-zone values from 1
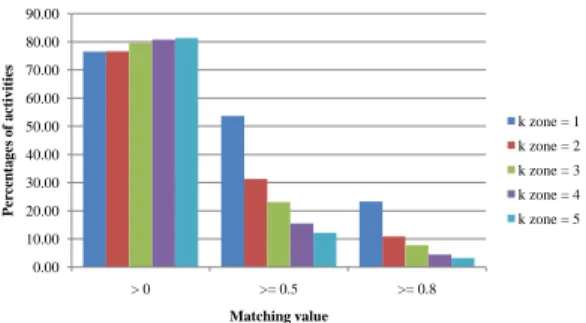
to 5 and make statistics on the number of recommended activities for each selected activities. Fig. 7 shows the percentage of activities that have at least 1 recommended activity with the similarity value is greater than 0, 0.5 and 0.8.
0.00 10.00 20.00 30.00 40.00 50.00 60.00 70.00 80.00 90.00 > 0 >= 0.5 >= 0.8 Percentages of act ivi ti es Matching value k zone = 1 k zone = 2 k zone = 3 k zone = 4 k zone = 5
Fig. 7: Percentage of activities that have at least one recommended activity with the similarity value greater than 0, 0.5 and 0.8.
Concretely, we obtained that more than 76.56% activ-ities that have at least one similarity value greater than 0 with k varies from 1 to 5. With k = 1, we obtained 53.68% activities with simi-larity value greater than 0.5 and 23.31% activities with similarity value greater than 0.8. These results show that our approach can provide rec-ommendations for a majority activities as we can retrieve
8
CPN Tools is an application to generate synthetic process event logs from models described in CPN format. It is available at: http://cpntools.org/
similar activities for more than 3/4 number of activities in average. It means that our approach is feasible and can be applied in real use-cases.
In the second experiment, we evaluate the accuracy of our approach based on Precision and Recall metrics. As our approach takes into account neighborhood contexts instead of activity identifiers, we consider activity identifiers as ground-truth data in computing Precision and Recall. Concretely, consider a selected activity a in a based business process P . Assume that a appears in n log-based business processes. The recommendations for this selected position consist of l activities, in which t(t ≤ l) activities are a. Precision and Recall of these recommendations are given by Equation 3.
P recision= t
l; Recall=
t
n (3)
The primary objective of the experiment is to retrieve a small share of ac-tivities that are likely irrelevant (high precision). It is of secondary importance to retrieve the full range of potentially relevant activities (moderate recall) in order to avoid the designer being overwhelmed.
In our experiment, we computed the Precision and Recall with l (number of activities recommended for each selected activity) equal to 1, 4, 7 and 10. We
performed the experiment with kth-zone=1 and on activities that appear in at
least 2, 5, 7 and 10 different business processes.
Activities with minimum occurrences of 2 are recommended
Activities with minimum occurrences of 5 are recommended
Activities with minimum occurrences of 7 are recommended
Activities with minimum occurrences of 10 are recommended
Top-1 Top-4 Top-7 Top-10
0.000 0.100 0.200 0.300 0.400 0.500 0.600 0.700
Top-N activities recommendation Precision values
Top-1 Top-4 Top-7 Top-10
0.000 0.050 0.100 0.150 0.200 0.250 0.300
Top-N activities recommendation Recall values
Fig. 8: Precision and Recall values of activities that are occurrence in at least 2,
5, 7 and 10 different processes, kth-zone=1 and l is equal to 1, 4, 7 and 10
5 4 3 2 1 0.000 0.100 0.200 0.300 0.400 0.500 Our approach Precision Random case Precision Our approach Recall Random case Recall k-zone number Pr ec ison an d R ec al lval ue s
Fig. 9: Average Precision and Recall values with different zone layers
Fig. 8 shows that we ob-tained good Precision values (from 0.42 to 0.59) in case of recommending 1 activity for each selected activity. These values decrease when we in-crease the number of rec-ommended activities. On the other hand, activities that ap-pear in more processes will have greater Precision values. It also shows that the Recall
values increase when l (or top-N) changes from 1 to 10. This means that we can retrieve more relevant activities when the number of recommended activities increases. The highest Recall value in our experiment is 0.264 when l=10.
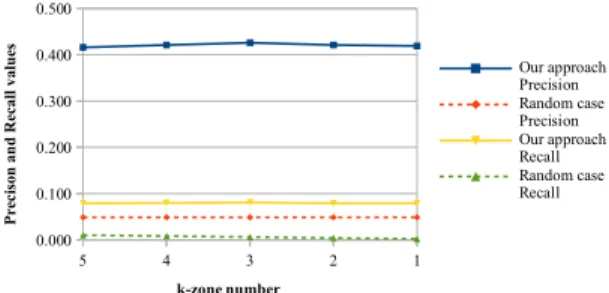
Fig. 9 shows the average Precision and Recall values of our approach with
different kth-zone values. It shows that our approach achieved much better results
than an approach that generates recommendations randomly (in average, 8.6 times greater the Precision value and 17.4 times greater the Recall value).
The Precision and Recall values showed that our approach retrieve not only the right activities but also new relevant activities for each selected position and the number of new activities increases when the number of recommended activities increases. These results showed that our approach can be applied in real use-cases as we can provide the designer the flexibility in using existing process fragments or designing new process variants.
6
Related work
Computing the similarity of two process models first requires the definition of a mapping between the activities using automatic matching techniques [17]. Prin-ciples for matching process models have been integrated in the ICoP frame-work [33] and extended with semantic matching techniques [23]. Applications in the area of supporting process model design adopt such semantic techniques, as for instance the approach based on the process descriptor space [25] and the rec-ommendation approach reported in [21]. Approaches to harmonize structure [27] and labels [24] were also proposed. Service recommendation [9, 10] can be also applied in the context of activity recommendation. Behavioral abstractions such as trace adjacency [5, 36] and weak order relations[19, 34] provide a means to compare process behavior [15, 22, 16]. These notions are applied, e.g., for iden-tifying connections between actions [30] comparable to our notion of activity neighborhood. Our approach builds on this observation to make recommenda-tions for executable processes. In addition, we focus on process fragments instead of the entire model. We recommend activities instead of process models and we do not face the computational complexity problem.
In our previous work [11–13], we exploited activity relations in process mod-els and we did not take into account the occurrence frequency of activities. In this work, we realize that knowledge from process logs can be also utilized for process design by applying process mining techniques. Different techniques have been defined for automatically discovering whole models from logs, e.g. [1, 26, 18]. The automatic matching between event logs and process models is discussed in [6] showing that logs on the execution level are often much more detailed than models. The challenge of process mining is the observation that process models often turn out to be overwhelmingly complex, so-called spaghetti models [2]. The approach reported in this paper helps to present correlations between activities in a context-specific way, which allows us to hide the complexity of the behavior. Hidden knowledge in process event logs are discovered for assisting business pro-cess design. In this way, we complement log-based recommendation approaches to support process designers at runtime [7] or at configuration time [8].
7
Conclusion
In this paper, we addressed the challenge of supporting the designer during the act of modeling, even in cases where no comparable process models ex-ist. We present an approach that effectively utilizes knowledge extracted from business process logs for recommending activities. This approach is based on a notion of activity neighborhood and a corresponding calculation of similarity. The approach has been implemented as a plug-in for ProM and evaluated using generated log data of 735 processes from practice.
In future work, we aim to extend the similarity calculation with other prop-erties of an activity such as descriptions, actors, resources and dependencies. We also plan to integrate our neighborhood matching technique with a specific query language to help to retrieve activities that have similar contexts based on a requested activity context.
References
1. van der Aalst, W., Weijters, T., Maruster, L.: Workflow mining: Discovering process models from event logs. Knowl. and Data Eng. (9), 1128–1142 (Sep 2004) 2. van der Aalst, W.M.P.: Process Mining - Discovery, Conformance and
Enhance-ment of Business Processes. Springer (2011)
3. Aalst, W., Lohmann, N., La Rosa, M., Xu, J.: Correctness ensuring process con-figuration: an approach based on partner synthesis. In: BPM. pp. 95–111 (2010) 4. Aalst, W., Medeiros, A., Weijters, A.: Process equivalence: Comparing two process
models based on observed behavior. In: BPM. pp. 129–144 (2006)
5. Bae, J., Liu, L., Caverlee, J., Zhang, L.J., Bae, H.: Development of distance mea-sures for process mining, discovery and integration. Int. J. Web Service Res. 4(4), 1–17 (2007)
6. Baier, T., Mendling, J.: Bridging abstraction layers in process mining by automated matching of events and activities. In: BPM (2013)
7. Barba, I., Weber, B., Valle, C.D., Ramirez, A.J.: User recommendations for the optimized execution of business processes. Data Knowl. Eng. 86, 61–84 (2013) 8. Buijs, J.C.A.M., van Dongen, B.F., Aalst, W.M.P.: Mining configurable process
models from collections of event logs. In: BPM ’13 (2013)
9. Chan, N.N., Gaaloul, W., Tata, S.: Web services recommendation based on user’s behavior. In: ICEBE. pp. 214 –221 (nov 2010)
10. Chan, N.N., Gaaloul, W., Tata, S.: A web service recommender system using vector space model and latent semantic indexing. In: AINA. pp. 602 –609 (2011) 11. Chan, N.N., Gaaloul, W., Tata, S.: Composition context matching for web service
recommendation. In: SCC. pp. 624–631 (2011)
12. Chan, N.N., Gaaloul, W., Tata, S.: Context-based service recommendation for assisting business process design. In: EC-Web ’11, pp. 39–51 (2011)
13. Chan, N.N., Gaaloul, W., Tata, S.: Assisting business process design by activity neighborhood context matching. In: ICSOC (2012)
14. Curran, T., Keller, G., Ladd, A.: SAP R/3 business blueprint: understanding the business process reference model. Upper Saddle River, NJ, USA (1998)
15. Dijkman, R., Dumas, M., Garcia-Banuelos, L.: Graph matching algorithms for business process model similarity search. In: BPM. pp. 48–63 (2009)
16. Dijkman, R.M., van Dongen, B.F., Dumas, M., Garc´ıa-Ba˜nuelos, L., Kunze, M., Leopold, H., Mendling, J., Uba, R., Weidlich, M., Weske, M., Yan, Z.: A short sur-vey on process model similarity. In: Seminal Contributions to Information Systems Engineering. Springer (2013)
17. Ehrig, M., Koschmider, A., Oberweis, A.: Measuring similarity between semantic business process models. In: Conceptual Modelling 2007, APCCM2007. CRPIT, vol. 67, pp. 71–80. Australian Computer Society (2007)
18. Engel, R., van der Aalst, W., Zapletal, M., Pichler, C., Werthner, H.: Mining inter-organizational business process models from edi messages: A case study from the automotive sector. Advanced Inf. Sys. Engineering (2012)
19. Eshuis, R., Grefen, P.W.P.J.: Structural matching of bpel processes. In: ECOWS 2007. pp. 171–180. IEEE Computer Society (2007)
20. Fahland, D., Favre, C., Jobstmann, B., Koehler, J., Lohmann, N., V¨olzer, H., Wolf,
K.: Instantaneous soundness checking of industrial business process models. In: 7th BPM. pp. 278–293 (2009)
21. Hornung, T., Koschmider, A., Lausen, G.: Recommendation based process model-ing support: Method and user experience. In: ER ’08. pp. 265–278 (2008) 22. Kunze, M., Weske, M.: Metric trees for efficient similarity search in large process
model repositories. In: zur Muehlen, M., Su, J. (eds.) BPM Workshops. Lecture Notes in Business Information Processing, vol. 66. Springer (2010)
23. Leopold, H., Niepert, M., Weidlich, M., Mendling, J., Dijkman, R., Stuckenschmidt, H.: Probabilistic optimization of semantic process model matching. In: BPM (2012) 24. Leopold, H., Smirnov, S., Mendling, J.: On the refactoring of activity labels in
business process models. Inf. Syst. 37(5), 443–459 (2012)
25. Lincoln, M., Golani, M., Gal, A.: Machine-assisted design of business process mod-els using descriptor space analysis. In: BPM. pp. 128–144 (2010)
26. Maggi, F., Bose, R., Aalst, W.: Efficient discovery of understandable declarative process models from event logs. In: Advanced Information Systems Engineering, vol. 7328, pp. 270–285. Springer Berlin Heidelberg (2012)
27. Polyvyanyy, A., Garc´ıa-Ba˜nuelos, L., Dumas, M.: Structuring acyclic process
mod-els. Inf. Syst. 37(6), 518–538 (2012)
28. Rozinat, A., Mans, R.S., Song, M., van der Aalst, W.M.P.: Discovering colored petri nets from event logs. Int. J. Softw. Tools Technol. Transf. (1), 57–74 (2007) 29. Schonenberg, H., Weber, B., Dongen, B., Aalst, W.: Supporting flexible processes
through recommendations based on history. In: BPM. pp. 51–66 (2008)
30. Smirnov, S., Weidlich, M., Mendling, J., Weske, M.: Action patterns in business process model repositories. Computers in Industry (2012)
31. Stephens, S.: Supply chain operations reference model version 5.0: A new tool to improve supply chain efficiency and achieve best practice. Information Systems Frontiers pp. 471–476 (December 2001)
32. Van Der Aalst, W.M.P.: Configurable services in the cloud: supporting variability while enabling cross-organizational process mining. In: OTM. pp. 8–25 (2010) 33. Weidlich, M., Dijkman, R., Mendling, J.: The icop framework: identification of
correspondences between process models. In: 22nd CAiSE. pp. 483–498 (2010) 34. Weidlich, M., Mendling, J., Weske, M.: Efficient consistency measurement based on
behavioral profiles of process models. IEEE Trans. Soft. Eng. 37, 410–429 (2011) 35. Yan, Z., Dijkman, R., Grefen, P.: Fast business process similarity search with
feature-based similarity estimation. In: OTM. pp. 60–77 (2010)
36. Zha, H., Wang, J., Wen, L., Wang, C., Sun, J.: A workflow net similarity measure based on transition adjacency relations. Computers in Industry 61(5), 463–471 (2010)