Damaris: Addressing Performance Variability in Data Management for Post-Petascale Simulations
Texte intégral
Figure
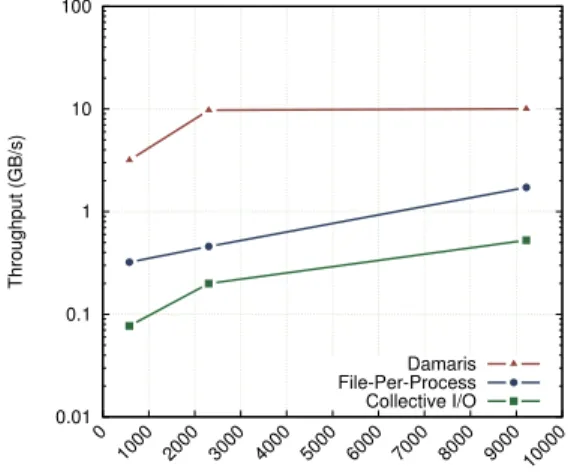
![Fig. 1: Variability across processes and across I/O phases in the IOR benchmark using a file-per-process approach on Grid’5000’s Rennes site [Grid’5000 2015], with a PVFS2 [Carns et al](https://thumb-eu.123doks.com/thumbv2/123doknet/12526296.342238/5.918.257.667.125.272/variability-processes-phases-benchmark-process-approach-rennes-carns.webp)


Documents relatifs
We demonstrate that the relationship between the adaptive substitution rate and θ within closely related species sharing a similar DFE is shaped by the limited beneficial
Statistical Learning for Image-Based Personalization of Cardiac Models Abstract: This thesis focuses on the calibration of an electromechanical model of the heart from
We also excluded families with mixed twin pairs (one affected twin, one unaffected cotwin, and a nontwin affected sib) and families with half-siblings. Table 1 shows the
According to an economic events analysis during this period and according to the results of Artus (2004) and Ftiti and Essaadi (2008), we conclude that the transition period
In this work, a new methodology to describe the mechanical fields close to the contact edges through a crack analogy approach [3] will be used to enrich fretting
How do the criteria express their preferential view point on the set of al- ternatives? For instance the Tourist Attraction criterion appears to be in its preferential judgments
The proposed reference architecture of the semantic enterprise data warehouse could be used to design a multi-domain data integration capability, notably, to support
However due to the intrinsic properties of microblogging systems, such as the vol- umetry, the short lifetime of posts and the sparsity of interactions between users and
