HAL Id: hal-00725580
https://hal.archives-ouvertes.fr/hal-00725580
Submitted on 27 Aug 2012
HAL is a multi-disciplinary open access
archive for the deposit and dissemination of
sci-entific research documents, whether they are
pub-lished or not. The documents may come from
teaching and research institutions in France or
L’archive ouverte pluridisciplinaire HAL, est
destinée au dépôt et à la diffusion de documents
scientifiques de niveau recherche, publiés ou non,
émanant des établissements d’enseignement et de
recherche français ou étrangers, des laboratoires
On 3D retrieval from photos
Tarik Filali Ansary, Jean-Philippe Vandeborre, Mohamed Daoudi
To cite this version:
Tarik Filali Ansary, Jean-Philippe Vandeborre, Mohamed Daoudi. On 3D retrieval from photos. 3rd
IEEE International Symposium on 3D Data Processing, Visualization and Transmission (3DPVT’06),
Jun 2006, Chapel Hill, North Carolina, United States. �hal-00725580�
On 3D retrieval from photos
Tarik Filali Ansary, Jean-Phillipe Vandeborre, Mohamed Daoudi
FOX-MIIRE Research Group (LIFL UMR 8022 CNRS/USTL)
(GET/INT – Telecom Lille 1)
email:
{filali, vandeborre, daoudi}@enic.fr
http://www-rech.enic.fr/fox-miire
Abstract
In this paper, we propose a method for 3D-model retrieval from one or more photos. This method provides an ”opti-mal” selection of 2D views to represent a 3D-model, and a probabilistic Bayesian method for 3D-model retrieval from realistic photos and sketches using these views. The char-acteristic view selection algorithm is based on an adap-tive clustering algorithm and uses statistical model distri-bution scores to select the optimal number of views. We also introduce a Bayesian approach to score the probability of correspondence between the queries and the 3D-models. We present our results on the Princeton 3D Shape
Bench-mark database (1814 3D-models) and 50 photos (real
pho-tographs, sketches, synthesised images). A practical on-line 3D-model retrieval system based on our approach is avail-able on the web to asset our results [1].
1. Introduction
The development of 3D modelling and digitalising tech-nologies has made the 3D-model generation process much easier. Also, through the Internet, users can download a large number of free 3D-models from all over the world. This has increased the need for developing efficient tech-niques for content-based 3D-model retrieval.
Recently, some experimental 3D Shape search engines have been made, such as the 3D-model search engine at
Prince-ton University [2], the 3D model retrieval system at The Na-tional Taiwan University [3], the Ogden IV system at The national Institute of Multimedia Education, Japan [4], the
3D retrieval engine at Utrecht University [5] and the 3D model similarity search engine at The University of
Kon-stanze [6].
To search a database for 3D-models that are visually simi-lar to a view, a sketch or a photo of a 3D-model is a very intuitive way. But, it is a challenging problem. The main idea in 3D retrieval using 2D-views or photos is that two 3D-models are similar if they also look similar from differ-ent angles. So, the proposed solutions are to correspond one or more photos (sketches, views) to the 3D-models they are
similar to.
Funkhouser et al. [2] apply view-based similarity to im-plement a 2D sketch query interface. In the preprocessing stage, a descriptor of a 3D-model is obtained by 13 thumb-nail images of boundary contours as seen from 13 view di-rections.
Chen et al. [3] use 100 orthogonal projections of an object and encode them by Zernike moments and Fourier descrip-tors. The running time of the retrieval process is reduced by a clever multi-step approach supporting early rejection of non-relevant models.
Using aspect graphs, Cyr and Kimia [7] specify a query by a view of 3D-objects. A descriptor of a 3D-model consists of a set of views. The number of views is kept small by views clustering and by representing each cluster by one view, which is described by a shock graph. Schiffenbauer [8] presents a complete survey of aspect graphs methods. Using shock matching, Macrine et al. [9] apply indexing us-ing topological signature vectors to implement view-based similarity matching more efficiently.
Filali et al. [10] propose an nearest neighbour-like frame-work to choose the characteristic views of a 3D-model. Some early experiments were made on CAD models re-trieval from photos but was only applied on a small database.
However, to our knowledge no on-line 3D-model search en-gine can retrieve 3D-models from one or more photos. A complete survey on 3D shape retrieval can be found in Tan-gelder and Veltkamp [11].
In this paper, we propose a method for 3D-model retrieval from one or more photos(photographs, sketch, views) based on 2D views. This method aims at providing an optimal se-lection of 2D views from a 3D-model, and a probabilistic Bayesian method for 3D-model indexing from these views. This paper is organised as follows. In section 2, we present the main principles of our method for characteristic view selection. In section 3, our probabilistic 3D-model retrieval from photos is presented. Then, the results obtained from a database of 50 images and 1814 3D-models (Princeton 3D Shape Benchmark database) are discussed
demonstrat-ing the performance of our method. Finally, we present our on-line 3D search engine.
2
Selection of characteristic views
LetDb = {M1, M2, . . . , MN} be a collection of N
three-dimensional models. We want to represent each 3D-model
Mi by a set of 2D views that best represent it. To achieve
this goal, we first generate an initial set of views from the 3D-model, then we reduce this set to only those that best characterise this 3D-model. In this paragraph, we present our algorithm for characteristic view selection from a three-dimensional model.
2.1
Generating the initial set of views
To generate the initial set of views for a modelMi of the
collection, we create 2D views (projections) from multiple viewpoints. These viewpoints are equally spaced on the unit sphere. In our current implementation, we use 320 initial views. The views are silhouettes only, which enhance the efficiency and the robustness of the image metric. To rep-resent each of these 2D views, we use 49 coefficients of Zernike moment descriptor [12]. Due to the use of Zernike moments, the approach is robust against translation, rota-tion, and scaling.
2.2
Characteristic views selection
As every 2D view is represented by 49 Zernike moment co-efficients, choosing a set of characteristic views that best characterise the 3D-models (320 views) is equivalent to choose a subset of points that represent a set of 320 points
in a 49-dimension space. ChoosingX characteristic views
which best represent a set ofN = 320 views is well known
as a clustering problem.
One of the widely used algorithm in clustering is
K-means [13] algorithm. Its attractiveness lies in its simplicity
and in its local-minimum convergence properties. However,
it has one main shortcoming: the number of clustersK has
to be supplied by the user.
As we want from our method to adapt the number of characteristic views to the geometrical complexity of the 3D-model, we use a method derived from K-means. In-stead of using a fixed number of clusters, we propose to use a range in which we will choose the ”optimal” number of
clusters. In our case, the range will be[1, . . . , 40]. In this
paper, we assume that the maximum number of characteris-tic views is 40. This number of views is a good compromise between speed, descriptor size and representation (section 4).
We proceed now to demonstrate how to select the
char-acteristic view set and also how to select the bestK within
the given range. In essence, the algorithm starts with one
characteristic view (K equal to 1), we add characteristic
views where they are needed, and we do a global K-means on the data starting with characteristic views as cluster cen-ters. We continue alternating between adding characteristic views and doing a global K-means until the upper bound for characteristic view number (40) is reached. During this
process, for eachK, we save the characteristic view set.
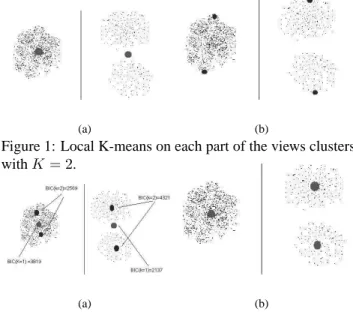
To add new characteristic views, we use the idea pre-sented in the X-means clustering method by Dan Pelleg [14]. First, for every cluster of views represented by a char-acteristic view (Figure 1(a)), we select two views that have the maximum distance in this cluster (Figure 1(b)). Next, in
each cluster of views, we run a local K-means (withK = 2)
for each pair of selected views.
By local, we mean that only the views that are in the cluster are used in this local clustering (Figure 1). Note that Figure 1 and 2 are just a schematic example, as we repre-sent a view in a two dimensional space. In our system each view is represented by a vector in a 49 dimensional space (corresponding to the 49 Zernike moment features extracted from the view).
At this point, a question arises: ”Are the two new char-acteristic views giving more information on the region than the original characteristic view?” To answer this question, we use Bayesian Information Criteria (BIC) [15], which scores how likely the representation model (using one or two characteristic views) fits the data.
(a) (b)
Figure 1: Local K-means on each part of the views clusters withK = 2.
(a) (b)
Figure 2: Selecting the representations (with 1 or 2 charac-teristic views) that have the higher BIC score.
According to the outcome of the test, the model with the highest score is selected (Figure 2). These clusters of the views which are not represented well by the current cen-troids will receive more attention by increasing the number of centroids in them.
We continue alternating between global K-means and lo-cal K-means on clusters belonged to the characteristic views until the upper bound for the characteristic view number is reached. Then, we compare the BIC score of each charac-teristic view set. Finally, the best characcharac-teristic view set will be the one that gets the highest BIC score on all the views.
3
Probabilistic approach for 3D
in-dexing
The main idea of our probabilistic approach is that not all views of a 3D-model have the same importance. There are views which represent the 3D-model better than others. On the other hand, simple objects (e.g. cube, sphere) can be at the root of more complex objects, so they have a big-ger probability to be relevant. In this section, we present a probabilistic approach that takes into account that views do not have the same importance, and that simple objects have higher probability to appear than more complex one.
Each model of the collectionDbis represented by a set
of characteristic viewsV = {V1, V2, . . . , VC}, with C the
number of characteristic views. To each characteristic view
corresponds a set of represented views calledVr.
As mentioned before, we want to find the 3D models that corresponds to one or more request photos. We assume that
in a queryQ = {I1, I2, . . . , IK} all K the images represent
the same object. Considering a queryQ, we wish to find the
modelMi ∈ Db which is the closest to the queryQ. This
model is the one that has the highest probabilityP (Mi/Q).
Knowing that a query is composed of one or more images,
P (Mi/Q) can be written: P (Mi|Q) = XK k=1 1 KP (Mi|Ik),
WithK the number of images in the query Q. Let H
be the set of all the possible hypotheses of correspondence
between the request imageIkand a modelMi,H = {hk1∨
hk
2∨ . . . ∨ hkN}. A hypothesis hkp means that the viewp of
the model is the request imageIk. The sign∨ represents
logic or operator. Let us note that if an hypothesishk p is
true, all the other hypotheses are false. P (Mi|Ik) can be
expressed byP (Mi|Hk). We have: P (Mi|Hk) =PNj=1P (Mi, VMji|h k j). The sumPNj=1P (Mi, VMji|h k
j) can be reduced to the only
true hypothesisP (Mi, VMji|H
k
j). In fact, an image from
the requestQ can match only one characteristic view from
the modelMi. We choose the characteristic view with the
maximum probability. P (Mi|Q) = XK k=1 1 KM axj(P (Mi, V j Mi|h k j)) (1)
Using the Bayes theorem, we have:
P (Mi, VMji|hkj) = P (hk j, V j Mi|Mi)P (Mi) P (hk j) . (2) On the other hand, we have:
P (hkj, V j Mi|Mi) = P (h k j|V j Mi, Mi)P (V j Mi|Mi), (3) and, P (hk j) = N X i=1 ˆ v X j=1 P (hk j|VMji, Mi)P (V j Mi|Mi)P (Mi)). (4) By using (1), (2), and (3) we obtain:
P (Mi, VMji|h k j) = (5) P (hk j|V j Mi, Mi)P (V j Mi|Mi)P (Mi) PN i=1 Pvˆ j=1P (hkj|V j Mi, Mi)P (V j Mi|Mi)P (Mi) . Finally: P (Mi|Q) = XK k=1 1 K (6) M axj( P (hk j|V j Mi, Mi)P (V j Mi|Mi)P (Mi) PN i=1 Pˆv j=1P (hkj|V j Mi, Mi)P (V j Mi|Mi)P (Mi) ).
As mentioned before, not all three-dimensional models in the collection have the same probability to occur. Our al-gorithm assumes that the simpler is the three-dimensional model, the smaller is the number of the characteristic views. To model the fact that the larger the relative number of
views of a model Mi, the smaller the probability of the
model, we estimate P (Mi), the probability to observe a
three-dimensional modelMiby:
P (Mi) = e
(−αN(VMi)/N (V ))
PN
i=1e(−αN(VMi)/N (V ))
, (7)
whereN (VMi) is the number of characteristic views of the
modelMi,N (V ) is the total number of characteristic views
for the set of the models of the collectionDb.α is a
coeffi-cient that reduces the effect of small values of the
exponen-tial inP (Mi).
On the other hand, there are views that contain more in-formation than other ones. We assume that the greater the
number of represented viewsN (V rjMi) for a
characteris-tic view VMji, the more this characteristic view is
impor-tant and the more information it contains about the
three-dimensional model. So, we modelledP (VMji|Mi) the
prob-ability to observe the characteristic viewj of the model Mi
by: P (VMji|Mi) = 1 − βe(−βN(V rjMi)/N (V rMi)) Pˆv j=1(1 − βe(−βN(V r j Mi)/N (V rMi))) , (8)
whereN (V rMj i) is the number of views represented by the
characteristic viewj of the model M , N (V rMi) is the
to-tal number of views represented by the modelMi. Theβ
coefficient is introduced to reduce the effect of small values
of the view probability. We use the valuesα = β = 1/100
which give the best results during our experiments.
The valueP (hk
j|V j
Mi, Mi) is the probability that,
know-ing that we observe the characteristic viewj of the model
Mi, this view corresponds to imagek of the request Q:
P (hkj|V j Mi, Mi) = e−D(Ik,VMij ) Pˆv j=1e −D(Ik,VMij ) , (9)
whereD(Ik, VMji) is the Euclidean distance between the
Zernike descriptors of the image k of the request model
Q and VMji is the characteristic view j of the
three-dimensional modelMi.
To summarise, in this section we presented our Bayesian retrieval framework which takes into account the number of characteristic views of the model and the importance (amount of information) of its views.
4
Experimental results
In this section, we present the experimental process and the results we obtained. The algorithms we described in the previous sections have been implemented using C++ and the TGS Open-Inventor libraries. The system consists of an off-line characteristic view extraction algorithm and an on-line retrieval process.
In our method, each model was normalised for size by isotropically rescaling it so that the average Euclidean dis-tance from points on its surface to the center of mass is 0.5. Then, all models were normalised for translation by moving their center of mass to the origin.
In the off-line process, the characteristic view selection takes about 18 seconds per model on a PC with a Pentium IV 2.4 GHZ CPU. In the on-line process, the comparison takes less than 1 second for 1814 3D-models.
To evaluate our method, we used the Princeton Shape
Benchmark database (PSB), a standard shape benchmark
widely used in shape retrieval community. Princeton Shape
Benchmark (PSB) appeared in 2004 and is one of the most
exhaustive benchmarks for 3D shape retrieval. It contains a database of 1814 classified 3D-models collected from 293 different Web domains. There are many classifications given to the objects in the database. During our experiments we used the finest granularity classification, composed of 161 classes. Most classes contain objects with a particular function (e.g cars). Yet, there are also cases where objects with the same function are partitioned in different classes based on their shapes (e.g, round tables versus rectangular tables) [16].
The mean number of views for the Princeton Shape
Benchmark database is 23 views per model. The mean size
for a 3D model descriptor is 1,113 bytes.
To evaluate the algorithms we presented on the previ-ous sections, we selected 50 images from the Internet. The images correspond to 10 classes of the Princeton Shape
Benchmark (five images per class): Airplanes, Bicycles,
Chairs, Dogs, Guns, Hammers, Humans arms out, Heli-copters, Pots and Swords. The images are composed of six sketches, six synthetized images and 38 real photos of dif-ferent sizes.
As the request photos will be compared to the charac-teristic views of the 3D models, a pre-processing stage is needed. The extraction of the Zernike moments of charac-teristic views and querry images is as follows:
1. Transform input image to grey scale image.
2. Get edge image from the grey level image using the
Canny filter [17] and binarize it, the object is
com-posed of the edge pixels.
3. Normalise the binarized edge image to accomplish ob-ject scale invariance.
4. Move the origin of the image to the centroid of the object, obtain object translation invariance.
5. The extracted Zernike features start from the second order moments. We extract up to the twelfth order Zernike moments corresponding to 49 features.
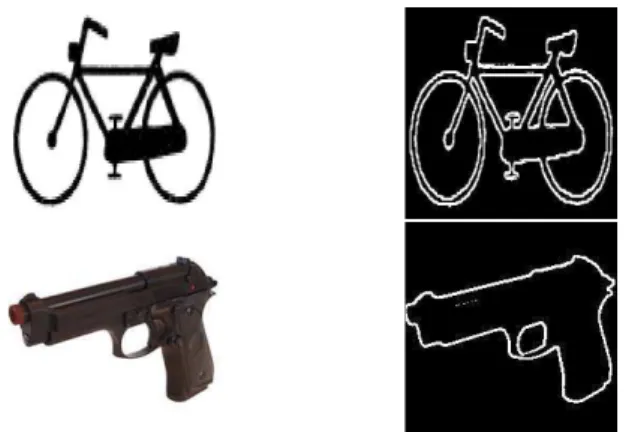
Figure 3: Two queries and their corresponding edge images. Figure 3 shows two images from the query-image database and their corresponding edge images. As the reader may have noticed, in the experiments we use images with a sim-ple background. This problem can be partially solved using a more sophisticated segmentation algorithm, but this is
be-yond the scope of this paper.
Figure 4: 3D retrieval results using one photo.
Figure 5: 3D retrieval results using two photos.
Figure 6: 3D retrieval results using three photos. Figures 4, 5 and 6 show the results of a query using re-spectively, one, two and three images of a bicycle. The left side of the figures represent the queries and the right side represent the 16 top retrieved 3D-models. Figure 4 shows the sixteen first result of a query using one photo from the 1814 3D-models in the database. From the seven 3D-models representing a bicycle in the database, three are in the fifteen top retrieved 3D-models. This number raises
to four out of seven when we use two images (Figure 5). Using three images (Figure 6 )we retrieved five out of seven in the top sixteen retrieved 3D-models.
To evaluate the performance of our method we used Re-call VS. Precision curves. ReRe-call VS. Precision curves are well known in the literature of content-based search and re-trieval. The recall and precision are defined as follow:
Recall = N/Q, Precision = N/A,
where N is the number of relevant models retrieved in the top A retrievals, Q is the number of relevant models in the collection, which is the number of models to which the query belongs to.
For each of the 10 image classes, we present five differ-ent Recall VS. Precision Curves :
• Using 1 image: This curve represents the mean
Re-call VS. Precision curve for 5 queries using one image from the image-class.
• Using 2 images: This curve represents the mean
Re-call VS. Precision curve for 5 queries using two ran-dom images from the image-class.
• Using 3 images: This curve represents the mean
Re-call VS. Precision curve for 5 queries using three ran-dom images from the image-class.
• Using 4 images: This curve represents the mean
Re-call VS. Precision curve for 5 queries using four ran-dom images from the image-class.
• Using 5 images: The Recall VS. Precision curve using
the five images of the class.
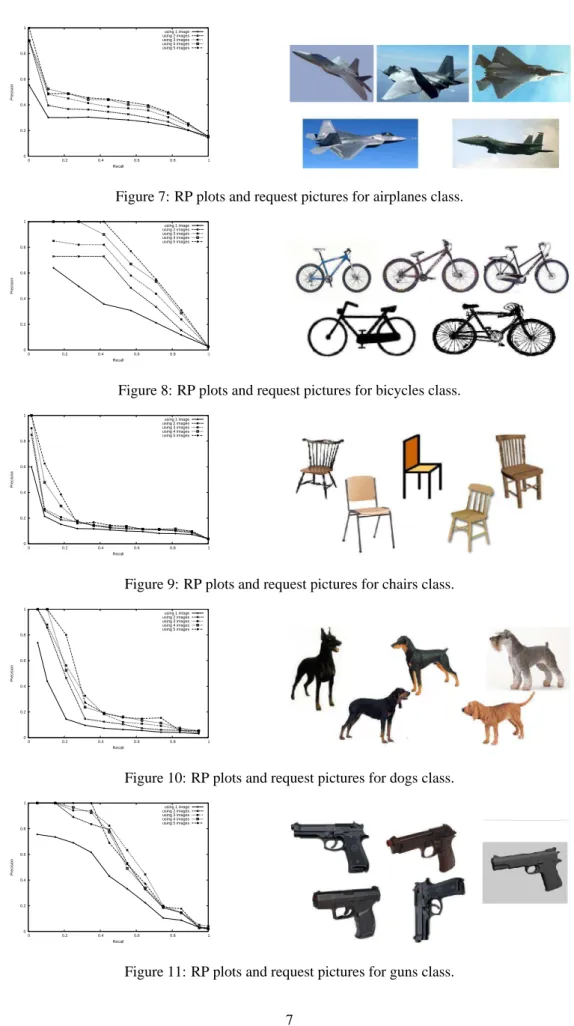
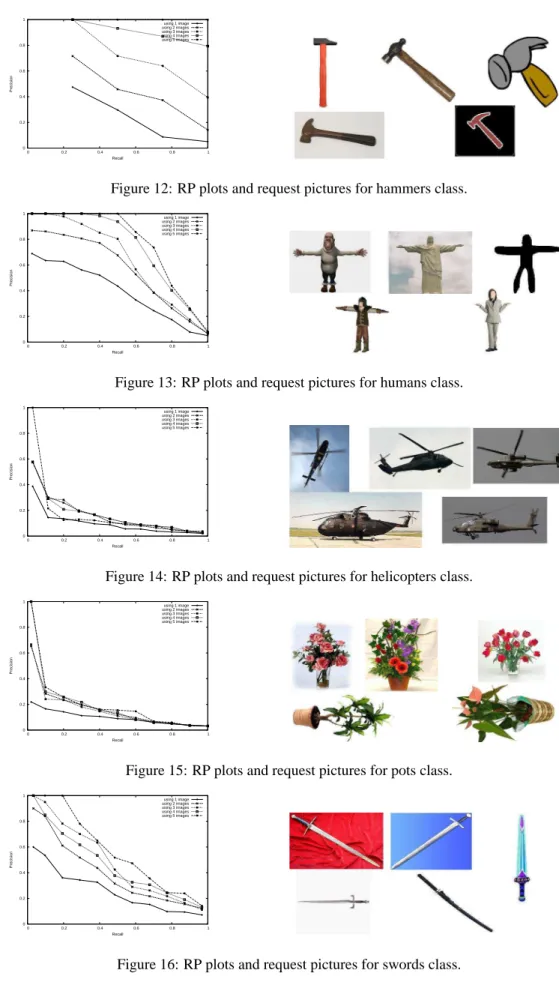
Figures 7 to 16 show the Recall Vs Precision plots for the ten image-classes. We can notice that using more images in a request results in better precision’s rates.
In Figures 9,10,11, the precision gain is 26% using two images instead of one. The gain can be up to 75% using 4 images instead of one as shown in Figure 15. Overall, our method works quite well on hand-drawing, synthetized images(or 3D model views) and photos.
The gain from using multiple images in a query face the problem of ”how to get this query images?” Using web im-ages search-engines, camera or hand-drawing can solve the problem, but it is still time and effort consuming to get or draw five or more images.
We believe that using two or three photos makes a good compromise between time-effort and accuracy.
Our work can be applied to e-shopping or CAD models retrieval from photos, where instead of browsing big cat-talogues of products user present one or more photos of a similar object and the search engine will return the most relevant results.
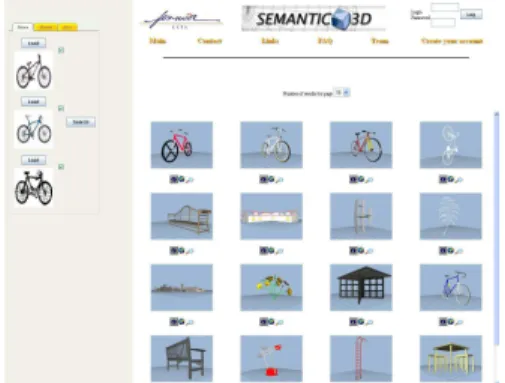
To experiment our algorithms and to asset the results pre-sented in the previous sections, we developed an on-line 3D search engine. Our search engine can be reached from any device having compatible web browser (PC, PDA, Smart-Phone, etc.) [1].
Depending on the web access device he/she is using, the user face two different kind of web interfaces : a rich web interface for full-featured web browsers, and a simpler in-terface for PDA web browsers. In both cases, the results returned by the 3D search engine are the same. The only difference lies in the design of the results presentation. The 3D database available for tests of our 3D search engine is the Princeton Shape Benchmark Database [16].
5
Conclusion
In this paper, we propose a 3D-model retrieval from photos based on characteristic view similarity. We also propose a characteristic view selection algorithm that relates the num-ber of views to its geometrical complexity. The numnum-ber of characteristic views varies from 1 to 40. We also propose a new probabilistic retrieval approach that corresponds one or more photos representing the same object to 3D mod-els characteristic views. The experiments of our method on
Princeton Shape Benchmark Database (1814 3D-models),
show the good retrieval results using one or more photos. Using Recall VS Precision plots, we present our result on 10 different image-classes. The precision gain from using more than one photo can be up to 78%. Our work can be applied to e-shopping or CAD models retrieval from pho-tos, where instead of browsing big catalogues of products, the user presents one or more photos of a similar object and the search engine will return the most relevant results. A practical 3D-model retrieval system based on our approach is available on the Web for on-line tests [1].To our knowl-edge, it is the first 3D retrieval system from photos on line.
References
[1] “Fox-miire 3d retrieval system,”
http://www-rech.enic.fr/3dretrieval.
[2] T. Funkhouser, P. Min, M. Kazhdan, A. Haderman, D. Dobkin, and D. Jacobs, “A search engine for 3D models,” ACM Transactions on Graphics, vol. 22, no. 1, pp. 83–105, 2003.
[3] D. Y. Chen, X. P. Tian, Y. T. Shen, and M. Ouhyoung, “On visual similarity based 3D model retrieval,” in
Eurographics, 2003, vol. 22, pp. 223–232.
[4] M. T. Suziki, “A search engine for polygonal mod-els to support development of. 3d e-learning applica-tions,” in In The Tenth International World Wide Web
Conference Poster Proceedings, 2001, pp. 182–183.
[5] J. W.H. Tangelder and R. C. Veltkamp, “Polyhedral model retrieval using weighted point sets,” in
Inter-national Conference on Shape Modeling and Applica-tions, 2003, pp. 119–131.
[6] D. V. Vranic, “An improvement of rotation invariant 3D shape descriptor based on functions on concentric spheres,” in IEEE International Conference on Image
Processing, 2003, pp. 757–760.
[7] C. M. Cyr and B. Kimia, “3D object recognition using shape similarity-based aspect graph,” in IEEE
Inter-national Conference on Computer Vision, 2001, pp.
254–261.
[8] R. D. Schiffenbauer, “A survey of aspect graphs,”
Tech. Rep. TR-CIS-2001-01, CIS, 2001.
[9] D. Macrini, A. Shokoufandeh, S. Dickenson, K. Sid-diqi, and S.Zucker, “View based 3-D object recogni-tion using shock graphs,” in IEEE Internarecogni-tional
Con-ference on Pattern Recognition, 2002, vol. 3, pp. 24–
28.
[10] T. Filali Ansary, J. P. Vandeborre, and M. Daoudi, “A framework for 3D CAD models retrieval from 2D im-ages,” Annals of Telecommunications, special issue
on Technologies and tools for 3D imaging, vol. 60, no.
11-12, pp. 1337–1359, November-December 2005. [11] J. W. H. Tangelder and R. C. Veltkamp, “A survey of
content-based 3D shape retrieval methods,” in IEEE
Shape Modeling International, 2004, pp. 145–156.
[12] A. Khotanzad and Y. H. Hong, “Invariant image
recognition by Zernike moments,” IEEE Transactions
on Pattern Analysis and Machine Intelligence, vol. 12,
no. 5, pp. 489–497, May 1990.
[13] R. O. Duda and P. E. Hart, “Pattern classification and scene analysis,” John Wiley and Sons, 1973.
[14] D. Pelleg and A. Moore, “X-means: Extending k-means with efficient estimation of the number of clus-ters,” in International Conference on Machine
Learn-ing, 2000, pp. 727–734.
[15] G. Schwarz, “Estimating the dimension of a model,”
The Annals of Statistics, vol. 6, pp. 461–464, 1978.
[16] “Princeton shape benchmark,” 2004,
http://shape.cs.princeton.edu/benchmark.
[17] J. F. Canny, “A computational approach to edge de-tection,” IEEE Trans. Pattern Analysis and Machine
0 0.2 0.4 0.6 0.8 1 0 0.2 0.4 0.6 0.8 1 Precision Recall using 1 image using 2 images using 3 images using 4 images using 5 images
Figure 7: RP plots and request pictures for airplanes class.
0 0.2 0.4 0.6 0.8 1 0 0.2 0.4 0.6 0.8 1 Precision Recall using 1 image using 2 images using 3 images using 4 images using 5 images
Figure 8: RP plots and request pictures for bicycles class.
0 0.2 0.4 0.6 0.8 1 0 0.2 0.4 0.6 0.8 1 Precision Recall using 1 image using 2 images using 3 images using 4 images using 5 images
Figure 9: RP plots and request pictures for chairs class.
0 0.2 0.4 0.6 0.8 1 0 0.2 0.4 0.6 0.8 1 Precision Recall using 1 image using 2 images using 3 images using 4 images using 5 images
Figure 10: RP plots and request pictures for dogs class.
0 0.2 0.4 0.6 0.8 1 0 0.2 0.4 0.6 0.8 1 Precision Recall using 1 image using 2 images using 3 images using 4 images using 5 images
0 0.2 0.4 0.6 0.8 1 0 0.2 0.4 0.6 0.8 1 Precision Recall using 1 image using 2 images using 3 images using 4 images using 5 images
Figure 12: RP plots and request pictures for hammers class.
0 0.2 0.4 0.6 0.8 1 0 0.2 0.4 0.6 0.8 1 Precision Recall using 1 image using 2 images using 3 images using 4 images using 5 images
Figure 13: RP plots and request pictures for humans class.
0 0.2 0.4 0.6 0.8 1 0 0.2 0.4 0.6 0.8 1 Precision Recall using 1 image using 2 images using 3 images using 4 images using 5 images
Figure 14: RP plots and request pictures for helicopters class.
0 0.2 0.4 0.6 0.8 1 0 0.2 0.4 0.6 0.8 1 Precision Recall using 1 image using 2 images using 3 images using 4 images using 5 images
Figure 15: RP plots and request pictures for pots class.
0 0.2 0.4 0.6 0.8 1 0 0.2 0.4 0.6 0.8 1 Precision Recall using 1 image using 2 images using 3 images using 4 images using 5 images