Composite joints in robust building frames
12
0
0
Texte intégral
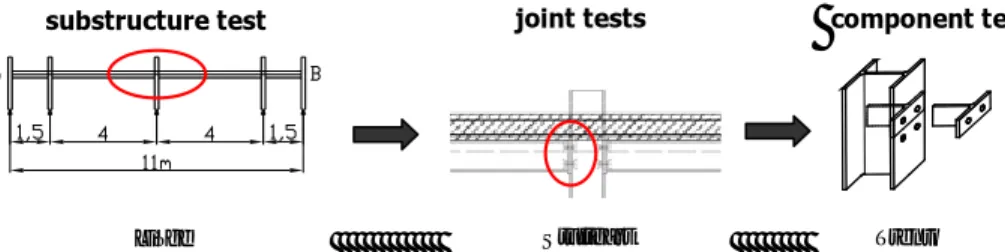
(2) structural integrity will be required when the structure is subjected to exceptional actions not explicitly considered in the definition of the design loads and load combination cases. According to Eurocodes ([prEN 1991-1-7 2004], [ENV 1991-2-7 1998]) and some different other national design codes ([BS 5950-1:2000 2001], [UFC 4-023-03 2005]), the structural integrity of civil engineering structures should be ensured through appropriate measures but, in most of the cases, no precise practical guidelines on how to achieve this goal are provided. Even basic requirements to fulfil are generally not clearly expressed. Different strategies may therefore be contemplated: − Integrate all possible exceptional loads in the design process in itself; for sure this will lead to uneconomical structures and, by definition, the probability to predict all the possible exceptional events, the intensity of the resulting actions and the part of the structure which would be affected is seen to be “exceptionally” low. − Derive requirements that a structure should fulfil in addition to those directly resulting from the normal design process and which would provide robustness to the structure, i.e. an ability to resist locally the exceptional loads and ensure a structural integrity to the structure, at least for the time needed to safe lives and protect the direct environment. Obviously the objective could never be to resist to any exceptional event, whatever the intensity of the resultant actions and the importance of the structural part directly affected. In the spirit of the second strategy, a European RFCS project entitled “Robust structures by joint ductility – RFS-CR-04046” has been set up in 2004, for three years, with the aim to provide requirements and practical guidelines allowing to ensure the structural integrity of steel and composite structures under exceptional events through an appropriate robustness. Within the project, Liège University was mainly concerned by the exceptional loading “loss of a column further to an impact” in steel and composite buildings. At this occasion, the importance of the structural joints has been shown; indeed, these ones are initially designed to transfer shear forces and hogging bending moments, but experience additional high tying forces after the loss of a column, as a result of the development of membrane forces in the beams located just above the damaged or destroyed column. Moreover a reversal of moments occurs in the joints located just above the damaged column. In this paper design models for the evaluation of the mechanical properties of joints in such extremes situations [Demonceau 2008] are presented, as a part of a more global study carried out at Liège University and aimed at deriving design requirements for robust composite building frames. References are first made to recent experimental tests on joints in isolation and joints in frames recently achieved at Stuttgart University and at Liège University in the framework of the above-mentioned RFCS project. Then, the design models developed within the project are presented.. PERFORMED EXPERIMENTAL TESTS. Introduction During the previously mentioned European project, an experimental test campaign was foreseen, as illustrated in Figure 1. In a first step, an experimental test on a substructure simulating the loss of a column in a composite building frame had to be performed at Liège University; the objective of this test was to observe the development of membrane forces within the beams and their effects on the joint response. Then, in a second step, the composite joint configuration used in the substructure test had to be tested in isolation at Stuttgart University with the objective to derive its response under combined bending moments and tensile forces..
(3) Finally, in a third step, all the components activated in the joints studied as part of the substructure in Liège and in isolation in Stuttgart had to be tested at Trento University. In order to reach a full adequacy between the experimental results, all the steel elements used for the tested specimens had to come from the same producer and from the same production. In the next paragraphs, the substructure test and the joint tests in isolation are presented. substructure test. joint tests. component tests. part. Liège. Stuttgart. Trento. Fig. 1 – Test campaign within the RFCS project “Robust structures by joint ductility” Substructure test As mentioned previously, the substructure experimental test has been performed at Liège University. To define the substructure, an “actual” composite building has first be designed according to Eurocode 4 [EN 1994-1-1 2004], under “conventional” loading conditions (i.e. loads recommended in Eurocode 1 for office buildings [EN 1991-1-1 2002]); the aim was to get realistic dimensions for the structure to be tested. In particular, the composite joints were designed so as to exhibit a ductile behaviour at collapse, under M-N (moment - axial force) combined loading [Demonceau 2008]. The details of the selected joints are shown later in Figure 7. As it was not possible to test a full 2-D actual composite frame within the project, a substructure was then extracted from the actual building as presented in Figure 2; the extracted substructure was defined so as to respect the dimensions of the testing slab but also to exhibit a similar behaviour as the one which would be observed in the actual frame. In particular, by extracting the substructure from the actual building frame, a key parameter influencing significantly the development of the membrane forces was considered: the lateral restraint “K” emanating from the part of the structure not directly affected by the column loss. So, to simulate this lateral restraint, two horizontal jacks were placed each side of the tested specimen and were calibrated so as to exhibit a lateral restraint at the substructure extremities as close as possible to the one exhibited by the actual frame (numerically determined). The so-defined symmetrical substructure is illustrated in Figure 3. The following load sequence was followed during the test : -. The substructure is first subjected to an uniformly distributed load on the internal beams (Beam B in Figure 3); during this loading phase, two jacks placed below column C are locked so as to simulate the presence of the central column.. -. In a second step, the support under the central column C is progressively removed by unlocking the jacks; when the latter may be removed, the free deflection of the system is observed. Finally, a vertical force is applied until collapse through a jack located above column C (as seen in Figure 3)..
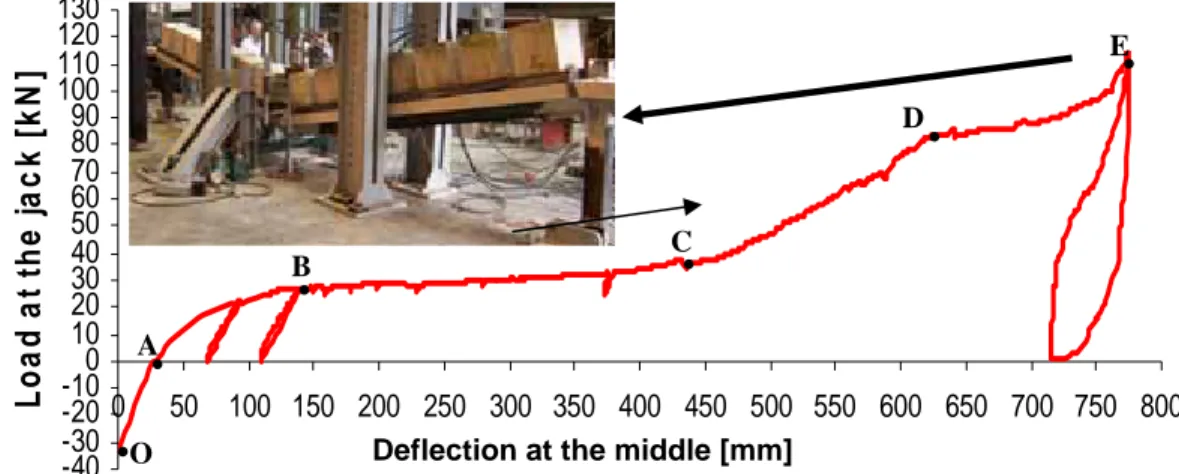
(4) Fig. 2 – From the actual composite building frame to the tested substructure. Fig. 3 – Tested substructure with lateral restraints The evolution of transverse deflection of the beams at the middle of the tested substructure according to the load applied in the jacks is presented in Figure 4. The vertical reaction in the central column which is associated to the uniformly distributed load and to the self-weight of the substructure is equal to 33,5kN as seen in Figure 4 (value of the load at point “O”). After the application of the uniform load, the jacks are unlocked and progressively removed. The system is completely released when a deflection of 29mm is reached. At this stage, first cracks at the vicinity of the external joints are observed and first yielding appears in the column web panel of the internal composite joints (close to column C). This loading step corresponds to part “OA” of the curve presented in Figure 4; from the latter, it can be seen that the structure is still in its elastic range of behaviour when “A” is reached. Then, a vertical load is progressively applied until collapse of the tested specimen. During this stage, two “unloading-reloading” cycles are performed. From point “A” to “B”, yielding progresses until finally a beam plastic mechanism forms at point “B” (plastic hinges in the joints under sagging and hogging moments). During this stage, the cracks in the vicinity of the external composite joints are more pronounced and yielding of some steel joint components is observed (column web and beam flange in compression); also, for the internal composite joint, a separation of the end-plate and the column flange is seen under sagging moment. From point “B” to “C”, a yield plateau develops; the concrete cracks in the vicinity of the external composite joints continue to enlarge and yielding spreads in the steel components. Another important phenomenon to be mentioned is the crushing of the concrete in the internal composite joints. At point “C”, significant membrane forces start to develop in the composite beams as confirmed by the shape of the curve “CD” in Figure 4. When the point “D” is reached, the longitudinal rebars in the external composite joints fail in tension and the concrete at the internal joint is fully crushed; at this moment, the joints work as steel ones (Figure 5) and further plasticity develops in the different components of the internal and external composite joints. At point “D”, a loss of stiffness is observed which is linked to the loss of the longitudinal rebars in the vicinity of the external joints; indeed, when these rebars are lost, the tensile stiffness of the external joints decreases, phenomenon which affects the development of the membrane forces. At the end of the test (point “E”), a maximum vertical displacement of 775mm is reached for an applied vertical load of 114kN; the associated deformation of the specimen is shown in Figure 4. The maximum horizontal displacement at each side of the structure is equal to 45mm for a horizontal load of 147kN. The test was.
(5) stopped when cracks occurred in the welds connecting the IPE140 profile to the end-plate in the internal composite joints. The rotations measured in the joints versus the applied load at the middle of the substructure are reported in Figure 6. The maximum joint rotations reached at the end of the test are equal to 11° (192 mrad) and to 9,5° (166 mrad) for the internal and external composite joints respectively. It can be observed in Figure 6 that: -. the beam plastic mechanism in the substructure develops with formation of plastic hinges in the joints;. -. the internal and external composite joints exhibit a similar behaviour;. -. the joint rotations are mainly associated to the rotation of the connections.. Loa d a t the ja c k [k N ]. From the maximum rotation values observed at the end of the test, it may be concluded that the joints exhibited a very ductile behaviour (very high rotation capacity), as expected. 130 120 E 110 100 90 D 80 70 60 50 C 40 B 30 20 10 A 0 -10 -20 0 50 100 150 200 250 300 350 400 450 500 550 600 650 700 750 800 -30 O Deflection at the middle [mm] -40. Fig. 4 – Vertical applied load vs. deflection at the middle of the substructure curve. Load at the vertical jacks [kN]. Fig. 5 – Internal and external composite joints at point “D” of Figure 6 140. Connection of the internal composite joint. 120. Web panel of the internal composite joint Internal composite joint. 100. Connection of the external composite joint. 80. Web panel of the external composite joint. 60. External composite joint. 40 20. 0 -1.00 0.00 -20. 1.00. 2.00. 3.00. 4.00. 5.00. 6.00. 7.00. 8.00. 9.00. 10.00 11.00 12.00. Rotation [°]. -40. Fig. 6 – Joint rotations vs. applied load at the middle of the substructure.
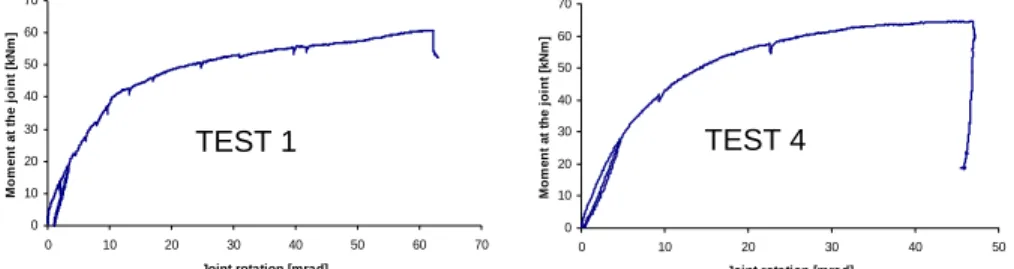
(6) Experimental tests on the substructure composite joint in isolation The test campaign at Stuttgart University was performed in close collaboration with Liège University. The tested joint configuration (coming from the substructure) is presented in Figure 7. S355 steel was used for the profiles and the end-plates, ductile S450C steel for the rebars and C25/30 for the concrete. 500. Fig. 7 – Joint configuration tested at Stuttgart University In total, five tests on this joint configuration have been performed. The objective of these tests was to derive the full M-N resistance interaction curve of the tested joints (in the tensile zone), as illustrated in Figure 8. The joints differ by the loading sequences followed during the tests, as described here after. Three tests were first performed under hogging moments and axial force: -. one test where the joint is first subjected to hogging moments, until the ultimate resistance in bending is almost reached; in a second step, further to a slight reduction of the applied bending moment, the joint is then subjected to tension forces, until the collapse of the joint (TEST 1);. -. two tests with a rather similar loading sequence but in which the bending moments applied in the first step are kept lower than the ultimate bending resistance of the joint (TEST 2 & TEST 3).. Two tests were then performed under sagging moments and axial force; the loading sequences applied were similar to the ones described above, for TEST 4 and TEST 5 respectively. M. M-N resistance curve. Mu A. Load sequence during test B Nu. N. Fig. 8 – M-N resistance curve of the joint to be characterised through the tests TEST 1 and TEST 4 were initially performed to characterise the behaviour of the tested joint under hogging and sagging moments. The “bending moment vs. joint rotation” curves are presented in Figure 9 while the M-N interaction curves are shown in Figure 10. During the tests, the collapse of the rebars in tension was observed at point A of Figure 10 during TEST 1 and at point A’ during the other tests. After the collapse of the rebars, the tested joints may be considered as steel ones. It is observed that, after the resistance loss, the remaining steel components are able to sustain additional tension loads. To pass from the “pure bending.
(7) 70. 70. 60. 60. Moment at the joint [kNm]. Moment at the joint [kNm]. moment” loading to the “maximum tensile force” one, only ductile components such as the endplate and the column flange in bending or the rebars in tension were activated, as expected through the joint design. All the observations made during the experimental tests are presented with more details in [Stuttgart University 2008]. In the next section, the so-obtained experimental results are used to validate the analytical models developed at Liège University.. 50 40 30. TEST 1. 20 10 0. 50 40 30. TEST 4. 20 10 0. 0. 10. 20. 30. 40. 50. 70. 60. 0. 10. Joint rotation [mrad]. 20. 30. 40. 50. Joint rotation [mrad]. SAGGING MOMENTS. M [kN]. HOGGING MOMENTS. Fig. 9 – Bending moment vs. joint rotation curve obtained through TESTS 1 and 4 70 65 60 55 50 45 40 35 30 25 20 15 10 5 0 -5 0 -10 -15 -20 -25 -30 -35 -40 -45 -50 -55 -60 -65 -70 -75. A. A' N [kN]. 40. 80. 120. 160. 200. 240. 280. 320. 360. 400. 440. 480. 520. 560. 600. 640. 680. TENSIO N TEST 1 TEST 2 TEST 3 TEST 4 TEST 5. Fig. 10 – Experimental M-N interaction curves DESIGN MODELS FOR COMPOSITE JOINTS SUBJECTED TO SAGGING MOMENTS AND TO COMBINED BENDING MOMENTS AND AXIAL FORCES. Design model for composite joints subjected to sagging bending moments In the Eurocodes, the analytical method recommended for the joint design is the “component method”. Insufficient information is provided there to predict the behaviour of composite joints subjected to sagging moments. Indeed, no method is available to characterise one of the activated components under such loading: the concrete slab in compression. In recent researches, methods to characterise this component in term of « resistance » have been proposed. Their aim is to define a rectangular cross section of concrete participating to the joint resistance. The procedure which is proposed in this section combines results of two methods suggested by Ferrario [Ferrario 2004] and Liew [Liew et al 2004] respectively. The combination of these two methods permits to reflect in a more appropriate way how the concrete resists to the applied load in the vicinity of the joint. Also, a formula for the characterisation of this component in term of “stiffness” is proposed..
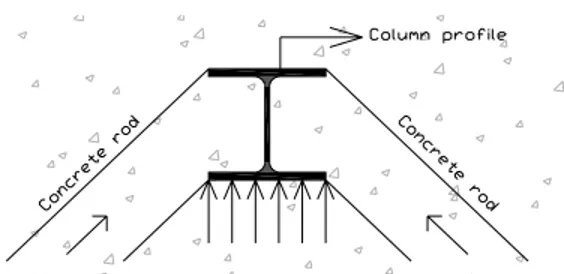
(8) In the PhD thesis of [Ferrario 2004], a formula is proposed to compute the width of the concrete beff,conn which has to be taken into account for the joint component “concrete slab in compression”:. beff ,conn = bc + 0,7hc ≤ beff where bc is the width of the column profile flange, hc the height of the column cross-section and beff, the effective width of the concrete/composite slab to be considered in the vicinity of the joint; bc represents the contribution of the concrete directly in contact with the column flange while 0,7.hc the contribution of the concrete struts which develop in a “strut-and-tie” system (see Figure 11). In the article of Liew et al, the width of the concrete is taken as equal to the width of the column flange (beff,conn = bc) and the effect of the concrete struts is neglected.. Fig. 11 – Plane view of the slab in the vicinity of the joint - identification of concrete struts in compression under sagging moment The definition of the width given in [Ferrario 2004] is here preferred as it reflects in a more appropriate way the mechanism which actually develops in the concrete slab, according to the observations reported during experimental tests ([Ferrario 2004] and [Demonceau 2008]). Another difference between the two methods is linked to the definition of the height of concrete to be considered and to the position of the centre of compression within the joint. In [Ferrario 2004], the centre of compression is assumed to be at mid-height of the concrete slab while in [Liew et al 2004], the following procedure is given to compute the position of this point: -. the characterisation of the components in tension and eventually in shear is performed according to the rules recommended in the Eurocodes;. -. then, the height of the concrete/composite slab contributing to the joint behaviour is computed by expressing the equilibrium of the load developing in the concrete/composite slab in compression with the components in tension or in shear and assuming a rectangular stress distribution in the concrete (equal to 0,85 fck/γc in a design). For instance, in the example illustrated in Figure 12, the concrete height to be considered is equal to:. z=. FRd ,1 + FRd ,2 + FRd ,3 beff ,conn .(0,85.fck / γ c ). ≤ hconcrete. where hconcrete is the total height of the concrete slab (in case of a composite slab, hconcrete is equal to the concrete above the ribs); -. finally, the characterisation of the joint is performed assuming that the centre of compression is situated at the middle of the height of the contributing part of the concrete slab (z)..
(9) Z. f ck,actual. F Rd,3 F Rd,2 F Rd,1. Fig. 12 – Height of the concrete to be considered in the characterisation of the new component The Liew procedure is selected in the proposed method as it seems to reflect better the observations made during experimental tests [Demonceau, 2008]. So, the resistance of the component “concrete slab in compression” can be computed through the following formula: FRd,CSC = beff,conn.z.(0,85.fck/γc) The two previously mentioned references only deal with the characterisation of the component “concrete slab in compression” in terms of resistance but no formulae are proposed for stiffness; however, the latter is requested in order to be able to predict the initial stiffness of the joint (and to derive the moment-rotation curve). If reference is made to [Weynand 1999], a formula is proposed to predict the stiffness of a concrete block against a rigid plate. In the present case, the steel column encased in the concrete slab can be considered as a rigid plate; so, the formula proposed in [Weynand, 1999] is extended for the computation of the stiffness of the component under consideration:. kcsc =. Ec . beff ,conn .z 1,275.Ea. where EC is the secant Young modulus for the concrete, Ea, the elastic Young modulus for the steel and kCSC, the stiffness of the component “concrete slab in compression” to be considered in the component method. With the so-defined procedure for the characterisation of the component “concrete slab in compression”, the composite joint tested at Stuttgart University under sagging moments (i.e. TEST 4) has been characterised through the component method and the so-obtained momentrotation curve has been compared to the experimental (Figure 13). For the analytical computations, the actual material properties (without safety factors) are used. The resistant bending moment MRd and the initial stiffness Sj,ini are computed in full agreement with the component method recommended in the Eurocodes while the ultimate moment Mu, the post-limit stiffness Sj,post-limit and the rotation capacity φu are computed according to the method proposed in the PhD thesis of Jaspart [Jaspart 1991] (which is in full agreement with the component method), as no specific procedure to compute these properties is proposed in the Eurocodes. In Figure 13, two analytical curves are reported; they differ by the shape of the non-linear part of the curves. In fact, the non-linear part of the curves is computed according to the rule recommended in the Eurocodes and is a function of a shape factor called Ψ. The proposed value for joints with bolted end-plates is equal to 2.7. If this value is used, it can be observed in Figure 13 that the comparison with the experimental test result is not very satisfactory. Indeed, the initial stiffness and the resistant and ultimate bending moments are in good agreement, but.
(10) the post-elastic stiffness is under-estimated. The difference is associated to the development of membrane forces in the “column flange in bending” and “end-plate in bending” components, as a result of the significant deformations appearing in the latter when high tensile forces are applied to the joint; this phenomenon is not yet included in the component method as it is actually presented in the Eurocodes. If – just as a trick – the value of the shape factor called Ψ is modified to take implicitly into account this phenomenon (for instance, Ψ equal to 1), it can be observed that a very good agreement is obtained between the analytical prediction and the experimental result. In reality, this is not the right way to proceed and for sure further developments aimed at integrating membrane effects into the resistance model for “column flange in bending” and “end-plate in bending” components are requested; such works have already been initiated at Liège University. Mom ent at the joint [kNm ]. 70 60 50 40 30 Experimental results - TEST 4 20. Component method prediction with the new component_phi = 2,7. 10. Component method prediction with the new component_phi = 1. 0 0. 5. 10. 15. 20. 25. 30. 35. 40. 45. 50. 55. 60. 65. Joint rotation [mrad]. Fig. 13 – Comparisons between analytical predictions and experimental result (TEST 4) The proposed analytical model has also been validated through comparisons with other available experimental results in [Demonceau 2008].. Design model for composite joints subjected to combined bending moments and axial loads. The presence of axial forces in the beams has an influence on the rotational stiffness, the moment resistance and the rotation capacity of the joints. The component method is presently, in the Eurocodes, limited to the characterisation of joints subjected to small bending moments: the axial force NEd acting in the joint should remain lower than 5 % of the axial design resistance of the beam cross-section Npl,Rd: NEd ≤ 0,05 N pl ,Rd. This limitation is a fully arbitrary one and is not at all scientifically justified. For instance, this criterion refers to the axial design resistance of the beam cross-section Npl,Rd and not to the design resistance of the joint, what looks quite surprising! If this criterion is not satisfied, the Eurocodes suggest a M-N interaction resistance diagram defined by a polygon joining the four points corresponding respectively to the hogging and sagging bending resistances of the joint in absence of axial force and to the tension and compression axial resistances of the joint in absence of bending. In a previous study [Cerfontaine 2003], it was shown that the proposed method is quite questionable. So, in [Cerfontaine 2003], an improved design procedure, based on the component method concept, has been developed to predict the response of steel joints subjected to combined axial loads and bending moments. In [Demonceau 2008], the design.
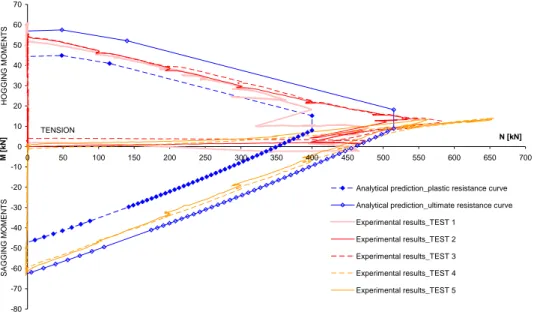
(11) procedure of Cerfontaine is extended to composite joints and validated through comparisons with the experimental test results obtained at Stuttgart University (Figure 14). The computation details to obtain the analytical M-N resistance interaction curve are presented in [Demonceau 2008]. In Figure 14, two analytical curves are reported: one named “plastic resistance curve” which is based on the plastic resistance of the joint components, and one named “ultimate resistance curve” which refers to the ultimate strength of the latter. In Figure 14, the computed analytical curves are in very good agreement with the experimental results. Indeed, the experimental curves are between the plastic and ultimate analytical resistant curves what is in line with the loading sequence followed during the tests. It is also seen in Figure 14 that the maximum tensile load which can be supported by the joint is underestimated by the analytical procedure. This difference can be justified by the fact that the proposed analytical procedure does not take into account the appearance of membrane forces in the components “column flange in bending” and “end-plate in bending”, as a result of the large deformation of these components when high tensile loads are applied to the joint. This phenomenon has already been previously identified when studying the response of the joints subjected to sagging moments.. HOGGING MOMENTS. 70 60 50 40 30 20. M [kN]. 10. TENSION. N [kN]. 0 0. 50. 100. 150. 200. 250. 300. 350. 400. 450. 500. 550. 600. 650. 700. SAGGING MOMENTS. -10 -20. Analytical prediction_plastic resistance curve. -30. Analytical prediction_ultimate resistance curve. -40. Experimental results_TEST 1 Experimental results_TEST 2. -50 Experimental results_TEST 3 -60 -70. Experimental results_TEST 4 Experimental results_TEST 5. -80. Fig. 14 – Comparison of the resistance interaction curves CONCLUSIONS. In the present paper, experimental and analytical investigations conducted at Liège University and related to the response of composite joints have been presented. A specific attention has been devoted to the behaviour of the joints located in beams in which significant membrane forces developed further to the loss of a column in the building, as a result of an exceptional event (impact, explosion …). In particular, two analytical models dedicated to the prediction of the response of composite joints subjected to sagging moments and to combined bending moments and axial forces, situations not actually covered by the actual codes, have been briefly described and their validity has been demonstrated through comparisons with experimental test results..
(12) REFERENCES. BS 5950-1:2000 (2001), “Structural use of steelwork in building – Part 1: Code of practice for design – Rolled and welded sections”. Cerfontaine, F. (2003), Study of the interaction between bending moment and axial force in bolted joints (in French). PhD thesis presented at Liège University. Demonceau, J.-F. (2008), “Steel and composite building frames: sway response under conventional loading and development of membranar effects in beams further to an exceptional action”, PhD thesis presented at Liège University. EN 1991-1-1 (2002). “Eurocode 1: Actions on structures – Part 1-1: General actions – Densities, self-weight, imposed loads for buildings”. European committee for standardization, April 2002. EN 1994-1-1 (2004), “Eurocode 4: Design of composite steel and concrete structures – Part 1-1: General rules and rules for buildings”. European committee for standardization, December 2004. ENV 1991-2-7 (1998), “Eurocode 1: Basis of design and action on structures – Part 2-7 : Accidental actions due to impact and explosions”, final draft, June 1998. Ferrario F., 2004, “Analysis and modelling of the seismic behaviour of high ductility steelconcrete composite structures”, PhD thesis presented at Trento University. Jaspart J.P. (1991), “Study of the semi-rigidity of beam-to-column joints and its influence on the resistance and stability of steel buildings”, PhD thesis, Liège University, in French. Liew R.J.Y., Teo T.H. and Shanmugam N.E., 2004, “Composite joints subject to reversal of loading – Part 2: analytical assessments”, Journal of Constructional Steel Research, pp. 247268. prEN 1991-1-7 (2004), “Eurocode 1 – Action on structures – Part 1-7: General actions – Accidental actions”, final project team draft (stage 34), 9 July 2004. Stuttgart University (2008), “Robust structures by joint ductility - Final report of the RFCS project N° RFS-CR-04046”, to be published. UFC 4-023-03 (2005), “Unified Facilities Criteria (UFC) - Design of buildings to resist progressive collapse”, Department of Defence, USA. 25 January 2005. Weynand K. (1999), “Column bases in steel building frames. COST C1 – Semi-rigid behaviour of civil engineering structural connections”, Luxembourg..
(13)
Figure


+6
![Fig. 12 – Height of the concrete to be considered in the characterisation of the new component The Liew procedure is selected in the proposed method as it seems to reflect better the observations made during experimental tests [Demonceau, 2008]](https://thumb-eu.123doks.com/thumbv2/123doknet/6298713.165085/9.918.267.646.116.241/considered-characterisation-component-procedure-selected-observations-experimental-demonceau.webp)
![Fig. 13 – Comparisons between analytical predictions and experimental result (TEST 4) The proposed analytical model has also been validated through comparisons with other available experimental results in [Demonceau 2008]](https://thumb-eu.123doks.com/thumbv2/123doknet/6298713.165085/10.918.280.644.333.523/comparisons-analytical-predictions-experimental-analytical-comparisons-experimental-demonceau.webp)
Documents relatifs
The primary objective of this study was to assess if weight status modifies the response to low-dose ICS and LTRA monotherapy, specifically by evaluating whether the
Composite Cities EURAU2014 – European Symposium on Research in Architecture and Urban Design, Faculté d’architecture, Université technique d’Istanbul, Nov 2014, Istanbul,
2 Laboratoire de Physique des Solides, Baˆtiment 510, UPS (associe´ au CNRS), F-91405 Orsay cedex, France 共 Received 4 August 2003; revised manuscript received 10 March 2004;
139 Suggestions for a Conceptual Approach
Thus, two experiments are used: the inversed perforation test based on the Hopkinson bar measurement technique, and the direct perforation test coupled with digital
In many cases, both Member State authorities as well as EU institutions and bodies contribute to a single procedure, irrespective of whether the final decision is taken on
It is a banal truth of our times that we live in crisis. Economic crisis, political crisis, ecological crisis. Crises of leadership and of conscience and, crucially, of
KEYWORDS— Reliability analysis, critical stress intensity factor, crack length, load, reliability index..
