HAL Id: hal-01008814
https://hal.archives-ouvertes.fr/hal-01008814
Submitted on 4 May 2018HAL is a multi-disciplinary open access archive for the deposit and dissemination of sci-entific research documents, whether they are pub-lished or not. The documents may come from teaching and research institutions in France or abroad, or from public or private research centers.
L’archive ouverte pluridisciplinaire HAL, est destinée au dépôt et à la diffusion de documents scientifiques de niveau recherche, publiés ou non, émanant des établissements d’enseignement et de recherche français ou étrangers, des laboratoires publics ou privés.
Reliability analysis of two in-service monitored
pile-supported wharfs during extreme storm loading
events
Humberto Yáñez-Godoy, Franck Schoefs, Anthony Nouy, Marc Lasne
To cite this version:
Humberto Yáñez-Godoy, Franck Schoefs, Anthony Nouy, Marc Lasne. Reliability analysis of two in-service monitored pile-supported wharfs during extreme storm loading events. 1st International Conference on Applications Heritage and Constructions in Coastal and Marine Environment, 2008, Lisboa, Portugal. �hal-01008814�
Reliability analysis of two in-service monitored pile-supported wharves
during extreme storm loading events
Humberto YÁÑEZ-GODOY 1, 2, Franck SCHOEFS 2, Anthony NOUY 2, Marc LASNE 1
1 OXAND S.A., 49 avenue Franklin Roosevelt 77210 Avon, France.
humberto.yanez@oxand.com; marc.lasne@oxand.com
2 Nantes Atlantic University, CNRS, Institute in Civil and Mechanical Engineering (GeM), UMR
6183, Faculté des Sciences et des Techniques, 2 rue de la Houssinière, Nantes, F-44000 France.,
franck.schoefs@univ-nantes.fr; anthony.nouy@univ-nantes.fr
Abstract
We present here a reliability analysis of in-service monitored pile-supported wharves whose container cranes are submitted to extreme storm loading. The modelling of in-service behaviour of these structures in conjunction with structural monitoring allows assessing the level of loading and provides more realistic models. A stochastic modelling takes into account the large scatter of measured quantities. It enables to identify main random variables influencing mechanical behaviour. A polynomial chaos decomposition of random identified variables and wind loading acting on a container crane is then selected. A performance criterion, based on wharf displacement, and in line with the so-called Service-Limit-States, is suggested for reliability analysis. We use non-intrusive methods, particularly projection method and Monte-Carlo simulations. Projection method is highly accurate in representing the response distribution tails thus allowing a post-evaluation of the failure probability. A comparison with a great number of Monte-Carlo simulations is then accomplished to verify the accuracy. Finally, sensitivity studies are then performed to rank the set of basic variables and to analyse the effect of the choice of the critical value of the performance criterion. Two illustrations based on different wharves built with same materials but different building methods are suggested.
Keywords: pile-supported wharf, polynomial chaos, statistical analysis, stochastic modelling, stochastic finite element, structural monitoring, tie-rods.
1.
Introduction
The optimization of Inspection-Maintenance-Repair (IMR) of structures in coastal areas is still a major challenge. In fact, harbours include a set of mixed structures due to the significantly large variability in the construction time and techniques of their various components. Monitoring is the only way to understand both complex interaction mechanisms (e.g. soil-structure interaction) and in-service structure behaviour influenced by building conditions that are likely to separate present behaviour from its theoretical one.
This paper deals with the reliability assessment of harbour structures. We propose to resort to monitoring data as well as storm loading to introduce information in reliability assessment. The considered structures are two in-service monitored pile-supported wharves located in the estuary of the river Loire, in the west of France. These structures managed by the Port Authority of Nantes Saint-Nazaire (PANSN) are the extension of the timber terminal of Cheviré, the station 4 (so-called Cheviré-4 wharf) and the extension of the containers terminal of Montoir (so called TMDC-4 wharf). The behaviour of these harbour structures presents several hazards in particular because of the difficult conditions of building and extreme loadings (storms). Storm conditions play a dominant role as they act on cranes; they are of major importance for re-analysis of old structures which were designed without taking these situations into account. Moreover, with the possible climatic changes, there is a need to update extreme wind speed and corresponding storm loading on structures with a view to analyse the relative change in safety level. Reliability analysis gives efficient tools needed to perform such computations as long as boundary conditions are known with a given uncertainty.
After a presentation of both wharves and their instrumentation, trajectories of stochastic fields of loads obtained from monitoring are provided and aim to model both the embankment loadings and the tie-rods stiffness. A probabilistic modelling is then proposed and an inverse analysis is carried
out on the basis of mechanical models. In this phase, the probabilistic approach is based on both the identification of parameters of classical laws of probability and on the polynomial chaos identification. An assessment of the probability of failure, by considering a limit state performance criterion, is carried out by a non-intrusive stochastic finite element method, and results are compared to those of a classical method of Monte-Carlo. Computation of reliability considers the combination of both loading winter storm as well as high tide coefficients.
2.
Presentation of the studied structures
2.1 TMDC-4 wharf
The TMDC-4 wharf is 250 m long and 43 m wide. It is located in the Montoir city, two kilometres upstream of the Saint-Nazaire Bridge, on the north strand of the mouth of the river Loire, near the exit of the estuary. This terminal has been planned to receive big tonnage ships (50 000 T), over-panamax type, with a 14 m maximal draft.
The TMDC-4 wharf is made up of a reinforced concrete deck 0.25 m thick, put down on a reinforced concrete triangular network of beams 0.75 m high. These beams are supported by a network of about 300 metallic driven piles filled up with concrete in the upper part and approximately 45 m long with an outer diameter of 711, 813 or 914 mm. The wharf leans upon a backfill by means of a vertical reinforced concrete back-wharf wall (4.35 m high), and upon which the deck leans. This wall is supported by piles and has a vertical sheet-pile wall 5.2 m high that prevents the leakage of the small particles from the backfill. The wharf is anchored in the embankment by 38 passive sloped tie-rods, composed of steel cylinders (85 mm diameter and 20 m long). These tie-rods are fastened to the back-wharf wall by a ball-joint; during the laying down of the tie-rods, this anchorage device can present a gap that leads to very light loads in case of wharf displacement. At the other end, the tie-rods are anchored in the soil by a reinforced concrete plate 2.5 m high, 3.0 m wide and 0.5 m thick. The back-wharf wall is crossed by drainage channels at a height of 3.5 M.C. − level indicated in marine cards spot height (M.C.) −; they are used for avoiding hydraulic overload during downward tide. Figure 1 represents the main elements of a pile-supported wharf.
2.2 Cheviré-4
wharf
The extension of the timber terminal of Cheviré, Cheviré-4 wharf, is located downstream of the Cheviré bridge near Nantes city, in a river environment, on the left strand of the river Loire. This wharf is 180 m long and 34.50 m wide. It has been planned to receive ships up to 225
m long and 9.10 m draft. Figure 1. Cross section of a pile-supported wharf
The Cheviré-4 wharf is built on a network of 198 driven metallic piles filled up with concrete in the upper part, about 33 m long and with an outer diameter of 711, 762 or 863 mm. Capitals designed for centring the load on the piles are placed on the head of each pile. A concrete deck 0.35 m thick is put down on a network of reinforced concrete “T” type beams 1.35 m high, itself supported by the piles. The wharf is anchored by 37 passive sloped tie-rods, steel cylinders (75 mm diameter and 15 m long), behind every line of piles. These tie-rods are anchored in the back-wharf wall (2.20 m high) by means of a connecting rod, and at the other end in a reinforced concrete anchoring plate 2.6 m high and wide and 0.5 m thick. Behind the back-wharf wall a vertical sheet-pile wall 9 m high prevents the leakage of the small particles from the backfill; this curtain is linked to the back-wharf wall at its crest. The back-wharf wall is crossed by drainage channels at a height of 6.7 M.C.
3.
Structural instrumentation
An original instrumentation strategy has been achieved: it aims to follow the global behaviour of every wharf during at least 5 years after building with a view to setup prediction models. These validated models will allow basing the maintenance policy on a better understanding of the in-service behaviour. Indeed, the large dimensions of these structures, the building hazards and the soil behaviour imply the service behaviour is very different from the expected design one induced by the choice of conservative and too theoretical hypotheses at the design stage.
We achieved this aim by monitoring key components of the structure which are hardly accessible after the building period and the sensitivity of which can be measured with the actual available accuracy of sensors. The objective being the understanding of the wharf behaviour under horizontal loading −actions of the embankment, ship berthing and wind action on the cranes−, we chose then to monitor the tie-rods.
Each wharf has been instrumented on twelve tie-rods (regularly distributed along the length of the structure) in order to follow the normal load in the tie-rods cross-section. In the case of the TMDC-4 wharf, some sets of two vibrating wire strain gauges diametrically opposed and clamped by means of flanges screwed on the cylindrical steel bar have been used. In the case of Cheviré-4 wharf, resistive strain gauges have been used: two gauges bonded parallel to the axis of the rod and diametrically opposed, and two others bonded perpendicular to the rod, mounted in a full Wheatstone bridge acting as an elongation sensor and avoiding bending effects. For both instrumentations, the sensors were required not to affect the corrosion protection of the tie-rods. The two tie-rods at the ends of the TMDC-4 wharf have been monitored with 3 couples of vibrating wire sensors, instead of one, in order to study the evolution of the normal load and the moment bending along the rod.
In addition, sensors measuring the water level in the embankment (piezometers) are implanted behind the back-wharf wall and linked to a “Campbell Scientific CR10X” data logger; 3 piezometers on the Cheviré-4 wharf at both ends and in the middle and 2 on the TMDC-4 wharf at one end and in the middle. Finally, some tidal gauges (controlled by PANSN) measure the real tide level every 5 minutes. In the case of the TMDC-4, two tidal gauges are located in Donges (4 km upstream) and in Saint-Nazaire (2 km downstream), which permits to interpolate the water level in front of the wharf. For the Cheviré-4, a tidal gauge is located 1 km downstream the Cheviré bridge.
4.
Analysis of the monitoring data
The analysis is performed at the tie-rods level. The main steps are: (i) data collection provided by the data logger; (ii) analysis of the untreated data and their physical meaning; (iii) data processing in order to highlight relevant correlations.
The acquisition period is 30 minutes, ensuring to observe the tide effects on the landing. The untreated signals saved by the acquisition system provide the local physical measurements; these are frequencies in the case of the TMDC-4 and electric voltages in the case of the Cheviré-4. A classical pre-processing of the measurements must be made in order to deduce the normal load in the tie-rods. Uncertainties of measurements are estimated: they are less than 20 kN for the TMDC-4 wharf and 10 kN for the Cheviré-TMDC-4 wharf. All the measures taken into account for the present analysis are for non-operational service period (interval October 2002 to July 2003 for TMDC-4 wharf, interval January 2004 to October 2005 for Cheviré-4 wharf).
Two types of variations characterize the loads in the tie-rods:
− temporal: medium-term variations, where we question the levels of loads during a month (period of the moon rotation) and short-term variations where we are interested in the amplitude of the loads during a tide with a period of approximately 12 hours;
− spatial: variations of the load along the wharf, in each spatially distributed tie-rod.
The medium-term load variations in the tie-rods studied for the two wharves show a small evolution (Yáñez-Godoy et al., 2008a). They come on the one hand from the embankment loading and the service life conditions and on the other hand from the seasonal cycles of the tide. The analysis of the spatial load variations shows an important scatter from a tie-rod to another. This spatial variation of load shows a very distinct behaviour of the in-service structure in comparison to the
hypothesis assumed at the design stage. The research on the reasons of this variability taught us to have a prompt survey during the phase of construction. It underlines the need to define well the way of laying down tie-rods in order to keep an in-service behaviour as close as possible to the assumed and computed one. In the case of the short-term evolutions, we identified an essential cyclic component carried by the tide in order to study the sensitivity of the loads in the tie-rods to these evolutions. A survey of the effect of the tide on the load of the tie-rods allowed highlighting a phenomenon of stiffening of the complex soil-rod-anchoring plate in presence of high tide coefficients (Yáñez-Godoy et al., 2008a).
5.
Mechanical-probabilistic modelling
5.1 Identification of hazards
In such a study where sources of uncertainty and hazards are various, major contributions of randomness should be identified. The question is which potential sources of hazards explain the big scatter of load distribution with space for each pile-supported wharf. Moreover, is a probabilistic modelling of stochastic processes possible or at least are variables accessible for extending the models to non-instrumented wharves?
The following hazards and uncertainties must be considered: natural hazard (soil); soil-pile interaction; soil-tie-rods-anchoring plate interaction (STRAP interaction); effects of building conditions on the initial loadings; materials and geometry of the structure; technological device of anchorage of the tie-rods to the back-wharf wall; horizontal loadings; corrosion effects on piles and sheet-pile wall.
The sources of risk and uncertainty come mainly from the laying down of the tie-rods. We concentrate then on the modelling of the behaviour of these elements.
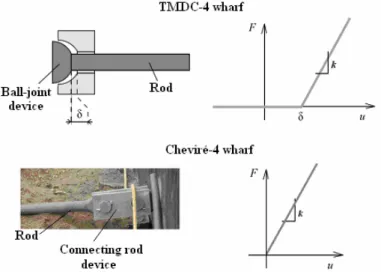
We have chosen a simple elastic model with only one mechanical parameter k(x,θ). The behaviour law for representing the
STRAP interaction is showed in Figure 2.
For the TMDC-4 wharf, additional parameter δ represents the laying down of tie-rods. This uncertainty is eliminated for the Cheviré-4 wharf due to its connecting rod device.
Parameter k justifies loading variability along the wharf. This parameter is very sensitive to both building uncertainties (placing of the tie-rods) and natural hazard of the embankment.
Figure 2. Elastic behaviour law for both wharves
5.2 Mechanical modelling
Reliability analysis suggests carrying out uncertainty and sensitivity studies before and during modelling in order to provide robust probabilistic models as input to limit state functions. We analyse effects of randomness around the main mechanical model which describes accurately the wharf behaviour by means of a finite element model. We have developed two mechanical models in order to represent spatial behaviour along the wharf subjected to horizontal loading: the first one is based on a 3-D finite-element meshing and the second one is an equivalent 2-D model. Both of 3-D wharf models are widely detailed in (Verdure et al., 2005, Yáñez-Godoy et al., 2008b).The 3-D model is considered as the referential model, but it is convenient to choose a simpler model in order to decrease computation time. The 2-D model is based on Timoshenko beam theory. The parameters of this model are taken from the 3-D model (see Verdure et al., 2005, Yáñez-Godoy et
al., 2008b). The platform is modelled by a Timoshenko beam; each row of piles in a horizontal
plane (ex r ,ey r ) is modelled by a ey r
-axis spring; tie-rods are modelled with bar elements. The simplified model allows taking into account the shear effects which come from ship mooring or transverse crane loading due to wind action.
5.3 Stochastic modelling
Loading on the tie-rods (F) is characterized by the spatial and time dependant stochastic process: random loading in tie-rods at position x and time t, F(x,t,θ). Measurements from sensors are discrete realizations F(xi,tj,θk) of this process. A time interval is chosen where the field is stationary
(with respect to time). The correlation seems important from one tie-rod to the other. However the fact of representing the stochastic process k(x,θ) by only one variable k allows reducing complexity in order to concentrate efforts on a robust development of the method of identification of random variables in section 6.1. Further papers will focus on the spatial dependence too.
6.
Reliability analysis
The administrator of the PANSN requires a maximum displacement along each wharf of 0.015 m. We consider a limit state performance criterion: G =
u
max(X ) – uc, where umax is the maximumdisplacement along the wharf, uc the critical or acceptable displacement and
X
=
{
k
,
δ
,
Fv
}
thevector of basic random variables. Characteristics of these variables are computed in next section.
umax is estimated by the 2-D deterministic model. The probability of failure is calculated then as Pf
=
P(
umax> 0.015 m).
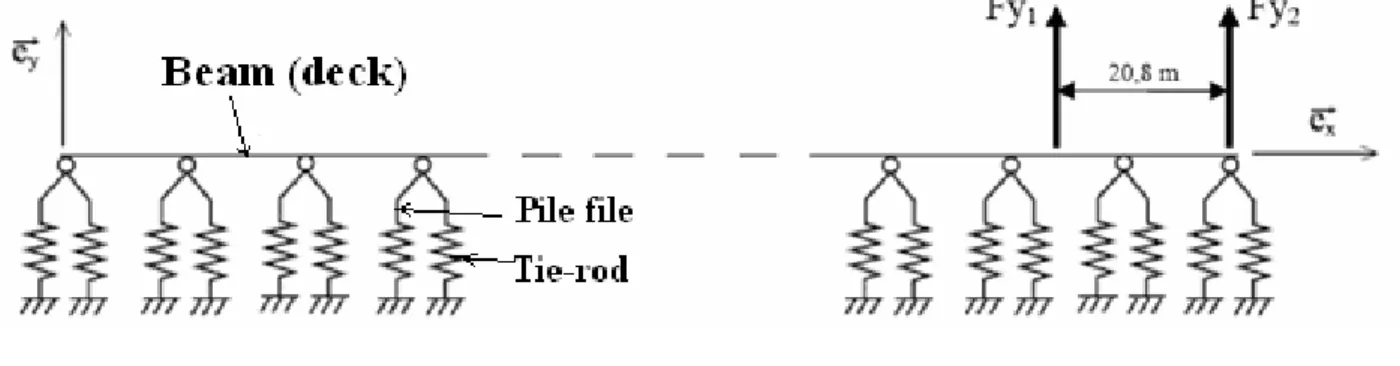
Resultant wind loadings acting on a container crane for every wharf are appliedto the 2-D model in three different places, i.e. for 3 successive situations (Figure 3 shows one of them): both extremities and middle of the wharf.
Figure 3. 2-D model
6.1 Systematic Identification of the random variables based on polynomial chaos
identification
In order to systematize the identification of random variables, a representation of every variable with polynomial chaos (PC) decomposition is chosen. The selected estimator of fitting is the maximum likelihood (Desceliers et al., 2007). Then the problem is to identify the coefficients xi of
the one-dimensional polynomial chaos decomposition for every random variable: wind loading, Fv,
gap, δ, in the ball-joint device of TMDC-4 wharf and stiffness, k, of the STRAP interaction for both wharves:
( ) (
)
∑
(
)
==
=
p i i iH x x x 0)
(
)
(
θ
ξ
θ
ξ
θ
(1)where p is the order of the PC decomposition, ξ(θ) the Gaussian germ, i.e. a standardized normal variable and Hi the Hermite polynomial of degree i. By using the maximum likelihood method,
coefficients xi are solutions of the optimization problem:
)
(
max
arg
)
(
Χ
Χ
Χ L L=
(2)where Χ is the vector of components xi (Χ=[x0,…, xp]) with dimension (p+1), and L is the likelihood
function:
(
)
∏
= = N j j x x p L 1 ); ( ) (Χ
θ
Χ
(3)The likelihood function (3) starts with values very close to the numerical precision. Then the problem (2) is modified into:
(
(Χ
))
argmin(
(
(Χ
))
)
Χ Log L
L
Log = −
− (4)
The algorithm for solving the optimization problem (4) is detailed in (Schoefs, et al., 2007;Yáñez-Godoy, et al., 2008b). We make use of it to estimate coefficients xi for every random variable.
Distributions of every random variable are well represented by a first dimension 3rd order PC. Results are presented in the next sections.
6.1.1 Wind loading
The stochastic field of wind velocity is based on both a statistical analysis of wind velocity data at a height of 10 meters (reference velocity) during 33 years of measurements, and the knowledge of the profile function of velocity with respect to the height z, knowing the reference velocity. Weibull distribution, which fits the distribution tail quite well, is selected. The crane is overall 63 meters high, the jib, 40 meters long and the distance between legs d is about 20.8 meters. The resultant of loading applied by wind on a one-dimension structural component between nodes N and P is given by:
(
)
∫
= P N x p dz C S F α with 2 2 1 z U p=ρ
(5)where S is the projected area of component cross section onto the wind direction, Cx the drag
coefficient, p, the wind pressure, α the wind direction versus wharf axis (here 45°), ρ the air density [kg/m3] and Uz the kinematics field of wind velocity (CSTB, 1995).
The deduced intensity distribution of the wind loading projected onto wharf plane and the pdf (probability density function) of the obtained first dimension 3rd order PC decomposition is plotted in Figure 4a. The two resultant wind loadings are correlated. Details are available in (Yáñez-Godoy
et al., 2006).
a) Distribution of the wind loading intensity, Fv(kN), in the
horizontal plan; mFv = 58.4 kN, σFv = 58.4 kN
b) Distribution of the gap, δ, in the ball-joint device of TMDC-4 wharf; mδ = 4.6 mm, σδ = 6.5 mm
c) Distribution of the stiffness, k, of tie-rods of Cheviré-4 wharf; mk = 61.2 MN/m, σk = 9.1 MN/m
d) Distribution of the stiffness, k, of tie-rods of TMDC-4 wharf; mk = 45.2 MN/m, σk = 14.5 MN/m Figure 4. Distribution of the random variables
6.1.2 Gap,
δ
, in the ball-joint device of TMDC-4 wharf
We determine the gap in the ball-joint device from embankment loading on the 2-D model. This loading calculated by inverse analysis is 731 kN every 6.65 m. Figure 4b shows the final histogram and the pdf of the obtained first dimension 3rd order PC decomposition. The distribution presents practically two overall blocks representing two populations of tie-rods. This reflects the influence of building conditions on this wharf: one population of preloaded tie-rods before embankment building phase (negative gaps) and one population presenting positive gaps.
6.1.3 Stiffness, k, of the STRAP interaction
We determine the stiffness for every wharf from a winter falling tide loading on the 2-D model (see Yáñez-Godoy, et al., 2008a). Figures 4c and 4d show two histograms and their pdf for the obtained first dimension 3rd order PC decomposition of both wharves. As we can see, the two populations of tie-rods of the TMDC-4 remain visible.
6.2 Computation of the probability of failure
6.2.1 Projection method
We are interested in maximal displacements umax obtained by the determinist 2-D mechanical model. Loadings applied to the 2-D model are embankment loading (731 kN, TMDC-4 wharf; 640 kN upstream zone, 189 kN downstream zone, Cheviré-4 wharf) and wind action loading. We can search an approach u~max(X) defined by:
( )
{
}
(
)
∑
− = = = ⋅⋅ ⋅ 1 0 1 1 1 max( ( ) ( )) ~ P j M k k j j M M u H X X X uξ
ξ
ξ
(6) with :(
)
( )
u
X
H
X
( )
X
dX
H
E
H
u
E
u
j M j j j=
=
∫
RM(
)
(
)
ϕ
~
~
max 2 max (7){
H0,...,HP−1}
is the Hermite polynomial chaos basis which is orthogonal;{
ξ
1,...,
ξ
M}
are thestandardized normal variables used to develop every input random variable Xl ∀l∈
{
1,...,M}
;( )
H
2j=
1
E
;( )
−
=
−2
exp
)
2
(
2 2 /X
X
M Mπ
ϕ
is a measure of multinormal probability associated to random variable X ; uj and P are respectively the coefficients to determine and the order of chaos development (P=(M + p)!(M!p!)−1, where p is the maximum degree of the polynomial approximation and M is the dimension ).Integral of the function in (7) can be obtained by Gauss quadrature numerical method [see Berveiller et al., 2005]. Gauss quadrature schema to N points is built in order to integer exactly polynomials to 2N-1 degree. The fundamental theorem of Gaussian quadrature is:
(
M) (
M)
M M M i i M i j i i N i i N i M Ru
X
H
jX
ϕ
X
dX
≈
∑
⋅
⋅⋅
∑
w
⋅
⋅⋅
w
u
X
ξ
⋅
⋅⋅
X
ξ
H
ξ
⋅
⋅⋅
ξ
∫
= = 1 1 1 1)
(
)
(
~
)
(
)
(
)
(
~
1 max 1 1 max (8)The N integration points
{
}
M i
i
ξ
ξ
, ,1 ⋅ ⋅⋅ are N roots of the Hermite polynomial of degree N.
Integration weights
l i
w can be calculated as follows:
{
M}
l NH w l l i N i 1,..., ) ( 1 2 1 ∈ ∀ = −ξ
(9)The NM combinations for weights and integration points are built according to the M input parameters
{
X
1(
ξ
1),...,
X
M(
ξ
M)
}
for the finite element code.Once coefficients in equation (7) are calculated using the deterministic 2-D model, we can represent the response distribution which allows to post-evaluate the probability of failure. Figure
5a shows the uc vs. the log of the probability of failure for TMDC-4 wharf (interval [15 mm; 16 mm])
and Pf values for the most critical situation (downstream wharf zone). Results show convergence
for 4 Gauss Points (GP). For Cheviré-4 wharf, if we consider uc = 15 mm, Pf = 0. We have
accomplished several samples of Monte-Carlo simulations to verify the accuracy of the calculated
Pf for TMDC-4 wharf; for 1.105 samples, reference value for uc = 15 mm is Pf = 6.72e-3 ±
7.69%error, either Pf = [6.2e-3; 7.2e-3]. Calculated value with projection method, 6.79e-3, falls into
this interval.
Factor omission is the relation between computed Pf with determinist k and computed Pf with
random variable k. Figure 5b shows uc vs. the omission factor with and without wind action effect.
Parameter k taken into account as deterministic is more influential here, for uc = 15 mm: Pf
=7.05e-3, with wind action effect, and Pf =6.85e-3, without wind action effect. The level is lower than
admissible probability of failure considered in Euronorms for service limit states (Calgaro, 1996).
(a)
Pf = P(umax > [15; 15.2; 15.4; 15.6; 15.8; 16 mm]): Pf = [6.79e-3; 6.53e-3; 6.28e-3; 6.08e-3; 5.85e-3; 5.64e-3]
(b)
Figure 5. Probability of failure for TMDC-4 wharf
7.
Conclusions
The complexity of wharves and their behaviour has been presented. The modelling of in-service behaviour in conjunction with structural monitoring of two structures has allowed assessing the level of loading and has provided more realistic models for mechanical behaviour and values for their mechanical parameters. A stochastic modelling has taken into account the large scatter of measured quantities and building hazards for these complex structures. A decomposition of random variables on polynomial chaos has been selected and has shown to represent well the basic variables when considering maximum likelihood estimate. It allows providing an automatic treatment of data for similar monitored structures. The probability of failure, based on a performance criterion (maximum wharf displacement), is deduced using non-intrusive methods and a determinist structural model. Sensitivity study has shown that parameter k taken into account as deterministic, for TMDC-4 wharf, is more influential. The probability of failure obtained is considered as acceptable for both wharves.
8.
References
Berveiller M., Sudret B., Lemaire M. Structural Reliability Using Non-Intrusive Stochastic Finite Elements, 12th IFIP WG 7.5 Working Conference on Reliability and Optimization of Structural
Systems, May 2005, Aalborg, Denmark.
théorie de la fiabilité. Paris : Presses de l’Ecole Nationale des Ponts et Chaussées, 1996, 200 p.
CSTB, Traité de physique du bâtiment, Tome 1 : connaissances de base. Centre Scientifique et Technique du Bâtiment, France, 1995, 832 p.
Desceliers C., Soize C., Ghanem R. Identification of chaos representations of elastic properties of random media using experimental vibration tests. Computational Mechanics, May 2007, 39(6), pp. 831-838.
Schoefs F., Yáñez-Godoy H., Nouy A. Identification of random material properties from monitoring of structures using stochastic chaos. Proceedings of the 10th International Conference on
Applications of Statistics and Probability in Civil Engineering (ICASP10), 31 July - 3 August, 2007,
Tokyo, Japan.
Verdure, L. Cadre statistique du suivi en service des ouvrages de génie civil : application à un quai sur pieux. Thèse Sciences de l’ingénieur. Nantes, France : Université de Nantes, Institut de Recherche en Génie Civil et Mécanique, 2004.
Verdure L., Schoefs F., Casari P., Yañez-Godoy H. Uncertainty updating of an on-pile wharf after monitoring. Proceedings of the 9th International Conference on Structural Safety and Reliability
(ICOSSAR 2005), June, 2005, Rome, Italy, pp. 1347-1354.
Yáñez-Godoy H., Schoefs F., Nouy A., Casari P. Extreme storm loading on in-service wharf structures: interest of monitoring for reliability updating. Revue Européenne de Génie Civil, édition
spécial « Fiabilité des matériaux et des structures et analyse des risques », 10(5), 2006, pp.
565-581.
Yáñez-Godoy H., Schoefs F., Casari P. Statistical Analysis of the Effects of Building Conditions on the Initial Loadings of On-piles Quays. Journal Structural Health Monitoring (in press), 2008a. Yáñez-Godoy H., Schoefs F., Nouy A. Overall “soil-sod-anchoring plate” stiffness identification of a monitored pile-supported wharf by a polynomial chaos representation. Journal Structural Safety (submited to Journal in August 2007), 2008b.