HAL Id: hal-00413508
https://hal.archives-ouvertes.fr/hal-00413508
Submitted on 4 Sep 2009HAL is a multi-disciplinary open access archive for the deposit and dissemination of sci-entific research documents, whether they are pub-lished or not. The documents may come from teaching and research institutions in France or abroad, or from public or private research centers.
L’archive ouverte pluridisciplinaire HAL, est destinée au dépôt et à la diffusion de documents scientifiques de niveau recherche, publiés ou non, émanant des établissements d’enseignement et de recherche français ou étrangers, des laboratoires publics ou privés.
Influence of DIC hydrothermal process conditions on the
gelatinization properties of standard maize starch
Ikbal Zarguili, Zoulikha Maache-Rezzoug, Catherine Loisel, Jean-Louis
Doublier
To cite this version:
Ikbal Zarguili, Zoulikha Maache-Rezzoug, Catherine Loisel, Jean-Louis Doublier. Influence of DIC hydrothermal process conditions on the gelatinization properties of standard maize starch. Journal of Food Engineering, Elsevier, 2006, 77 (3), pp.454-461. �10.1016/j.jfoodeng.2005.07.014�. �hal-00413508�
INFLUENCE OF D.I.C HYDROTHERMAL PROCESS CONDITIONS ON THE GELATINIZATION PROPERTIES OF STANDARD MAIZE STARCH
I. Zarguili1, Z. Maache-Rezzoug1,C. Loisel2 J.-L Doublier3
(1)Université de la Rochelle, Laboratoire LMTAI, av. M. Crepeau, 17042 La Rochelle, France (2)Laboratoire GEPEA, ENITIAA rue de la Géraudière, BP 82225, 44322 Nantes Cedex 3, France (3) UPCM-INRA, BP 71627, 44316 Nantes Cedex 3, France
ABSTRACT
Standard maize starch was hydrothermally treated at residual moisture content (~12 %) by Instantaneous Controlled Pressure Drop for various pressure levels and processing times. In order to examine the homogeneity of the starch treatment, three thicknesses (1.5, 1 and 0.5 cm) were tested at 3 bar of steam pressure. For the three thicknesses, the temperature and the moisture content of starch were measured during the treatment at the bottom and the surface. The results showed an absence of gradient of temperature and moisture content only for a thickness of 0.5 cm. Gelatinization transition temperatures (To, Tp) increased after
hydrothermal modifications. The change in the gelatinization temperature range was observed after DIC treatment when pressure level or processing time increased. For a high pressure (≥ 4 bar) associated with low processing time (2 minutes) a total gelatinization of starch was observed. It also occurs when the processing time is important (~15 min) and pressure lower than 4 bar.
Keywords : DIC hydrothermal treatment, maize starch, pregelatinized starch, DSC
Author to whom correspondence should be addressed Z. Maache-Rezzoug
Université de La Rochelle - Pôle Sciences
Laboratoire "Maîtrise des Technologies Agro-Industrielles" Avenue Michel Crépeau 17042 La Rochelle - France
1. INTRODUCTION
Starches are used in food industries for their various properties and have many industrial applications as a thickener, colloidal stabilizer, gelling agent and bulking agent. In a native state, they do not have all the required properties for food industries in terms of resistance to thermomechanical treatment and storage stability. Many methods are used to modify starch such as, drum dryer (Vallous, Gavrielidou, Karapantsios & Kostoglou, 2002), extrusion cooking (Mercier, 1987; Barron, Buleon, Colonna & Della Valle, 2000; Brümmer, Meuser, Van Lengerich & Niemann, 2002), annealing (Jacobs, Mischenko, Koch, Eerlingen, Delcour & Reynaers, 1998; Tester, Debon & Sommerville, 2000), and heat moisture treatment (HMT) (Kulp & Lorenz, 1981; Hoover & Manuel, 1996; Collado & Corke, 1999; Lim, Chang & Chung, 2001; Gunarante & Hoover, 2002). HMT, discovered by Sair & Fetzer in 1944, is considered as a method for physical modification of starch. It refers to starch exposure to higher temperatures (≈120°C), commonly above gelatinization temperature, at very restricted moisture content (18-30%) during 16 h and in some cases shorter than 16 h (Collado & Corke, 1999 ; Lim, Chang & Chung, 2001). For HMT, pressure is often required to assure sufficient heating, but uniform heat distribution and penetration into the starch is not easy to accomplish (Maruta, Kurahashi, Takayano, Hayashi, Yoshino, Komaki & Hara, 1994).
The general effects of HMT are loss of birefringence, increased gelatinization temperatures, changes in gelatinization range (narrowing or broadening of the DSC endotherm), X-ray diffraction patterns, swelling volume and solubility, with consequent changes in functionality (Sair & Fetzer, 1944; Kulp & Lorenz, 1981; Donovan, Lorenz & Kulp, 1983; Hoover & Manuel, 1996; Collado & Corke, 1999; Takaya & Nishinari, 2000; Gunarante & Hoover, 2002; Adebowale & Lawal; 2003). Hoover & Vasanthan (1994) and Hoover & Manuel (1996) reported that the extent of starch chain associations within amorphous regions and the degree of crystallinity are altered during heat-moisture treatment of wheat, oat, normal maize,
waxy maize, high amylose maize, potato and lentil starches. The magnitude of these changes was found to be dependent upon the moisture content during heat treatment and upon the starch source.
The purpose of the present work is to characterize the hydrothermally-treated starch by a recent hydrothermal process: the Instantaneous Controlled Pressure Drop (DIC) developed for some years in our laboratory (Rezzoug, Maache-Rezzoug, Mazoyer & Allaf, 2000). This technique is based on a hydro-thermo-mechanical effect induced by the abrupt transition from a high steam pressure level to a vacuum. We applied this process for starch heat treatment in order to obtain its gelatinization and to modify its functional properties. In this paper, a preliminary study was performed to optimise the thick layer of starch which leads to a homogeneous treatment. After this optimisation, the effect of the processing parameters (pressure and processing time) on the thermal properties of starch was evaluated.
2: MATERIALS AND METHODS 2.1 :RAW MATERIALS
Standard maize starch (SMS) was supplied by Roquette Frères (Lestrem, France). The moisture content was 12.5% wet basis.
2.2 : DIC APPARATUS
The general DIC apparatus presented in figure 1 is constituted of four major parts:
1. A processing vessel (2), in which products are treated at high temperature/high steam pressure (up to respectively 160°C and 6 bar).
2. A pneumatic valve (3) (complete motion in less than 1/10th of a second), in order to realise an abrupt pressure drop. This valve is opened rapidly connecting the processing vessel to the vacuum tank.
4. Manual and automatic control panel and acquisition system. 2.3 :EXPERIMENTAL PROTOCOL
The Standard maize starch (12.5% wb) disposed in circular containers (diameter: 20 cm; height: 5 cm) was treated in a processing vessel in which a vacuum of 50 mbar was established through a short communication with the vacuum tank (figure 2b). The initial vacuum is carried out to facilitate the diffusion of steam into product. Consequently, the time necessary for the temperature of the starch to reach that of the steam is reduced. Saturated steam was then introduced into the vessel at fixed pressure level (figure 2c) and maintained for a predetermined time (figure 2d). This step is followed by a sudden decompression towards vacuum (figure 2e). After the vacuum phase, an atmospheric air is injected to return to atmospheric pressure (figure 2f) and to recover the product for various measurements.
2.4:MOISTURE CONTENT
The starch moisture content was determined by air oven at 105°C during 24 h, according to the A.F.N.OR standard method.
2.5:DIFFERENTIAL SCANNING CALORIMETRY
Thermal characteristics of treated starch were studied by using a DSC Q10 (TA-instrument, France). Starch samples (10 mg) were placed in a stainless pan; distilled water was added to get a ratio of 1:9 (w/w) starch:water, mix, and then the sample pan was sealed. The DSC analyser was calibrated using indium and the thermogram was recorded with water as reference. Sample pan was heated at a rate of 10°C/min from 25 to 120°C. Thermal transition of starch samples were defined as To (onset temperature), TP (peak temperature) and ∆H was
referred to as the gelatinization enthalpy. The gelatinization temperature range (R) was calculated as 2 (Tp – To) as described by Krueger, Knutson, Inglett & Walke (1987). The
degree of gelatinization of treated starch was also calculated by the following equation (Marshall, Wadsworth, Verma & Velupillai, 1993).
100 ) 1 ( (%)= −∆∆ × raw t HH SG (Equation 1)
Where SG is the gelatinization degree, ∆Ht the transition enthalpy of DIC treated starch and
∆Hraw the transition enthalpy of native starch.
2.6 :MICROSCOPIC OBSERVATIONS
The samples were examined visually using a phase contrast microscope equipped with a CCD camera. Small amounts of sample were suspended in distilled water to 1/20 and observed using a magnification of 400 under polarised light.
3: RESULTS AND DISCUSION
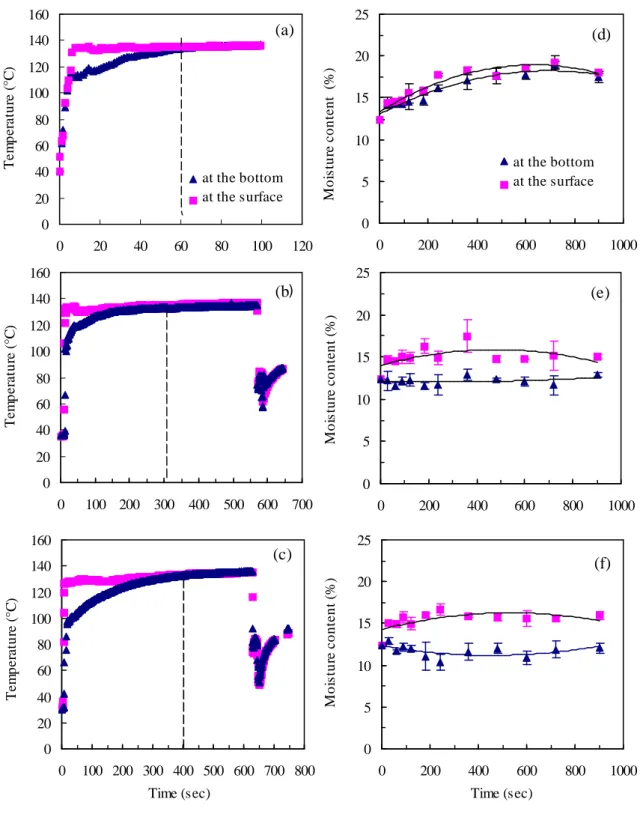
3.1: TEMPERATURE AND MOISTURE CONTENT PROFILES IN STARCH DURING THE DIC TREATMENT When the steam is in contact with the layer of starch it is ultimately absorbed as liquid water. Consequently, the latent heat of condensation is absorbed and the temperature of the product increases until reaching the surrounding steam temperature or equilibrium temperature. In this study, the temperature was measured on-line, during DIC treatment, by two thermocouples placed at the surface and the bottom of starch. Figure 3 (a)-(c) presents the evolution of temperature with processing time at pressure of 3 bar for three thicknesses of 0.5 (a), 1 (b) and 1.5 cm (c). The results show the existence of a temperature gradient between the surface and the bottom of the three thick layers, which increases with the thickness. For a thickness of 0.5 cm, the temperature gradient is eliminated in 40 seconds (figure 3-a), while it needs, under similar conditions, 170 and 300 seconds for the 1 cm and 1.5 cm thick layers (figures 3-b and 3-c), respectively. The equilibrium temperature at 3 bar of steam pressure is 136°C. According to figure 3, the time to reach the equilibrium temperature at this pressure is shorter when the thickness of products layer is low. The equilibrium temperature is reached after 60, 300 and 400 seconds for 0.5 cm, 1 cm and 1.5 cm, respectively.
Figure 3(d)-(f) presents the variation of the moisture content of starch during the hydrothermal treatment. In consideration of the standard deviation, this figure shows that there is no marked difference between the moisture content near the surface and at the bottom for a thickness of 0.5 cm (figure 3-d). The moisture content increases from 12.5 % (initial moisture content of starch, wet basis) to a maximum of 18.5 % during 400 seconds, due to absorption of condensed steam during the treatment. On the other hand, for the other thicker layers (1 and 1.5 cm), the moisture gradient is more marked (figures 3-e & 2-f).
A slight decrease of the moisture content at the bottom is observed for 1.5 cm thickness. This reduction may be caused by water evaporation resulting from the heating of the cupel. This evaporation enables the moisture content to increase on the upper surface of starch. After 600 seconds, the moisture content recovers its initial value caused by water diffusion from the upper surface to the bottom. In order to avoid heterogeneity of treatment, we retained a thickness of 0.5 cm.
3.2: EFFECT OF PROCESSING TIME
3.2.1: Gelatinization properties
The results of thermal properties, measured by DSC, of treated starch at various processing times and for 3 bar steam pressure and 0.5 cm thickness are shown in table 1 where the raw starch properties are included for comparison. From this table it appears that the DIC process influences onset temperature (To), peak temperature (Tp) and the enthalpy of gelatinization
(∆Ht). To and Tp increased with the processing time and shifted to higher values. For the
sample treated during 15 minutes, these temperatures shifted respectively from 63.3°C (native) to 80.0°C and from 69.9°C (native) to 84.2°C. Similar results were observed by Hoover & Manual (1996) for standard maize starch heat treated at 100°C for 16 h at moisture content of 30%. They also found a shift towards higher temperature for standard maize starches: 66 (untreated) against 71°C. The increase in To and Tp has been attributed by Hoover
& Vansanthan, (1994) to structural changes within the starch granules, which involves mainly amylose-amylose and amylose-lipid interactions. The broadening of temperature range (R) reaches a maximum value (3.6 °C) for the sample treated at 2 minutes. R value shifted from 13.4 °C to 17.0°C for native and starch treated at 2 minutes, respectively. R decreased for higher processing times and beyond 5 minutes, the temperature range narrowed below the value of the native starch. Hoover & Manual (1996) observed an increase in gelatinization temperature range for standard maize starch (6°C). The authors suggested that amylose-lipid interactions during heat-moisture treatment may lead to the formation of crystallites of different stabilities. The gelatinization enthalpy of native maize starch was 11.6 J/g, whereas ∆H of treated DIC starch decreased strongly to 0.57 J/g for 15 minutes processing time. From table 1, it can be seen that SG depends strongly on the conditions of DIC heat treatment. A partial and rapid gelatinization was observed during the first minute of treatment, while it became increasingly slow with time.
3.2.2 : Microscopic observations
The observation of native starch granules in the optic microscope with polarized light, shows the existence of the cross polarization (figure 4-a) for sample treated during 30 seconds (figure 4-b). The polarization cross is still clear, although a gelatinization degree of 59 % (table 1). For samples treated during longer times, the polarization cross disappears and after 15 minutes (figure 4-d), it completely disappears, which indicate that the starch is almost completely gelatinized.
3.3: EFFECT OF DIC PRESSURE LEVEL
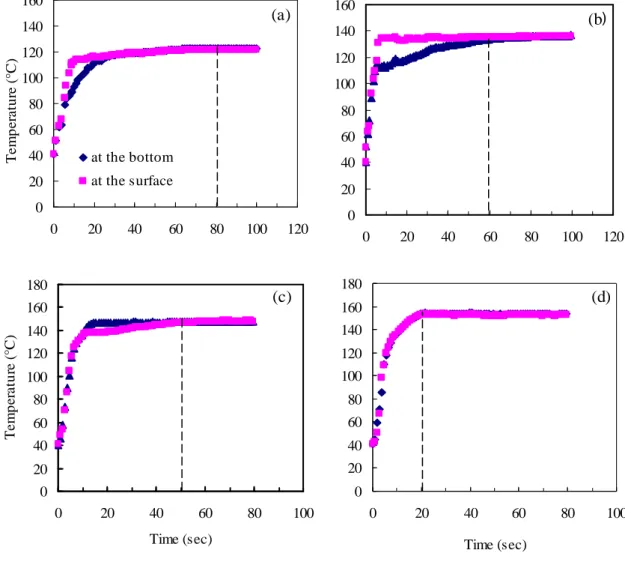
For the studied pressures, the temperatures profiles were on-line measured on the surface and the bottom of starch. The results presented in figure 5 show that the time to reach the equilibrium temperature is low when the pressure is high. It is respectively of 80, 60, 45 and 20 seconds for starch treated at 2, 3, 4 and 5 bar. Thus, 2 minutes was selected as processing
time for studying the effect of pressure level on starch properties. This time allows reaching the equilibrium temperature for all samples.
3.3.1: Gelatinization properties
The influence of pressure level during DIC treatment on the gelatinization transition temperatures (To, Tp, R) and gelatinization enthalpy (∆H) are presented in table 2 and figure
6. The DSC analysis showed that increasing steam pressure increased substantially To and Tp
and decreased ∆H of all treated samples. The heat treatment caused a broadening of 3.6°C and 4.7°C of gelatinization temperature range for the starch treated at 3 and 4 bar, respectively, in comparison with native starch. However, no significant change in R for starch treated at 2 bar was found. Similar results were obtained by Lim, Chang & Chung (2001) for heat moisture treated maize and potato starches (120°C/30 % and 130°C/25 %). The gelatinization range of treated maize starch increased by 3.9°C and 4°C for treatments at 130°C/25% and 120°C/30%, respectively.
From table 2 and figure 6, it can be seen that increasing steam pressure causes the reduction in ∆Ηt until disappearance for sample treated at 5 bar. Kudo (1993) observed that the value of
endothermic enthalpy of the gelatinization decreases with the severity of the heat-moisture treatment. The reduction of enthalpy when the steam pressure increases is related to heating effect associated to this increasing. When the saturated steam pressure increases, the temperature inside the processing vessel increases. The equilibrium temperature of the saturated steam at 2 bar is 122°C, whereas it is of 153°C at 5 bar. Lim, Chang & Chung (2001) observed a reduction in enthalpy during HMT. The authors argued that this reduction may be attributed to the transformation of the intercrystalline amorphous parts, and thus the crystalline regions could melt more easily, i.e. with lower energy. Concerning the gelatinization degree, a substantial decreasing was observed when processing pressure
increases. SG(%) is of 23.4% for starch treated at 2 bar whereas it was estimated at 100% for starch treated at 5 bar, indicating a total loss of crystallinity.
3.3.2: Microscopic observations
Microscopic observations under polarized light of treated starch at different pressures (figure 7), showed obvious polarized cross for starch granules treated at 2 bar (figure 7-a), and that the intensity of the cross of polarization is almost identical to that of the native starch (figure 4-a), indicating the preservation of the crystallinity. The intensity decreases slightly for the sample treated at 3 bar. However the cross polarisation disappears for the samples treated at 4 and 5 bar. This confirms the loss of crystallinity for the two last treatments.
CONCLUSION
The standard maize starch was hydrothermally treated at residual moisture content (~12 %) by Instantaneous Controlled Pressure Drop process. The study of the variation of the moisture content and the temperature profiles during DIC treatment for various thick layers of treated starch showed that it is necessary to work with a thin layer of 0.5 cm. This thickness allows to avoid the heterogeneity of the treatment and to ensure a uniform heat distribution and homogeneous diffusion of steam into starch layer. The thermal properties of DIC treated starch depends on the processing time and the steam pressure level. Increasing these two parameters induces an increasing in temperature transition (To and TP) and a reduction in
gelatinization enthalpy. The occurrence of a partial or total gelatinization was clearly attested by the decreasing of enthalpy and a loss of birefringence under polarized light.
REFERENCES
Adebowale, K.O., & Lawal, O.S. (2003). Microstructure, physicochemical properties and retrogradation behaviour of Mucuna bean (Mucuna pruriens) starch on heat-moisture Treatments. Food Hydrocolloids, 17, 265-272.
Barron, C., Buleon, A., Colonna, P., & Della Valle, G. (2000). Structural modifications of low hydrated pea starch subjected to high thermomechanical processing. Carbohydrate Polymers, 43, 171-181.
Brümmer, T., Meuser, F., Van Lengerich, B., & Niemann, C. (2002). Effect of extrusion cooking on molecular parameters of corn starch. Starch – Stärke, 54, 1-8.
Collado, L.S., & Corke, H. (1999). Heat-moisture treatment effects on sweet potato starches differing in amylose content. Food chemistry, 65, 329-346.
Donovan, J.W., Lorenz, K., & Kulp, K. (1983). Differential scanning calorimetry of heat-moisture treated wheat and potato starches. Cereal Chemistry, 60(5), 381-387.
Gunarante, A., & Hoover, R. (2002). Effect of heat-moisture treatment on the structure and physical properties of tuber and root starches. Carbohydrate Polymers, 49, 425-437.
Hoover, R., & Manuel, H. (1996). Effect of heat-moisture treatment on the structure and physicochemical properties of normal maize, waxy maize, dull waxy maize and amylomaize V starches. Journal of Cereal Science, 23, 153-162.
Hoover, R., & Vansanthan, T. (1994). Effect of heat-moisture treatment on the structure and physicochemical properties of cereal, tuber, and legume starches. Carbohydrate Research, 252, 33-53.
Jacobs, H., Mischenko, N., Koch, M.H.J., Eerlingen, R.C., Delcour, J.A., & Reynaers, H. (1998). Evaluation of the impact of annealing on gelatinisation at intermediate water content of wheat and potato starches: A differential scanning calorimetry and small angle X-ray scattering study. Carbohydrate Research, 306, 1-10.
Krueger, B.R., Knutson, C.A., Inglett, G.E., & Walke, C.E. (1987). A differential scanning calorimetry study on the effect of annealing on gelatinization behavior of corn starch. Journal
of Food Science, 52, 715-718.
Kudo, K. (1993). Proceedings of Australia/Japan Symposium on Food Science and Technology 1993 (pp. 205–210).
Kulp, K., & Lorenz, K. (1981). Heat-moisture treatment of starches. I- Physicochemical properties. Cereal Chemistry, 58, 46-48.
Lim, S.T., Chang, E.H., & Chung, H.J. (2001). Thermal transition characteristics of heat– moisture treated corn and potato starches. Carbohydrate Polymers, 46, 107-115.
Marshall, W.E., Wadsworth, JI., Verma, L.R., & Velupillai, L. (1993). Determining the degree of gelatinization in parboiled rice: comparison of subjective and an objective method.
Cereal Chemistry, 70, 226-230.
Maruta, I., Kurahashi, Y., Takayano, R., Hayashi, K., Yoshino, Z., Komaki, T., & Hara, S. (1994). Reduced-pressurized heat-moisture treatment. A new method for heat-moisture treatment of starch. Starch/Stärke, 46, 177-181.
Mercier, C. (1987). Comparative modifications of starch and starchy products by extrusion cooking and drum-drying. In Mercier C., & Cantarelli, C., (Eds.). Pasta and extrusion cooked
foods (pp. 120-130). London, Elsevier.
Rezzoug, S.A., Maache-Rezzoug, Z., Mazoyer, J., & Allaf K. (2000). Effect of instantaneous controlled decompression process on hydration capacity of scleroglucan. Optimisation of operating conditions by response surface methodology. Carbohydrate polymers, 42 (1), 73-84.
Sair, L., & Fetzer, W.R. (1944). Water sorption by starches, water sorption corn starch and commercial modifications of starches. Industrial and Engineering Chemistry, 36, 205-208. Takaya, C.S., & Nishinari, K. (2000). Thermal studies on the gelatinisation and retrogradation of heat–moisture treated starch. Carbohydrate Polymers, 41, 97-100.
Tester, R.F., Debon, S.J.J., & Sommerville, M.D. (2000). Annealing of maize starch.
Carbohydrate Polymers, 42, 287-299.
Vallous, N.A., Gavrielidou, M.A., Karapantsios, T.D., & Kostoglou, M. (2002). Performance of a double drum dryer for producing pregelatinized maize starches. Journal of Food
Figures captions
Figure 1. Schematic diagram of DIC reactor. 1: Steam generator; 2: Processing vessel; 3: Quick motion valve; 4: Vacuum tank; 5: Vacuum pump; 6: Recuperation tank of the condenser.
Figure 2. Typical pressure-time profile of a DIC processing cycle. (a) sample at atmospheric pressure; (b) establishment of a vacuum; (c) steam injection to reach the selected pressure; (d) treatment time; (e) pressure drop; (f) atmospheric pressure for the recovery of sample.
Figure 3. Evolution of temperature and moisture content versus processing time for DIC treated starch at pressure of 3 bar for three thick layers (a and d = 0.5 cm ; b and e = 1 cm ; c and f = 1.5 cm). The symbols ■ and ▲, represent respectively the temperature and the moisture content on the surface and on the bottom of product.
Figure 4. Microscopic observations of native starch (a) and DIC treated starch at 3 bar during 0.5 min (b), 10 min (c) and 15 min (d).
Figure 5. Evolution of temperature on the surface and bottom (thickness = 0.5 cm), versus processing time for different pressures. (a): 2 bar ; (b): 3 bar; (c): 4 bar and (d):5 bar.
Figure 6. DSC thermograms for native and DIC treated starch at different pressures.
Figure 7. Microscopic observations of DIC treated starch during 2 minutes at different pressures: (a): 2 bar ; (b): 3 bar; (c): 4 bar and (d):5 bar.
Figure 1. 1 2 3 5 6 4
Figure 2. P (atmospheric)
Figure 3. 0 5 10 15 20 25 0 200 400 600 800 1000 M o is tu re c o n te n t ( % ) %H-Fond %H-Surface at the bottom at the surface (d) 0 20 40 60 80 100 120 140 160 0 100 200 300 400 500 600 700 T e m p e ra tu re ( °C ) 0 20 40 60 80 100 120 140 160 0 20 40 60 80 100 120 T e m p e ra tu re ( °C ) T°-Fond T°-surface at the bottom at the surface (b) 0 20 40 60 80 100 120 140 160 0 100 200 300 400 500 600 700 800 Time (sec) T e m p e ra tu re ( °C ) 0 5 10 15 20 25 0 200 400 600 800 1000 M o is tu re c o n te n t (% ) 0 5 10 15 20 25 0 200 400 600 800 1000 Time (sec) M o is tu re c o n te n t (% ) (c) (f) (e) (a)
Figure 5. 0 20 40 60 80 100 120 140 160 180 0 20 40 60 80 100 Time (sec) 0 20 40 60 80 100 120 140 160 180 0 20 40 60 80 100 Time (sec) T e m p e ra tu re ( °C ) 0 20 40 60 80 100 120 140 160 0 20 40 60 80 100 120 T e m p e ra tu re ( °C ) at the bottom at the surface 0 20 40 60 80 100 120 140 160 0 20 40 60 80 100 120 (a) (b) (d) (c)
Table1: Thermal transitions characteristics of native and DIC treated starch at 3 bar and 0.5 cm thickness. Processing time (min) To (°C) Tp (°C) R (°C) ∆Ht (J/g) SG (%) Native starch 63.3 69.9 13.2 11.60± 0.31 0 0.5 64.9 73.1 16.4 4.77±0.35 58.9 1 67.3 75.1 15.6 3.95±0.20 65.9 2 69.4 77.9 17.0 3.12±0.28 73.1 5 72.7 78.2 11.0 2.10±0.32 81.9 10 75.4 81.0 11.2 1.79±0.35 84.6 12 77.2 82.5 10.6 0.70±0.15 94.0 15 80.0 84.2 8.4 0.57±0.09 95.1
Values are means of triplicate determinations: To: onset temperature; Tp: peak temperature; R: temperature range, calculated as 2 (Tp – To); ∆Ht: enthalpy of gelatinization; SG: gelatinization degree of DIC treated starch.
Table2: Thermal transitions characteristics of native and DIC treated starch at various steam pressures during 2 minutes and 0.5 cm thickness.
Pressure level (bar)/
Equilibrium temperature (°C) To (°C) Tp (°C) R (°C) ∆Ht (J/g) SG (%) Native starch 63.3 69.9 13.2 11.70± 0.31 0 2/122 66.6 72.9 12.6 8.90±0.33 23.9 3/136 69.4 77.9 17.0 3.12±0.28 73.3 4/147 72.1 81.1 18.0 0.63±0.10 94.6 5/157 - - - 0 100