O
pen
A
rchive
T
OULOUSE
A
rchive
O
uverte (
OATAO
)
OATAO is an open access repository that collects the work of Toulouse researchers and
makes it freely available over the web where possible.
This is an author-deposited version published in :
http://oatao.univ-toulouse.fr/
Eprints ID : 15089
To link to this article : DOI:10.1016/j.electacta.2015.10.052
URL :
http://dx.doi.org/10.1016/j.electacta.2015.10.052
To cite this version :
Iranzo, Audrey and Chauvet, Fabien and
Tzedakis, Théodore Influence of electrode material and roughness
on iron electrodeposits dispersion by ultrasonification. (2015)
Electrochimica Acta, vol. 184. pp. 436-451. ISSN
0013-4686
Any correspondence concerning this service should be sent to the repository
administrator:
[email protected]
Influence
of
electrode
material
and
roughness
on
iron
electrodeposits
dispersion
by
ultrasonification
A.
Iranzo
a,b,
F.
Chauvet
a,b,*
,
T.
Tzedakis
a,b,**
aUniversitédeToulouse,INPT,UPS,LaboratoiredeGénieChimique,118RoutedeNarbonne,F-31062Toulouse,France bCNRS,UMR5503,F-31062Toulouse,France
Keywords:
zero-valentironelectrodeposition sonoelectrochemistry
adhesionenergy surfaceroughness electrodepositsdispersion
ABSTRACT
This studyrelates thesonoelectrochemical productionof metallicparticles andnanoparticles. The emphasis is on the influence of electrode material and roughness on the morphology of iron electrodepositsandtheirdispersionfromtheelectrodebyultrasonification.Ultrasonificationiseither appliedduringcyclicvoltammetrieswithsolutionstirringoraftergalvanostaticironelectrodeposition; nodispersionwasobservedwhenusingagoldelectrode,whereasdispersionwasalwaysobservedwhen usingvitreouscarbon(VC) substrates.ScanningElectronMicroscopy (SEM)imagingofthe electro-depositsshowshigherironcoverageongoldthanonVCelectrodes.IronspreadsmoreongoldthanonVC. Thevaluesofboththeinterfacialenergyoftheiron/electrodeinterfaceandtheworkofadhesionofiron ontheelectrodeareinagreementwiththepreviousobservations.DispersionkineticsonVCwerefound tobedependentontheelectrodesurfaceroughness.Resultssuggestthatdispersionfollowsafirstorder kinetics,whichiscoherentwiththeconstantactionofcavitationbubblesinthevicinityoftheelectrode surface.Enhancementofmass-transferbyultrasoundhasalsobeenobserved.
1. Introduction
Iron-based nanoparticles (Fe3O4,
g
-Fe3O4, nickel-cobalt-ironalloy)exhibitinterestingmagneticpropertiesinthemedicalfield,
suchascontrastagentsforMagneticResonanceImaging[1,2]andfor
treatment of tumors by hyperthermia [3,2]. Recent studies [4]
indicatethatzero-valentironnanoparticles(ZVI-nP)showbetter
magnetic performancethanironoxidesformedicalapplications.
ZVI-nPcanalsobeusedforvariousotherapplicationssuchasan
effective reducing agent: i) in water treatment [5], ii) for
dechlorination[6,7],iii)nitrateremoval[7–9],andiv)for destruction ofvariousotherpollutants(see[5]foranextensivereview).
ZVI-nPcanbesynthetizedbyseveraltechniques(see[10]and
[5] for an exhaustive list):ball milling [11], thermal reduction
(reductionofironsalts[12]andreductionofoxide[13]),ironsalts
wet-chemical reduction [6,14] (using borohydride salt as a
reducing agent) and direct electrochemical reduction [15,16,9].
Themostwidelyusedtechniqueisthewet-chemicalmethod.
Scaling-upofwet-chemicalmethod,inordertoproducelarge
quantities of ZVI-nP, requires expensive reagents and specific
securityconditionsbecauseofthegaseoushydrogenproduction
[12].
DirectelectrochemicalZVI-nPsynthesisappearsasapromising
techniqueforeconomicandsafeproductionprocesses,especially
atalargescale;thereducingreagentisreplacedbyelectricityand
under controlled conditions hydrogen production is avoided.
Nevertheless, metallic iron, produced at the cathodic surface,
mustberemovedfromtheelectrodeanddispersedintheliquidat
therequiredsize.Variousworksinvolveultrasonicdispersionof
electrodepositediron, simultaneouslyor sequentiallywith
iron-precursorsreduction,allowingtherenewalofthecathodesurface.
Generally,powerultrasounds(!20kHz,usinganultrasonichorn
orbath)areusedtogeneratecavitationbubblesthat,duringtheir
violentcollapses,createfluidmotionwhichremovessoliddeposits
fromtheelectrodesurface.During ironelectrodeposition,under
sequential pulses of the appliedcurrent, Delplancke et al. [15]
applyshiftedpulsesof ultrasounds,usinga titaniumultrasonic
horn (20kHz, 50W/cm2), also used as the polarized cathode.
Nanoparticles(6nm-100nm)ofpureFeandalloysofFe/Ni/Cohave
been successfully synthetized in aqueous solutions; partial
‘chemicaloxidation’ofpureironparticleshasbeenobserved.In
* Correspondingauthorat:LaboratoiredeGénieChimique,UMRCNRS5503, UniversitédeToulouseIII-PS, INPT,118routedeNarbonne,F-31062Toulouse, France.Tel.:+33561557468.
**Correspondingauthorat:LaboratoiredeGénieChimique,UMRCNRS5503, UniversitédeToulouseIII-PS, INPT,118routedeNarbonne,F-31062Toulouse, France.Tel.:+33561558302.
E-mailaddresses:[email protected](F. Chauvet),
anotherstudy[16],cathodeisassembled bothwithahigh
(0.2-2MHz, 5W/cm2) and a low (20kHz, 100W/cm2) frequency
ultrasonictransducerswhoirradiatethecathodicarea;constant
current electrolyses werecarried out intetrahydrofuran, under
ultrasonification,and10nmsizedZVI-nPareproducedwhenthe
lowandthehighfrequencytransducersareusedsimultaneously.
Chenetal.[9],claimthatZVI-nPrangingbetween1-20nmwere
synthetized using aqueous 1M FeCl3 in the presence of
cetylpyridiniumchlorideas a dispersingagent; atwo platinum
electrodes‘classicalelectrochemicalcell’,‘entirely’immersedinto
anultrasonicbath(20kHz),wasusedandgalvanostatic
electrol-yses were carried out under ultrasonification. Other metallic
nanoparticles(silver,palladium,platinum,zinc,nickel,gold)have
beensynthesizedbythesonoelectrochemicalmethod,see[17]for
areview.Previousstudiesweregenerallydevotedtodetermining
thebestoperatingparameters(pulsetimes,current,temperature,
ultrasoundsintensity,stabilizers,etc.)foragivenset-upallowing
thesynthesisofdesirednanoparticles.
Effectsofpowerultrasoundonvariouselectrochemicalsystems
have also been extensively studied. Ultrasounds are generally
appliedusingatitaniumultrasonichornactingastheultrasound
generator placed in front of the working electrode (‘face-on’
configuration); the working electrode can also be directly
integratedontheultrasonichorn([18]).Anotherpossibilityisto
immersetheelectrochemicalcellinanultrasonicbath[19].Among
other effects and regardless of the experimental configuration,
ultrasounds induce cavitation bubbles and acoustic streaming
whichenhancemass-transferleadingtoanincreaseofthecurrent
[20–25,19].Currentfluctuationsarealsoobservedduetoviolent bubblecollapses[21,26,27].
Theabilityofthefluidmotionandalsotheshocksinducedby
ultrasoundto‘clean’theelectrodesurfacehasbeeninvestigatedin
severalworks.Cavitationbubblecollapsesinducedbyultrasound
werefoundtobeabletoactivateelectrodesavoidingpassivationby
‘eroding/roughening’ the electrode material [28,19]. Coupling
mercury electrodeposition and ultrasonification simultaneously
on a vitreous carbonelectrode has led to a ‘steadystate’regime where
the quantity of electrodeposited Hg on the electrode remains
constant(electrodepositionflux=ablationflux)[29].Under
ultra-sonification,theelectrodepositionofmetalssuchasZn,Co,Pb,and
Hg, was investigated on a vitreous carbon substrate by cyclic
voltammetryin[30](seealso[31]).Theauthorsanalyzedtheratioof anodictocathodicchargesasafunctionoftheultrasoundintensity,
for theirparticular experimentalconditions (potential scanrate,
sonoelectrochemicalsystem,electrodematerial...),andshowed
thatitdependsonboththeultrasoundintensityandthemetalused.
Thissuggests theimportance of metal/substrate affinityon the
electrodepositsdispersion.Consideringthecaseofaparticlelyingon
asubstrateandsubmittedtoultrasonificationin[32],theauthors
discussedthecompetitionbetweenthehydrodynamicforcesand
theadhesionforceasafunctionoftheparticlesize;theyshowedthat
ultrasoundsshouldbeabletoremovesubmicrometerparticlesbut
not smaller particles such as molecular adsorbates (adhesion
outweighshydrodynamicsforces).
Thesepreviousstudiesshowthattheefficiencyofultrasoundto
remove/disperseelectrodepositedmetalsshoulddependon:
-theultrasound intensity (and theexperimental configuration
used)[30,31]
-thesize/morphologyandthespatialdistributionofdeposited
metallicparticles[32]
-theadhesionenergyofelectrodepositedmetalontheelectrode
material
Note that, todate, theeffect of the adhesion energy of the
electrodepositedmetalontheelectrode substrate,hasnotbeen
directlyinvestigated.
In the present work, the dispersion by ultrasound of iron
electrodepositsisstudiedforvariouselectrodematerials(goldand
vitreouscarbons)whichallowstovarytheadhesionenergy.The
effect of the electrode material on the morphology of the
electrodepositedironisalsostudiedbySEMimaging.Theinfluence
of the electrode surface roughness is investigated using VC
electrodeshavingdifferentlevelsofpolishing.
Nomenclature
A geometricsurfacearea(m2)
Aelect Hamakerconstantof electrode material, elect=AuorVC(J)
Aelect=L=Fe Hamakerconstantforelectrodematerial
(elect = Au or VC) and iron interacting
acrosstheliquid(J)
Ar Argon
AFe;AL Hamaker constants of the iron and the
liquid(J)
CHþ Protonsconcentration(mol/m3)
d Separationdistance(m)
D Diffusioncoefficient(m2/s)
e Thicknessofthedeposit(m)
Eadh AdhesionenergyofirononVCelectrode=
WFe=VCSFe=VC (J)
E Electrodepotential(V)
F Faradayconstant(96,500C/mol)
h Localsurfaceheight(m)
jlim Limitingcurrentdensity(A/m2)
I,Iapplied,Ilim Current, applied current and limiting
current(A)
MFe Molecularweightofiron(kg/mol)
n Electronsnumber
Qc,Qa,andQaref Respectivelythecathodic,theanodicand
theanodic referenceamountof charges
(C)
r Potentialscanrate(mV/s)
ra Arithmeticroughness(m)
rw Wenzel's roughness = ratio between
actualsurfaceandgeometricalsurface
s Dispersionrateconstant(s#1)
Sdisk Surfaceareaofthediskelectrode(m2)
t Time(s)
tUS Ultrasonificationduration(s)
WFe=elect Workofadhesionofironontheelectrode, elect=AuorVC(J/m2)
x,y Cartesiancoordinates(m)
Greekletters
g
a Surfacetensionofmediuma(J/m2)g
a/b Interfacialtensionbetweenbothmediaaandb(J/m2)
g
elect Surfaceenergyoftheelectrode,elect=AuorVC1orVC2(J/m2)
g
dandg
p Respectively thedispersiveand thepolarcom-ponentsofthesurfaceenergy(J/m2)
h
Overpotential(V)r
Fe Volumetricmassofiron(kg/m3)n
Kinematicviscosity(m2/s)F
a/b Adjustmentparameterwhichdependsoninter-actionsbetweenbothinteractingmediaaandb
Thestudyisbasedontheanalysisofelectrochemical
measure-ments:voltamperometriesandgalvanostaticelectrolysescoupled
simultaneously or sequentially with ultrasonification.
Experi-mentswererealizedinaclassicalelectrochemicalcellimmersed
in an ultrasonic bath. Two different salts (FeCl2 and (NH4)2Fe
(SO4)2)wereusedasironelectrodepositprecursors.
Experimentalresultsonironelectrodepositsmorphologyand
adhesion are discussed on the basis of a theoretical analysis,
enablingtheestimationoftheworkofadhesionandtheinterfacial
tensionbetweenironandthesubstrate,whichispresentedinthe
Appendix.
2. Materialandmethods
2.1.Chemicalsandexperimentalset-up
Allsolutions,preparedusingultrapurewater(18.2M
V
.cm),were deaeratedbeforeexperiments(Argon,1bar),foraduringofatleast15min; argon sparging duringthe experiments whichwereachieved
atroom temperature(18<T($C)<22),exceptfor experimentsunder
ultrasonicirradiation,forwhichthetemperatureslightlyincreases
(
D
T<5$C).Solutionscontaining0.01Mofiron (II)werepreparedby dissolvingNormapursolid FeCl2or(NH4)2Fe(SO4)2 (Mohr’ssalt)supplied by Sigma-Aldrich. Solutions also contain respectively
0.1MKClor0.05MK2SO4assupportingelectrolytes,andtheirpH
wasadjustedto4.0,usingHClorH2SO4respectively.
The iron(II)was preferredtoiron (III)inordertoavoidthe
oxidationofelectrodepositedironbythelatter.Moreover,using
two different counter-ions (chlorideor sulfate)allows tostudy
theireffectonthemorphologyoftheelectrodepositediron.
FeCl2wasselectedbecauseitisasimple,solubleandcheapiron
(II) salt;it has already been used to study iron nucleationon
vitreouscarbonin[33].Furthermore,anotherwork[9]hasshown
thatironnanoparticlescouldbesynthetizedby
sonoelectrochem-istryusingFeCl3.
(NH4)2Fe(SO4)2complex,preferredtothesimplesaltFe(SO4)2,
was alsostudiedthankstoits‘chemical stability’againsttothe
oxidationbyoxygen.
Electrochemical experiments were performed in a classical
threeelectrodescell(50mL),eitherbycyclicvoltammetricscansor
bygalvanostaticelectrolyses;arotatingdiskwasusedasaworking
electrode (Radiometer,EDI101T),a platinumfoilconstitutesthe
counter electrode, and a saturated calomel electrode (SCE)
immersedwithinaLuggincapillaryisthereferenceelectrode.
Solutionwasalwaysstirredbytherotationofthediskelectrode
(angular velocity
v
=1000rpm). For cyclic voltammetry, thepotential scan rate r is equal to 20mV/s except for particular
cases where lower scan rates were used. For galvanostatic
electrolyses, theappliedcurrent isequal to90%of thelimiting
current correspondingtoFe(II)reduction which ismeasured on
cyclicvoltammetryscans(withoutultrasound).
Depending onthe experiment, the electrochemical cell was
immersedinanultrasonicbath(FisherScientificFB15057,37kHz,
750W,6.9L).ApotentiostatVoltalabPGZ100from
Radiometer-Analytical isusedtoachievetheelectrochemicalmeasurements.
Voltamaster4istheelectrochemicalsoftwareusedtocontrolthe
potentiostat. Working electrode material is either gold (2mm
diameter,purity>99.99%)orvitreouscarbon1(VC1,3mmdiameter,
purity=99.96%)orvitreouscarbon2(VC2,3mmdiameter,purity=
99.99%). VC1 was provided by Carbone Lorraine Company and
VC2wasprovidedbyOrigalysCompany.Chemicalcompositionof
these VCelectrodesareslightlydifferent:0.04%ash contentand
50ppmsulfurandboretracesforVC1, 0.0042%ashcontentand
13.5ppmmetaltracesforVC2(dataprovidedbysuppliers).Themain
differencebetweenVC1andVC2isthatVC1hasfabricationdefects
(smallvoidinclusionsinitsvolume)andthusitssurfaceexhibits
holeswith diametersof about1-10
m
m(even afterpolishing at0.3
m
m), while the VC2 has no defects. VC1 and VC2 surfacescharacterizationisgiveninsection3.3wheretheeffectofelectrode
surfaceroughnessonelectrodepositadhesionisdiscussed.
Electrodeswerepolishedusingaluminaaqueoussuspensionof
9,5,1and0.3
m
monarotatingpad.Theelectrodesweresonicatedfor 5minutes in a 50:50 ethanol/water mixture between each
polishing and 5minutes more in ultrapure water to remove
remainingaluminaparticles.
2.2.Electrodesurfacecharacterization
Thesurfacesof theelectrodes werevisualized byanoptical
microscope(ZeissAxiolab)andsurfaceprofilesweremeasuredby
aninterferometricsurfaceprofiler(Zygo3D).Usingdataprovided
byZygo3Dmeasurements,Wenzel’sroughnessrw(definedasthe
ratio between actual surface and geometrical surface) can be
estimatedusingthefollowingequation:
rw¼1A Z A ffiffiffiffiffiffiffiffiffiffiffiffiffiffiffiffiffiffiffiffiffiffiffiffiffiffiffiffiffi 1þrhðx;yÞ2 q dxdy ð1Þ
whereAisthegeometricsurfacearea,histhelocalsurfaceheight
andx;yaretheCartesiancoordinates.rwwascomputedusinga
home-madeMatlabprogram.Arithmeticsurfaceroughnessrawas
computedbytheZygosoftware.
2.3.Measurementofsurfaceenergiesofelectrodes
Electrodesurfaceenergyorsurfacetension
g
elect(elect=AuorVC1orVC2)isanimportantparameterallowingtheestimationof
both the work of adhesion of metallic iron on the electrode
materialinelectrolyticsolutionWFe=elect and alsotheinterfacial
tensionbetweentheelectrodeandtheiron
g
Fe=elect.ThesurfacetensionsofthegoldandVCelectrodes,
g
Au,g
VC1andg
VC2,wereobtainedbymeasuringthecontactanglesofaseriesofliquidsof
known surface tensions directly on the polished electrodes
surfaces(Owens-Wendt‘oneliquidmethod’[34]).Contactangles
ofultrapurewater, glycerol,dimethylsulfoxideanddecane were
measuredwith a GBXDigidrop goniometer DGD fast/60 using
!2
m
Lliquiddropletinambientconditions.Themeasurementofcontact angles was reproducible in the range )5$. Absolute
uncertaintyon
g
electmeasurementislowerthan4mJ/m2.2.4.Electrodepositmorphologyanalysis
MorphologyofironelectrodepositswasobservedbySEMwith
aMEBFEGJEOLJSM7100FTTLSoraMEBFEGJEOLJSM7800F
Prime-EDS. Before observation, the sample was rinsed with
ultrapure water (to avoid electrolyte crystallization) and dried
underambientconditions.Toavoidelectronsbeamdeviation(due
to the presence of insulating material surrounding the disk
electrode),thewholesamplesurfacewascoatedbyananometric
layer of gold by vapor deposition, if required. An electric
connectionbetweenelectrodesandtheSEMsupportwasinsured
byabrassstudadaptedtotheelectrode.
3. Resultsanddiscussion
3.1.Ironelectrodepositionbycyclicscanvoltammetryundersilent conditions
3.1.1.Fe(II)electrochemicalbehaviourongoldandvitreouscarbon
electrodes
The electrochemical behavior of Fe(II) salts used (FeCl
2 and
electrolytesand onthreedifferentelectrodespolishedwiththe
finestaluminasuspension(0.3
m
m):VC1,VC2andgold.Voltam-perometriccurvesobtained(understirring)withoutFe(II)(residual
currents,seeinsetsinFig.1aandb)revealadiffusion-limitedwave
attributedtothereductionofthefreeprotonsatpH=4:
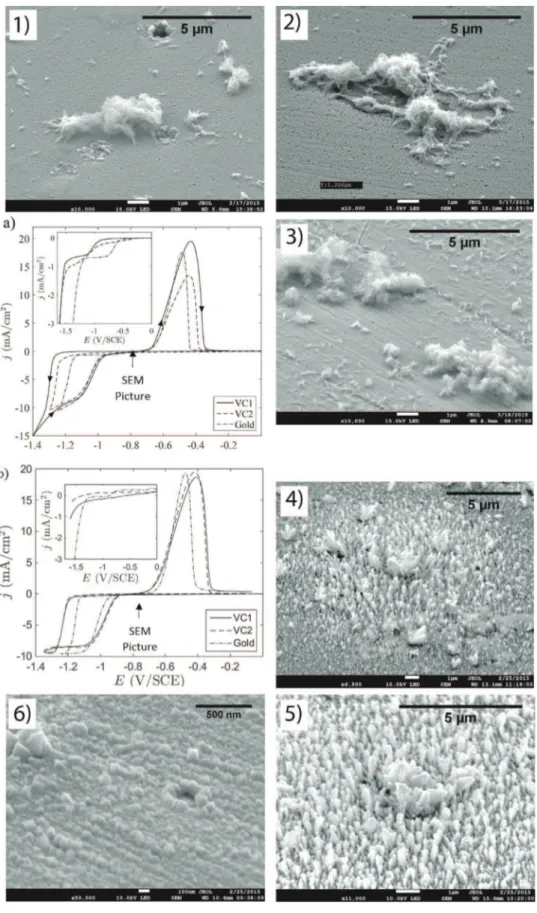
Fig. 1.CyclicvoltammetryscansandthecorrespondingSEMpictures.a)andb):curves(forwardandbackward,seearrowsina))obtainedonarotatingdiskelectrodeforthree differentmaterials:VC1,VC2andgold.a):Mohr'ssaltsolution,b):FeCl2solution.Insets:Residualcurrents(forwardcurves).SEMpictures(takenattheendofthecathodic cycle,seethearrowona)andb)):1)to3)ironelectrodepositsusingMohr’ssaltsolutiononrespectivelyVC1,VC2andgoldelectrodes;4)to6)ironelectrodepositsusingFeCl2 solutiononrespectivelyVC1,VC2andgoldelectrodes.
H++e#
!1/2H2. (2)
Curves obtained with the electrolyte K2SO4 alone (inset in
Fig.1a)exhibit a resolute diffusion-limited wave,of which the
limitingcurrent,evenlowmagnitude(0.65mA/cm2),appearstobe
constantforthethreeexaminedmaterials(samehydrodynamics).
ConcerningthecurveobtainedinpresenceofKCl(insetinFig.1b),
it doesnot showa clearsignalfor theH+ reductionbeforethe
reductionofwater(2H2O+2e#!H2+2OH#),exceptforthegold
cathode.IndeedtheH+reductionontheVCisnotvisible(seeinset
in Fig.1b)becauseitis shiftedtomorenegativepotentialsand
screenedbywaterreduction.Thisphenomenonhasalreadybeen
observedbyGrujicicandPesic([33])whostudiediron
electrode-positionfromsulfateandchloridesolutionsonVC.Moreover,for
the gold cathode, thecorresponding limiting current (0.34mA/
cm2)ishalfofthemagnitudeofsulfatesystemones(0.68mA/cm2).
Thisratioof2betweentheselimitingcurrentvaluesisattributed
tothedi-acidnatureofH2SO4comparedtothemono-acidnature
of HCl. Indeed, a solution of sulfuric acid and K2SO4 at
pH=4 contains thefollowing species: H+, HSO
4#, SO42#and K+,
soafter theconsumptionof thefreeH+,HSO
4#dissociates and
supplyadditionalH+whichcouldbereduced.Thisleads,forthe
sulfatesystem,toanapparentH+concentrationtwotimeshigher
thantheoneforthechloridesystem,andexplainswhyalimiting
current(whichisproportionaltoconcentration)thatistwotimes
higherhasbeenmeasuredforthesulfatesystem.
Valuesforlimitingcurrentdensity,jlim,canbeestimatedusing
Levich'sequation([35]): jlim¼0:62:n:F:D2=3:v#1=6:C
Hþ:
v
1=2; ð3Þwheren,F,D,v,CHþand
v
arerespectivelytheelectronsnumber,the Faraday constant, the diffusion coefficient, the kinematic
viscosity,theprotonsconcentrationandtheangularvelocity.
TakingthevaluesforD,CHþ,and
n
ofrespectively9.3+10#9m2/s([36]),10#4Mand10#6m2/sleadstoj
lim=0.33mA/cm2whichis
in accordance withthe measuredvalueof jlim for the chloride
system(0.34mA/cm2,C
Hþ=10#4M).
Inthepresenceofironsalts(Fig.1aandb),allcurves(1000rpm,
20mV/s) exhibit an additional signal attributed to the Fe(II)
reduction:
Fe(II)+2e#!Fe(0). (4-a)
Forallexaminedelectrodematerials(gold,VC1andVC2),the
firstscan(startingat+0.2V/SCEtowardcathodicpotentials)clearly indicatesaslowredoxsystem,reductionsofFe(II)toFestartingat
around-1.2to-1.3V/SCEontheinitiallybareelectrodes.Duringthe
firstscan,vitreouscarbonsandgoldarepartiallycoveredby
zero-valentiron,sooncetheswitchingpotentialisreached,substrates
tendtoactasanironelectrode.Indeedatthepotentialscanrate
used, cathodiccurves obtainedduring the return scan (-1.4 to
-0.4V/SCE),exhibitaresolutediffusion-limitedwave,
correspond-ingtotheFe(II)reductionsonthenativeiron surface.It canbe
noticedthatforMohr'ssaltsolutions(Fig. 1a),thediffusion-limited
wave(pseudo-plateau)isnotwelldefinedduetotheco-reduction
of free protons on electrodeposited iron followed by water
reduction.Thisdistinctionbetweenchlorideandsulfatesystems
forironelectrodepositionhasalreadybeenobservedbyGrujicic
andPesic([33]).
Forthebackwardscans,thecathodiccurrentwascanceledat
theequilibriumpotentialswhichlieintherange[!-0.9to!-0.8V/
SCE]fortheKClmediumand[!-1to!-0.9V/SCE]fortheK2SO4
medium.ThesepotentialsremainrelativelyfarfromtheFe2+/Fe
Nernst'spotentialE=-0.44-0.25+0.03x(log(10#2/1))=-0.74V/
SCE.Thiscouldbeexplainedbythefollowingreasons:
-theFe(II)ionscomplexedwithchlorideorbyammonium/sulfate
ions(Mohr'ssalt),sotheredoxsysteminvolvedisdifferentfrom thesimpleFe2+/Fesystem
-co-reduction of free H+ (even at the equilibrium potential)
disturbstheredoxpotential oftheFe2+/Fesystem duetothe
increaseofthepHatthecathode.
The anodic curves obtained during the backward scan for
potentialshigherthan-0.8V/SCE,exhibitpeaksattributedtothe
ironelectrodepositoxidation(forbothKClandK2SO4mediaand
forthethreesubstrates,Fig.1aand1b): Fe(0)
!Fe(II)+2e#. (4-b)
The sharp decrease in current, clearly indicates complete
oxidationoftheelectrodepositandtheregenerationoftheinitially
baresurfaceoftheworkingelectrode(gold,VC1andVC2).Thisis
theendofonecompletecycleoftheoperatedexperiments.
3.1.2.Influenceofelectrodematerialonironelectrodeposit morphology
Ironelectrodeposits,obtainedonthethreesubstratesandfor
bothchlorideandsulfatemedia,wereobservedbySEMattheend
ofthecathodiccycle.TheresultingpicturesareshowninFig.1,
pictures1–6.
Inchloridemedium,a clearmorphologicaldifferencecanbe
noticedbetween iron electrodeposits obtained on goldand on
vitreouscarbonelectrodes(Fig. 1,pictures4–6).Indeed,onthegold
electrode (Fig. 1, picture 6), the SEM image reveals iron
electrodepositasacompactlayerthatcoverswelltheelectrode
surface.Thislayerconsistsofcubicstructuressizedintherangeof afewhundrednanometers.Conversely,ontheVCsubstrates(Fig. 1,
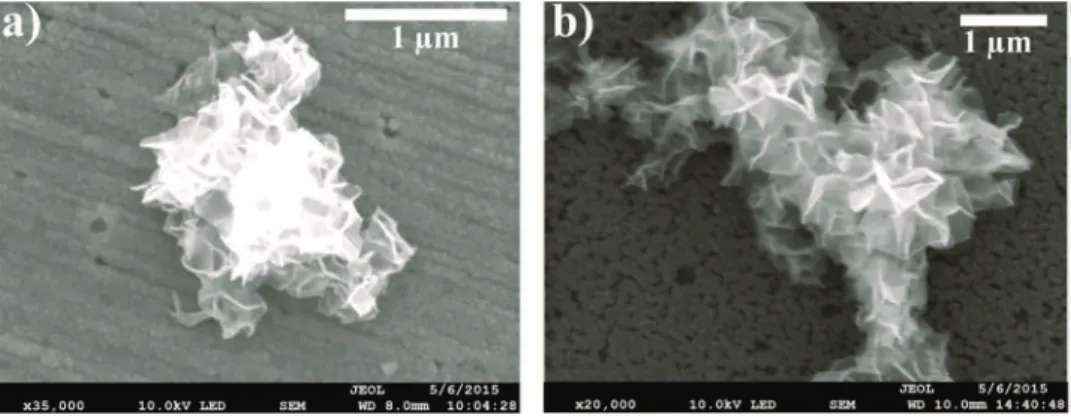
Fig.2.SEMpicturesofironelectrodepositsformedafteracathodiccyclebyvoltamperometry(startingat0.2V/SCE,reversedat-1.3V/SCE,stoppedat-0.8V/SCE)using Mohr’ssaltsolutionforthegoldelectrodea)andfortheVC2electrodeb)respectively.
pictures4and5)ironelectrodepositsappearassmallmicrometric
dendriticstructureswithheightsnotexceeding1
m
m.InMohr’ssaltmedium,ironelectrodepositedongold(Fig.1,
picture3)andonVCsubstrates(Fig.1,pictures1–2)presentquite
similarmorphologywithathinlayerofironcoveringthesurface
(verified by Energy Dispersive X-Ray Spectroscopy) with iron
micrometricstructuresonit.However,amoredetailedanalysisof
thisthinlayerofiron(Fig.2)showsthatitcoversmoreonthegold electrode(Fig.2a)thanontheVC2electrode(Fig.2b).Indeed,on
theVC2electrode,thethinlayerofironisnotcontinuous,some
holes(darkspots)arevisiblerevealingtheVCsubstratethrough
them.On contrary,onthegoldsubstrate,thislayer isfarmore
continuous.
IronelectrodepositmorphologydependsontheFe(II)saltand
thesolutioncompositionaswellastheelectrodematerial.Ithas
beenshownthatspecificcounter-ionsadsorptioncouldinfluence
electrodepositmorphology([37]).Here,wefocusontheeffectof
theelectrodematerialontheironelectrodepositmorphology,and
ourobservationsshowthatelectrodepositedironhasmoreaffinity
withgoldthanwithvitreouscarbonelectrodes.Ironspreadsbetter
ongoldthanonVCduringitselectrodepositionforbothmedia
used.Ithastobenoticedthatnodifferenceisobservedbetween
electrodepositsonVC1andthoseonVC2.
Fromtheelectrodepositiontheory([38]),itisshownthatthe
growthmode (from2D to3D)ofa crystalstronglydepends on
theinterfacialenergyofinterfacebetweentheelectrodepositand
the electrode
g
Fe=elect (with elect corresponding either to AuelectrodeortoVCelectrodes).Crystalsobtainedforlowvaluesof
g
Fe=electarealmostflat(2Dgrowth)andconverselycrystalsgrowpreferentiallyperpendicularlytotheelectrodesurface(leadingto
poorlycoveredelectrode surface)forhighvaluesof
g
Fe=elect (3Dgrowth).
Contactanglemeasurementswereachievedfor goldandVC
substrates, see Table 1. Using a theoretical development, the
differencebetween
g
Fe=VC andg
Fe=Aucanbeestimatedfromthemeasurementsofsurfaceenergies(seetheAppendix).Apositive
andnon-negligiblevaluelyingintherange[205.4mJ/m2;58.9mJ/
m2]wasdeducedfor
g
Fe=VC#g
Fe=Au whichisinaccordancewiththemorphologicalobservationsofironelectrodeposits.
Voltamperometriccurvesindicatedin Fig.1a)and 1b),show
thattheoverpotentials
h
requiredforironreductionontheinitiallybaregoldelectrode(thefirstforwardscan)
h
Auaresystematicallylowerthan
h
VC1!h
VC2 forboth mediaused.Therefore,alowerenergy(lowercellvoltage)isrequiredtocreate/increasetheFe/Au
interfacethantheFe/VCinterface.Thisisinaccordancewiththe
previous analysis showing that a higher energy is required to
increasethesurfaceareaoftheFe/VCinterfacethantoincreasethe
one of the Fe/Au interface during iron electrodeposition
ð
g
Fe=VC>g
Fe=AuÞ.To conclude,during a cathodiccycle onVC electrodes, iron
electrodepositsbegintogrowfollowinga3Dmode,leadingrapidly
toadendriticgrowth.Onthegoldelectrode,ironelectrodeposits
begintogrowfollowinga2Dmode(thinfilmgrowth)whichdelays
theappearanceofthedendriticgrowthmodeasitisclearlyvisible
inthecaseofchloridemedium(Fig.1,pictures4–6).
3.1.3.Influenceofironelectrodepositmorphologyonlimitingcurrent ofFe(II)reduction
The differences in iron electrodeposit morphologies, as
discussed above, can be revealedby a detailed analysis of the
voltamperogramsforbothmedia(chlorideandsulfate).
Inchloridemedium,thegreatdifferenceinironmorphology
observed for gold and VC electrodes (see Fig.1, pictures 4-6)
explainstheslight,butsystematicdifferenceoflimitingcurrent
values, measured for both substrates (cathodic backward scan,
Fig.1b).Aspreviouslymentioned,onthegoldelectrode,theSEM
imagerevealsquasitotalcoverageoftheelectrodesurfacebyathin ironlayer.Therefore,theelectroactivesurfaceareaforthegolddisk
canbeconsideredasthegeometricalsurfacearea(seeaschematic
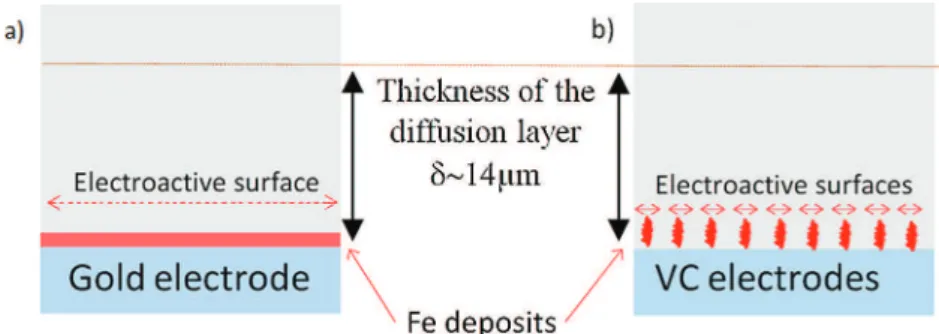
representationoftheelectrodepositsinFig.3aforgoldand3bfor VC).Conversely,ontheVCelectrodes(Fig.1,pictures4and5)iron
electrodeposits consist of relatively small dendrites of which
heights (<1
m
m) are lower than the thickness of the diffusionboundary layer thickness (estimated at !14
m
m). For the VCelectrodescase,electroactivesurfaceareaislimitedtothesumof
surface areas of the growing dendrites tops(projected surface
area) which is lower than the geometrical surface areaof the
electrode(seeFig.3b).ThefactthatthelimitingcurrentsofFe(II)
reductioninchloridemedium,usingVCelectrodes,arelowerthan
thoseusinggoldcanbesimplyexplainedbya reduced
electro-activesurfaceareaassociatedwithirondendriticgrowthontheVC
electrodes,butnotonthegoldelectrode.
In Mohr’s salt medium, similar magnitudes of the
pseudo-limiting current were measured for gold and VC electrodes
(cathodicbackwardscansinFig. 1a,correspondingtothereduction
ofFe(II)onthesubstratecoveredbytheironelectrodeposit).This
differentbehaviouris explainedbytheveryslightdifferencein
iron electrodeposit morphologies (comparatively to chloride
medium)obtainedongoldandonVCelectrodes(Fig.1,pictures
1–3).
3.1.4.Fe(II)/Fe(0)kineticsonthegoldelectrode
Inadditiontothedifferencesobservedinthelimitingcurrent
forthethreeelectrodematerials,differencesalsoappearbetween
goldandVCelectrodesforlowcurrents,onthebackwardcathodic
curves (Fe(II) reduction) on electrodeposited iron; while these
curvesdonotoverlapinchloridemedium(Fig.1b),theyoverlapin sulfatemedium(Fig.1a).Moreover,inchloridemedium(Fig.1b),
thebackwardcurvesforVC1andVC2overlapandexhibitlower
overpotential(activationareastartingat!-0.9to!-1.05V/SCE)in
comparison to the backward curve obtained using the gold
electrode (higher overpotential, activation area starting at
!-0.95 to !-1.15V/SCE). The iron electrodeposits morphology
(Fig.1, SEM pictures 4–6) could explain the surprising lower
overvoltageobservedonVCelectrodes;indeed,theiron
electro-depositonthegoldelectrode(picture6inFig.1)ismoreuniform
but not really ‘massive’, while iron electrodeposited on VC
electrodes (pictures 4 and 5 in Fig. 1) presents micrometric
dendritesinametalliciron‘massive’orbulkform.
Theeffectofthepotential scanrate onthecurrent-potential
curvesshape,aswellasonthedepositstructure,forthereduction
of Fe(II) on gold substrate, was examined in Fig. 4. Decreasing
potential scan rates(20!8!2mV/s)ledtoan increasein the
amount of iron produced during the cathodic scan
(5.7!14.7! 62.7 mC). Consequently, SEM pictures in Fig. 4b
and4cofirondeposit,producedonthegoldsubstrateduringa
cathodicscan,showthat increasingtheamountof irondeposit
leadstoachangeinitsstructure.
Aspreviouslymentioned,irondepositsproducedongoldduring
thecathodicscan,spreadontheelectrodesurfaceasathinlayer.The
SEM picture (Fig. 4c) reveals that for a scan rate of 20mV/s,
thethicknessofthedepositisabout90nmwhichisclosetothe
Table1
SurfaceenergiesofVC1andVC2electrodes.gd and gp are respectively the dispersive and the polar components of the total surface energy
gelect¼gdþgp.
gd(mJ/m2) gp(mJ/m2) gelect(mJ/m2)
VC1 19)2 10)2 29)2
calculated thickness: equivalent compact layer thickness e¼ðMFeR I:dtÞ=ð2F
r
FeSdiskÞ=67nm. This confirms the spreadingofironanda2Dgrowthofthedepositonthegoldelectrode.A3D
growthofthedepositisobtainedonlywhenalargerquantityof
ironisdeposited(Fig.4b)forlowscanrates8mV/sand2mV/s.Asa
firststep,ironspreadsonthegoldsurfaceandoncethesurfaceis
totallycovered,deposit startstogrowthfollowinga 3Dgrowth
modeanddendriticmorphologyappears.Indeed,decreasingthe
scan rate from 20mV/s to 8mV/s leads to a change from a
homogeneousandultrathindeposit(Fig.4c)toamicrometricand
dendriticdepositthatcanactasabulkironelectrode(Fig.4b). TheI=f(E)curvesobtainedforthethreescanrates(Fig.4a)are
similartothoseindicatedinFig.1b;theforwardcathodicscans
exhibit a diffusion-limited plateau at -1.2V/SCE for which the
magnitudeofthelimitingcurrentisnotaffectedbythepotential
scanrate.Thismeansthatforthethreecurvesthesystemoperates
inasteadystate;thelimitationofthecurrentisduetotheconstant
agitation applied. Concerning the backward cathodic scan, the
curvesshowthat,decreasingthepotentialscanrate(20!8!2
mV/s)causes thehalf-wavepotential of theFe(II)reduction on
native iron, to shift to the anodic values (-1.014!-0.992!
-0.938V/SCE).Thisfactsuggestsasystemwhichtendstobecome
morereversible(toreachthebehaviourofa‘bulkiron’electrode)at
low scan rates, because for longer electrolysis durations the
amountofirondepositedishigherand adendriticstructure(of
micrometricsize)isobtained.
Thereforetheshapeofthecathodiccurvesisdictatedbythe
structureofirondepositedandthereforebythequantityofiron
produced.
Potentialscanratealsoaffectsthepotentialoftheoxidationof
theiron-depositsignal;themorethescanratedecreases(20!8
!2mV/s),themoretheoxidationoftheirondepositedonthegold
electrode becomes easier (-0.550, -0.566 and -0.598V/SCE),
suggestinga‘bulkironbehaviour’.
Itcanbeconcludedthattheelectrodepositobtainedat20mV/s
issothin(67nm)thatitselectrocatalyticpropertiesareaffectedby
the electronic collector (gold) and the Fe(II) reduction (and
oxidation)appearsasaslowersystem.Thiseffectisnotobserved
onVCelectrodesbecause,evenat20mV/s,thecorrespondingiron
electrodepositsconsistsofmicrometricirondendrites,whichare
inabulkironform(Fig.1,SEMpictures4and5).
3.2.Ironelectrodepositionbycyclicscanvoltammetryunder
ultrasonification
TheelectrochemicalbehaviourofFe(II)during
ultrasonification
wasinvestigatedinchlorideandsulfatemediaandforthethree
electrodespolishedwiththefinestaluminasuspension(0.3
m
m):VC1,VC2andgold.Theelectrochemicalcellwasimmersedinthe
Fig.3. Schematicrepresentationoftheironelectrodepositmorphologiesobtainedinchloridemedium.a):onthegoldelectrode(relatedtotheSEMpictures6inFig. 1),b):on theVC1andVC2electrodes(relatedtotheSEMpictures4–5inFig.1).
Fig.4. a)Potentialscanratedependenceofthevoltamperometrycurves(forwardandbackward,seearrowsina))obtainedonarotatinggolddiskelectrode,immersedinthe FeCl2solution.SEMpicturesofironelectrodepositobtainedongoldafteracathodiccycle(startingat0.2V/SCE,reversedat-1.25V/SCE,stoppedat-0.8V/SCE)atb)8mV/sand c)20mV/s.
ultrasonicbathandspecialcarewastakentoalwaysputthecellin
thesameplaceinthebathsoastogeneratethesameultrasound
intensity into the cell. Cyclic voltamperometry was performed
underultrasonificationorundersilentconditionsandthesolution
was continuously stirred(
v
=1000rpm, potential scan rate=20mV/s).ResultsaregiveninFig.5.Aspreviously,forwardscanstarts
fromtheopencircuitpotential(OCP!+0.2V/SCE)andgoestothe
cathodicdirection(to-1250mV/SCEforthegoldelectrodeandto
-1350mV/SCEforVCelectrodes);thenthescanwas reversedto
potentialsofaround0V/SCEinordertogetthebackward‘cathodic
andanodicparts’oftheI=f(E)curve.
3.2.1.Effectofultrasoundonmasstransportduringironelectrodeposit growth
Current-potential curves obtained under ultrasonification
(Fig.5)exhibithigherFe(II)reductionlimitingcurrents(obtained
duringbackwardscan)thanthoseobtainedundersilentconditions
(withtheexceptionofcurrent-potentialcurvesinFig.5cwhich
willbediscussedbelow).Thisisduetoultrasoundsthatinduce
cavitation bubbles and acoustic streaming, causing additional
convection near the electrode and then increasing the
mass-transport flux of the electroactive species [20–25,19].Current
fluctuations,that arehighly visible,especially onthe
diffusion-limited plateau of Fe(II) reduction (see Fig. 5a, b, eand f),are
attributedtosuccessiveeventsofthecollapseofcavitationbubbles
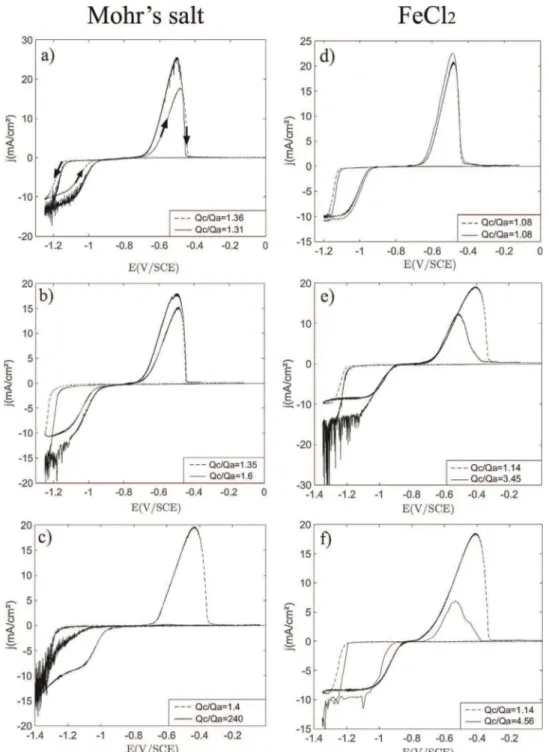
Fig.5.Cyclicvoltammetryscans(forwardandbackward,seearrowsina))obtainedonarotatingdiskelectrodeforthreedifferentmaterials:gold(a)andd)),VC1(b)ande)) andVC2(c)andf)).Curvesina),b)andc)obtainedwithMohr'ssaltsolution;curvesind),e)andf)obtainedwithFeCl2solution.Dashedlines:silentconditions,solidlines: ultrasoundactivated.TheratiobetweenthecathodicchargeQc, and the anodic charge Qa, is given for each casein the legend.
closetotheelectrodesurfaceinducinglocalandtransientvigorous stirring([21,26,27]).Itisinterestingtonotethatforcurrentlower
thanthelimitingcurrent,intheactivationarea(duringbackward
scans, reduction of Fe(II) on Fe(0)), current
fluctuations are not
observed(Fig.5a,b,c,eandf)andthecurves,withandwithout
ultrasound,tendtooverlap(especiallyinFig.5bande).Thisisin
agreementwithpreviousstudiesshowingthatultrasoundsaffect
electrochemical processes mainly via mass-transport
enhance-mentandonlyslightlytheelectrodekinetics[39,20,30].
TheincreaseinlimitingcurrentofFe(II)reductiononthegold
electrode in chloride medium, when ultrasounds are activated
(Fig.5d),islow(relativeincreaseof7%), comparedtotheother
onescorrespondingtocurvesinFig.5a,b,eandf(relativeincrease
from15to60%).Onthebasisofelectrodepositedironmorphology
obtainedbySEMimaging(Fig.1,pictures1–6),itappearsthatthe
electrodepositthat hasgrownonthegoldelectrode inchloride
mediumandundersilentconditions(Fig.1,pictures6)istheonly
onetogrowasathinfilm.ForallotherFe(II)saltsandelectrode
material combinations, electrodeposited iron presents
micro-metric dendrites reaching about 1
m
m height (Fig. 1, pictures1–5).Submittingthesolutiontoultrasoundscausesanincreasein
thelimitingcurrentassociatedwiththedecreaseindiffusionlayer
thickness [21,22]. Furthermore, the fast growth of the iron
electrodeposits probablyleadstohigherdendrites withheights
greaterthan1
m
m,similartothethicknessofthediffusionlayer.Consequently,theelectroactivesurfaceareaincreasesleadingtoa
currentmagnitudeincrease(seetheschematicrepresentationin
Fig.6).Forelectrodepositgrowthasafilm(thedendriticgrowthis
delayed and such a couplingis notexpected), theelectroactive
surfacearearemainsequaltothegeometricalsurfaceareaofthe
electrodeandthecurrentincreasesonlyduetotheenhancement
ofmasstransportbyultrasounds.Therefore,thisanalysisallowsto
giveanexplanationfortheobserveddifferencesin thelimiting
currentincreaseswithultrasoundsbetweenthethinfilmgrowth
modeandthedendriticgrowthmode.
3.2.2.Effectofultrasoundonironelectrodepositsdispersion
Theintegrationofbothcathodic(forwardandbackward)waves
andanodicpeak(Fig.5)allowtogettheamountofchargeforFe(II)
reduction,Qc,andforFe(0)oxidationQa.Thecomputedvaluesof
theratioQc=QaaregiveninlegendsofFig.5.Qc=Qavalues,higher than1inallcases,areusedbelowascriteriontodiscusstheeffects
of adhesion and ultrasound on iron electrodeposits dispersion
fromtheelectrode.
Inabsenceofultrasonification,Qc=QaobtainedinFeCl2(!1.10)
islowerthanthoseobtainedinMohr'ssalt(!1.35),becauseofthe
co-reduction of bothH+and partially ofwater during theFe(II)
reduction(asalreadysaidinsection3.1.1).Notethatthecurrent
consumptionbyH+andwaterreductionconstitutesa drawback
(lossinfaradicyieldforFe(II)reduction),butalsotwoadvantages:i)
consumption of H+ in the diffusion layer, so limitation of the
corrosionofzero-valentirondeposit,andii)productionofalittle
partofH2whichallowslimitationoftheoxidationbytheresidual
oxygen.
Concerningtheadhesion/dispersionoftheironelectrodeposit
onthegoldelectrode(Fig.5aandd),theeffectoftheultrasounds
appears minor in both FeCl2 and Mohr’s salt media; indeed
comparisonoftheratioQc=Qa(seelegendsinFig.5aandd)with
ultrasonification(1.31inMohr'ssalt;1.08in FeCl2)andwithout
(1.36 in Mohr’s salt; 1.08 in FeCl2) shows very similar values,
demonstratingthatallironelectrodepositedduringFe(II)reduction
remains on the gold surface and oxidizes totally during the
backwardanodicscan.Conversely,forVCelectrodes(seeFig.5b,c,
eandf),ironelectrodepositsdispersionisobservedineverycase,
Qc=Qaobtainedwithultrasoundisatleastequalto1.6anditis
alwayshigherthanQc=Qavaluesobtainedundersilentconditions
(Fig.5b,c,eandf).
NotethatfortheelectrolysesusingtheMohr'ssaltsolutionand
theVC1electrode(Fig.5b),eveniftheremovalofthedepositis
observedQc=Qa=1.6),theanodicpeak(andalsotheamountof
charge),whenultrasoundsareactivated,ishigherthantheone
obtainedundersilentconditions.Asdiscussedin[30]and[31],this
isduetotheenhancementofmass-transferbyultrasoundleading
tolargerdepositionrateandthenalargerquantityofironisformed
ontheelectrodecomparedtothesilentconditioncaseevenifsome
partofthedepositisdispersed.
Ironelectrodepositappearstoadheremuchmoreonthegold
electrodesurfacethanontheVCelectrodessurfaces,becauseof
thehighadhesionenergybetweenbothmetals;thesoliddeposit
requires higher ultrasonification power to be removed and
dispersed in the liquid. These results are in agreement with
estimationofworksofadhesionpresentedintheAppendix:work
of adhesion of iron on gold WFe=Au=148.7mJ/m2 and work of
adhesionofirononVCWFe=VC=17.3mJ/m2.
ConcerningVC1electrode(Fig.5bande),similarcurvesand
Qc=QaratioareobtainedinMohr’ssaltandinFeCl2.ForMohr’s
salt,Qc=Qareaches1.6withultrasound,andthemainpartofthe
irondeposit(62.5%) remainsontheVC1electrode surfaceeven
underultrasonification.ForFeCl2,ultrasonificationappearstobe
Fig.6.Schematicrepresentationsofpossiblediffusionlayerconfigurationsforthetwomaintypesofironelectrodepositmorphologyencountered,thinfilm(a1andb1)and dendritic(a2andb2),undersilentconditions(a1anda2)andwithultrasonification(b1andb2).
moreefficient,Qc=Qareaches3.45withultrasounds.Nevertheless,
ultrasonification effect on iron deposit dispersion appears less
efficient onVC1 than on VC2 (see Fig 5b, c, e and f). Indeed,
VC2electrodeledtothemostinterestingresults(Fig.5candf)
particularlywithMohr'ssaltsolutions(Fig.5c).Theanodicpeak
correspondingtotheremainingiron,electrodepositedduringthe
cathodicscan,ismissing,indicatingthatalltheironelectrodeposit
wasremovedfromtheelectrodesurfaceandQc=Qareaches240
(instead 1.4 without ultrasound)! In addition, the backward
cathodicscan(Fig.5c)tendstooverlaptheforwardcathodicscan,
meaningthatFe(II)reductiontakesplaceonanalmostclean/bare
surface,whereironelectrodepositsarerapidlyandcontinuously
removedthankstoultrasounds.Ironelectrodepositsadhesionon
VC2electrodesurfaceisveryweakandtheyaredispersedeasily
duringtheirformation.Thesameeffect,evenlessimportant(in
comparisonwiththeMohr’ssalt),isobservedwithFeCl2onVC2
(Fig.5f),Qc=Qareaches4.56underultrasonification.
A similar analysis of the evolution of the ratio Qc=Qa as a
functionoftheultrasoundintensityhasbeenachievedin[30]for
the electrodeposition of metals (Zn, Co, Pb and Hg) on a VC
electrodeusingaface-onconfiguration.Theoverlappingofboth
thecathodicbackwardandtheforwardscans(asobservedinthe
presentstudy,Fig.5c)wasnotobservedinthislaststudy,evenfor
thehigherultrasoundintensity.Thissuggeststhat
electrodepos-itedmetalsparticleswerealwayspresentonVCelectrodesurface
duringthecathodicpartofthescan.Asdiscussedin[30](seealso
[31]),thedispersionratewasnotsufficientlyhightoovercomethe
deposition rate during the cathodic part of the scan. The
experimental configuration, used in the present study, clearly
shows that iron particles can be very rapidly removed by
ultrasound allowing to operate continuously (with an almost
‘bare’substrate).
Thislastobservationisimportantfromapracticalpointofview becauseitshowsthatitispossibletodrivetheelectrodepositionof
ironsimultaneouslywithitsalmosttotaldispersionthatshould
leadtothe continuoussynthesis of fineiron particles(limiting
theirgrowth).Onanotherside,asitcouldbeseeninFig.5c,the
cathodicchargeislowerthanintheothercases,leadingtoalower
synthesisrate.Asdiscussed,in[30]and[31],thecompetitiveeffect
ofmetaldepositionand itsdispersioncouldbeadjusted bythe
control of both the Fe(II) concentration and the ultrasound
intensity.
Tosumup,maindifferencesinthedispersionofiron
electro-depositedongoldandVCelectrodes,areduetoa differencein
workofadhesionbetweenironandthesesubstrates.
However,differencescanalsobeobservedbetweenapparently
similarVCelectrodes:VC1andVC2.Dispersionbyultrasonification
ismoreefficientonVC2thanonVC1,suggestingthatironadheres
lessonVC2thanonVC1.Todemonstratethisassumption,contact
anglemeasurementwereachievedforVC1andVC2,andresults
wereindicatedinTable1,giving
g
VC1andg
VC2.ThevaluesofthesurfacetensionsofVC1andVC2electrodesare
very similar (
g
VC1!g
VC2, averaged value=30mJ/m2).
g
VC2 isfoundtobeslightlyhigherthan
g
VC1probablybecauseofaslightdifferenceintheirchemicalcompositions(seesection2.1)andthis
couldinduceabetteradhesiononVC2thanonVC1(seeAppendix).
Nevertheless,experimentshaveclearlyshownabetteradhesion
onVC1thanonVC2,implyinganotherparameterasresponsibleof
thisobserveddifference.TheeffectoftheVCelectrodessurface
roughnessisanalyzedinthefollowingsections.
3.3.InfluenceoftheroughnessoftheVCelectrodeonthedispersionof electrodepositediron
Theroughnessofthesurfaceof theelectrodeis aparameter
whichcouldinfluencetheadhesionofiron.BothVCelectrodes’
surface were characterized by optical microscopy and by an
interferometricsurfaceprofiler(Zygo3D),Fig.7.Thesmallvoid
inclusions withinthe VC1 (visible asholes onits surface with
diametersintherange1to10
m
m,Fig.7band7-2)correspondtomanufacturingdefects.Conversely,VC2doesnotexhibitholeson
itssurface;remainingpolishingstripesarevisibleonthesurface
profileandtheirheightsremainlessthan30nm(Fig.7-1).
Decreasing the roughness of the electrode surface enables
easier electrodeposit dispersion in the liquid. In order to
specifically study the effect of the electrode roughness on
electrodeposit dispersion, independently ofiron growth, in the
nextsectionwefocusonthedispersionkineticsofiron
electro-depositedundersilentconditions.
Iron deposition was achieved by galvanostatic electrolysis
undersilentconditionsusingtherotatingdiskelectrode(
v
=1000Fig.7. Opticalimagesandsurfaceprofilesofthepolished(aluminasuspensionat0.3mm)VCelectrodesusedinthepresentstudy;forVC2a)opticalimageand1)surface profile;forVC1b)opticalimage,2)surfaceprofile.
rpm) and the sameelectrolytes composition. In order toavoid
significant hydrogen production, the applied current, Iapplied,
correspondsto90%ofthelimitingcurrent,Ilim,obtainedduring
thebackwardcathodicscanundersilentconditions.Theduration
of electrolysis
D
t was chosen in order to obtain an ironelectrodeposit withan equivalentiron-compact-layer of 85nm.
Afterelectrolysis, therotationofthedepolarizeddiskelectrode
(cathode disconnected from the anode), was maintained and
ultrasonificationwasimmediatelyactivated(ornot)foraspecific
durationtUS.Inordertoevaluatetheeffectofultrasonificationon
the dispersionof the deposit,an anodic scan was immediately
carried out after the ultrasonification phase (from the OCP
!-0.730V/SCE to +0.2V/SCE at 20mV/s, maintaining electrode
rotationandwithoutultrasonification).
Theamountofcharge(Qa)correspondingtotheoxidationof
theremainingdepositontheelectrodesurfacewasthenevaluated.
NotethatQawascomparedwithanamountofcharge,thuscalled
Qaref,whichwasmeasuredduringa‘referenceanodicscanwithout
ultrasounds’;Qarefcorrespondstotheoxidationoftheirondeposit
not submittedtoultrasonification(tUS=0)afterelectrolysis.The
results obtained for the operating parameters investigated are
presented in Fig. 8, where the ratio (Qa/Qaref) is plotted as a
functionoftUS.Points oneachcurvecorrespondtotheaverage
valuesQa/Qarefmeasuredforatleastthreeexperiments;errorbars
correspondtostandard deviations.Asindicated above,theiron
depositonthegoldelectrodeisnotaffected(orveryslightly)by
ultrasounds; thereisnodispersion.Forthis reason,thissection
focusesonthevitreouscarbonelectrodesVC1andVC2only,andit
presentstheeffectofbothprecursors(FeCl2andMohr’ssalt)onthe
dispersionofthesolidirondeposit.ThecurvesQa/QarefversustUS
(Fig. 8) are analyzed with the help of SEM pictures of the
electrodepositedironnotsubmittedtoultrasonification(insetsin
Fig.8).
3.3.1.Ironelectrodepositsmorphology
The Morphologyof iron electrodeposits formedby
galvano-staticelectrolysis(insetsinFig.8)isdifferentfromthoseformedby
voltammetry(Fig.1).ForFeCl2andbothVC1and VC2(insetsin
Fig. 8a and b), electrodeposited iron morphologies consist of
micrometric‘rounded particles’and submicrometric iron
struc-tures covering the remaining VC surfaces, while dendritic
structures were obtained with voltammetry. It can be noticed
thattheroundedparticleshavecoalescedinsomecases,forming
biggerflakes.ThisisclearlyobservedontheVC2electrode(insetin
Fig.8b).
Themorphologiesobtainedbygalvanostaticelectrolysisappear
more‘homogeneous’ (lessdendritic)than theonesobtainedby
voltammetry.Amongothereffects,thiscouldbeattributedtothe
electrodepositionmodeandthecathodiccurrentemployed;with
voltammetry, electrodeposition is conducted under continuous
evolutionoftheappliedvoltageandtheresultingcurrent(which
reacheditslimitingvalue),whilegalvanostaticelectrolysescarried
outwitha currentclose(90%) tothelimiting current.Asoften
observedingalvanostaticelectrodeposition,electrodeposittends
to be dendritic/powdery when applied current is equal to, or
higherthanthelimitingcurrent([40–42]).Evenwhentheapplied
currentisjustbelowthelimitingcurrent,a‘lessrough’and‘less
dendritic’electrodepositmorphologycouldbeobtained[41,42].
ForMohr'ssaltandbothVC1andVC2(insetsinFig.8candd),
metallicirontakestheformofmicrometricstructuresasforthe
depositionobtainedbyvoltammetry;buthere,thesemicrometric
structures seem to have grown under the form of a ramified
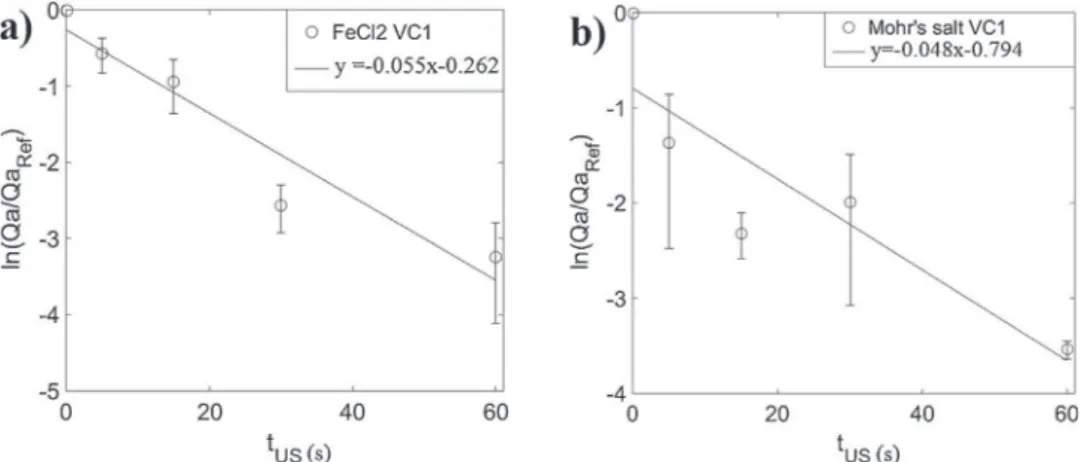
Fig.8.DimensionlessironquantityQa/Qarefremainingontheelectrodeasafunctionoftheultrasonificationduration(tUS).Experimentsa)(VC1)andb)(VC2)wereachieved intheFeCl2solution.Experimentsc)(VC1)andd)(VC2)wereachievedintheMohr’ssaltsolution.PointscorrespondtotheaveragevaluesQa/Qarefmeasuredforatleastthree experiments;errorbarscorrespondtostandarddeviations.Insets:SEMimagesoftheelectrodepositsjustaftertheelectrolysis(notexposedtoultrasonification).
structurecoveringallthesubstratesurface.FortheVC2electrode (insetinFig.8d),aproportionoftheirondepositpartiallypeeled
off the electrode surface, probably solely due to the effect of
electroderotation.Comparatively,theiron depositfromMohr’s
salt on VC1 (inset in Fig. 8c) consists of the same deposit
morphologybutitremainsstuckontheelectrodesurface.
IntheFeCl2media,itseemsthattheseironparticles(especially
theflattenedones,insetin Fig.8b)alsopartiallypeeledoffthe
electrodesurfaceinthecaseofVC2electrode.Therefore,theseSEM
images, taken just before theultrasound phase, showthat the
adhesion of iron electrodeposits to the electrode seems to be
weakerfortheVC2thanforVC1.Indeed,inthefollowingsection,
thisobservation isconfirmedbyelectrochemicalmeasurements
indicatedontheplotofQa=Qaref asafunctionoftUS
3.3.2.Dispersionbyultrasonificationofiron‘electrodepositedunder silentconditions’
3.3.2.1. Ultrasound action for two VC substrates and two salt
precursors.
Theeffectofthesubstrate(VC1andVC2)ontheirondispersionfor
both FeCl2 and Mohr’s salt precursors were examined. All the
curves(exceptFig.8b)exhibitadecreaseoftheratioQa=Qaref asa
functionoftUS,meaningthatthequantityofthedispersediron
increasesprogressivelywithtimeduringultrasonification.
Forallexperiments,anultrasonificationdurationof60sallows
theremovalofmost(!90%)oftheirondeposit,anddispersesit
intotheliquid.StandarddeviationoftheratioQa=Qaref hasbeen
determinedin both mediaand with both substrates. For short
ultrasonificationtime,resultsarenothighlyreproducible,butthey
becomemorereproducibleforlongerdurations.Furthermore,the
quantityoftheirondepositremainingonthesubstratedecreases
progressively with time; this is particularly visible for the
VC1electrode(Fig.8a andc). FortheVC2electrode, dispersion
istoofasttoobservethisbehavior,especiallyinthecaseofFeCl2
medium(Fig.8b).
The progressive removal of iron from the VC1 electrode is
explainedbytheoperatedmodeofultrasonicdispersion.Indeed,
constant-power-ultrasound produces cavitation bubbles in the
liquidata constantrateperunit ofvolume.However,onlythe
collapsesofcavitationbubblesinthevicinityoftheirondeposit
surfacecancauseitslocaldispersion.Thefluxofremovedparticles
shouldthenbeproportionaltothequantityofirondepositpresent
ontheelectrodesurface.Thus,decreasingtheironquantityatthe
surface,reducestheremovedparticlesflux,asobserved
experi-mentally. A simple first order kinetics model can be built to
quantifythisbehavior:
d dt Qa Qaref % & ¼#sQaQa ref ; ð5Þ
withsbeingthedispersionrateconstant(s#1)thatshoulddepend
on the ultrasound power, on the adhesion energy
Eadh¼WFe=VCSFe=VC (SFe=VC beingthesurface areaof theiron/VC
interface) and on the size and distribution of particles on the
electrode. Equation (5) leads to the exponential decrease: Qa/
Qaref(t)=exp(#st).Theplotofln(Qa/Qaref)versustUSusingdata
fromFig.8aandcareshowninFig.9.Dispersionaroundthelinear
bestfitcurvesisobserved(duetotheresultsthatarenottotally
reproducible).Nevertheless,itshouldbepointedoutthatthisvery
simplemodelcapturestheoveralldynamicofthephenomenon.
This resultis in agreementwithresults fromother studies,
mentioning a progressive ‘erosion/roughing’ of Pt electrode
submitted to ultrasonification [28], or a progressive ablation
associated with cracks formation in glass surrounding a disk
electrodesubmittedtoultrasound[32].
Inbothmedia,resultsindicatethattheirondepositwasmore
easilyremovedfromtheVC2thanfromtheVC1electrode,after
15s of ultrasonification,100%of theiron deposit is dispersed,
confirmingwhathasbeenobservedpreviouslyonthebasisofSEM
imagesininsetsofFig.8.Incomparison,onVC1,!60%(inFeCl2)
and!90%(inMohr’ssalt)isremovedafter15sofultrasonification
(Fig.8).
TheaboveobserveddifferencesinironadhesiononVC1and
VC2cannotbeexplainedbydifferencesintheworkofadhesion
betweenironandVCsubstrates(WFe/VCinJ/m2).Asalsoindicated
above,anotherdifferencebetweenVC1andVC2electrodesistheir
surfaceroughness’.MicrometricholesonVC1,thatinduceahigher
roughness(Fig.7),actas‘anchors’fortheelectrodepositediron.
Roughness induces higher iron/VC interfacesurface areaSFe=VC
leading to higher adhesion energy, Eadh¼WFe=VCSFe=VC, as said
before. ‘More cavitation bubbles’ (which provide mechanical
energy)arethen requiredtodetach theironparticles fromthe
electrode, which takes more time (using always the same
ultrasound power) and leads to a slower iron removal as
experimentallyobserved.
3.3.2.2.Effectofdifferentpolishinglevelondepositdispersion.
Inordertoconfirmtheeffectoftheelectroderoughnessoniron
depositadhesion,threedifferentpolishingswereappliedtothe
VC2electrodesurface:thesubstratewaspolishedwithpapergrid
P800(electrodeVC2P800),P1200(electrodeVC2P1200)andwith
0.3
m
maluminasuspension(electrodeVC20.3m
m).Aspreviouslystated,theelectrodessurfaceswerecharacterizedusinganoptical
surfaceprofiler(Zygo3D)andresultsareshowninFig.10.Dueto
mechanical polishing stripesare clearly visible forall levels of
polishing.Theonedimensionalprofiles,presentedinFig.10,show
a peak-to-peakamplitudeof approximately2
m
mand 1m
mforVC2P800andVC2P1200respectively.OnVC2,polishedwiththe
0.3
m
maluminasuspension,thesurfaceappearstobesmoother,presenting apeak-to-peakamplitudeofapproximately0.03
m
m.The values of the Wenzel's roughness rw and the arithmetic
roughnessraaregiveninTable2.
Ironelectrodepositsobtainedaftergalvanostaticelectrolysison
VC2,polishedwithP800andP1200paper,arepresentedinFig.11a
(insets). The effect of the ultrasonification duration on iron
dispersionwasexaminedbyplottingoftheratio(Qa/Qaref)asa
functionoftUS(Fig.11a),forthethreedifferentpolishinglevels.As
forVC1(Fig.8aandc,andFig.9),apracticallyexponentialdecrease
was observed, that validates the fact that iron electrodeposit
dispersion by ultrasonification follows a first order kinetics
(Equation 5). The lowest dispersion efficiencies are indeed
obtainedfor electrodesthat present thehighestroughness. For
example, after 5 s of ultrasonic duration, the quantity of iron
depositremainingonthesurfaceforVC2,decreasesfrom!45%to
<5%when polishingwas achievedrespectivelywithpapergrid
P800,P1200and0.3
m
maluminasuspension.Thisconfirmstheeffectoftheroughnessonthedispersionkinetics.
For VC2P800and VC2P1200, thesame quantity of ironwas
depositedduringtheelectrolyses,butasrw(ratiobetweenactual
surfaceand geometricalsurface)ishigherforVC2P800thanfor
VC2P1200 (Table 2), SFe=VC is larger for VC2P800 than for
VC2P1200. This induces a larger Eadh¼WFe=VCSFe=VC for
VC2P800and then a slower dispersionkinetics, asobserved in
Fig.11a.
Depositsobtainedontheseroughsurfacescanbecompared
withdepositsobtainedonasmoothVC2electrode(polishedwith
0.3
m
m alumina suspension, inset of Fig. 8b). On the smoothsurface,ironisdepositedrandomly,formingroundedparticlesand
micrometric plates/flakes (Fig. 8). On the rough surfaces
(VC2P800andVC2P1200),micrometricplatesarealsoobserved,
buttheygrowalongthestripes,followingthetopographyofthe
substrates.Furthermore,SEMpictures,takenwith40$ tilt,show
thatironpreferentiallygrowsatthebottomofthestripes(Fig. 11b).
Thisbehaviourdoesnotcorrelatewiththeclassical
phenome-nology of galvanostatic electrodeposition on rough substrates.
Whenthediffusionlayerthickness(!14
m
mhere)isgreaterthantheheightofthestripes(2
m
mhere,macroprofile),due tolocalvariations of the diffusion layer thickness, metal should be
preferentiallydepositedatthetopofthestripes[41].Wecannot
explainthisobservationatthistime.However,linearvoltammetry
conducted on these three surfaces reveals that the greater
theroughness,thelessertheoverpotentialofinitialFe(II)reduction
(not shown). By analogy with the analysis undertaken in
section3.1.2,thisfactsuggeststhatpolishingstripesofferanarea
Fig.10.SurfaceprofilesofVC2electrodesobtainedbyanopticalsurfaceprofiler(Zygo3D)andtheironedimensionalprofiles(perpendiculartothestripes),a)VC2P800,b) VC2P1200,c)VC20.3mm.
Table2
VC2surfaceroughness’fordifferentlevelsofpolishing:with0.3mmalumina suspension,withpapergridP800andP1200.
Amplitudemax(mm) rw ra(nm)
VC20.3mm 0.03 1.0000 8
VC2P1200 1 1.0156 162
where
g
Fe=VCislowered,facilitatingirondeposition.g
Fe=VCshouldthereforebeloweratthebottomofthestripesthanatthetop,
leading to an improved adhesion of these ‘anchored’ deposits
(WFe/VC=
g
Fe/L+g
VC/L#g
Fe/VC,seetheAppendix).Anotherpoint is thatiron depositedontothestripescanbe
protectedfromthefluidstreamandultrasonicperturbationthat
cancausethedetachmentofthedeposit.Indeed,thesamequantity
of iron is deposited on the rough substrates (VC2P800 and
VC2P1200)asthatonthesmoothone.Butirondepositedinsidethe
stripesof theroughsubstrates hasan iron/liquidinterface less
exposedtocavitationbubbles.
These results clearly confirm the major importance of VC
electrodesurfaceroughnessontheadhesionofirondepositand
demonstratethat dispersion kineticseffectively slows down as
electrodesurfaceroughnessincreases.
4. Conclusion
Theobjectiveofthisworkwastostudyphenomenainvolvedin
thesynthesis of zero-valent iron nanoparticles by
sonoelectro-chemistry.Theroleoftheelectrodesubstrateonthemorphologyof
theelectrodepositediron and its dispersionby ultrasound was
moreparticularlyinvestigated,consideringthefollowingthreekey
parameters: 1) the interfacial energy of the iron/electrode
interface
g
Fe=elect,2)theworkofadhesionoftheelectrodepositedironontheelectrodeand3)theelectrodesurfaceroughness.
ChoosinggoldorVCaselectrodematerials,exhibitingdifferent
interfacialenergies
g
Fe=VC>g
Fe=Au, allowstoobservesignificantdifferencesin both themorphologyof iron electrodeposits and
theirdispersionbyultrasound.Nodispersionwasobservedusing
ultrasound when iron was reduced on the gold; the
electro-deposited iron adheres strongly and it spreads easily along
electrodesurface(2Dgrowthmode)beforetheeventualstarting
ofadendriticgrowth(dependingontheprecursorsaltused).On
VCelectrodes,electrodepositedironcoverspartiallytheelectrode
surface (3D growth mode); its weak adhesion facilitates its
dispersionbyultrasound.
A particular regime was observed, using the smoother VC
electrodeduringcyclicvoltammetryscanunderultrasonification:
electrodepositdispersioniscomplete,allowingcontinuous
regen-eration of the bare substrate; fine iron particles should be
synthetizedduringthisprocess.Theseresultsallowtohighlight
theimportanceoftheelectrodematerialchoicefortheelaboration
of sonoelectrochemical devices dedicated to the synthesis of
metallicnanoparticles.Thelowsurfaceenergyandthelowaffinity
of VC substrates against the deposited metal offer the double
benefit:
-tofavorthelowspreadingofthemetalontheelectrode (3D
growth),promotingtheformationofisolatedfineironparticles
insteadofthinfilms
-tofacilitatethe‘ultrasound-assisted’dispersionofthe electro-deposit.
Theironelectrodepositsdispersionbyultrasoundappearstobe
describedbyafirstorderkineticsbecauseoftheconstantremoval
action of the cavitation bubbles. Moreover, dispersion kinetics
slowdownwhentheelectrodesurfaceroughnessincreases,the
latterinducingenhancedadhesionoftheironelectrodeposits.
Evenifthesynthetizedquantityofdispersedironparticlesis
lowwiththedeviceused(micro-electrolyses),somepreliminary
electrolyses were carried out (without surfactant) by applying
ultrasound(VC2polishedat0.3
m
m,Mohr'ssalt).Thecharacteri-zation by dynamic light scattering revealed the presence of
!200nmsizedparticles.
Acknowledgments
This study was supported by the MSR Graduate Research
FellowshipandtheauthorswouldliketothankthePaulSabatier
Universityforfundingtheresearch.ThanksarealsoduetoSophie
Chambersforcheckingthemanuscript.
Appendix.Estimationofworksofadhesionandinterfacial
tensions
The objective of this Appendix is toestimate the works of
adhesionofiron(Fe)ontheelectrodematerialsusedinthisstudy,
WFe=elect, withelect correspondingeither to Au (gold) or toVC
electrodes.Furthermore,theinterfacialtensionsoftheinterface
betweenironandelectrodematerials,
g
Fe=elect,arealsoestimated. WFe=electandg
Fe=electareestimatedusingthefollowingtheoreticaldevelopment and the values of electrode surface energies
measuredbythecontactanglemeasurementmethod.
Theworkofadhesionofironontheelectrodecanbeestimated
consideringonlythevanderWaalsinteractionsandfollowingthe
theory developed in [43]. Considering the van der Waals
interaction potential profile for iron interacting with electrode
across the liquid phase, work of adhesion corresponds to the
extremumvalue of this profile. It hasbeen shown, for several
Fig.11. Dimensionlessironquantity(Qa=Qaref)remainingontheelectrodeasafunctionoftheultrasonificationduration(tUS)forVC2inFeCl2solutionforvarious polishinglevels.Points correspondtotheaveragevaluesQa=Qaref measuredforatleastthreeexperiments;errorbarscorrespondtostandarddeviations;insets showSEMimages oftheelectrodepositsjustafter theelectrolysis(notexposedtoultrasonification)onVC2 polishedwithP800andP1200 papergrids.b)SEM imagewith 40$ tilt, of the iron electrodeposit onVC2P800; iron deposits located at the stripes bottom are visible inthe red ellipse.