HAL Id: pastel-00982337
https://pastel.archives-ouvertes.fr/pastel-00982337
Submitted on 23 Apr 2014HAL is a multi-disciplinary open access
archive for the deposit and dissemination of sci-entific research documents, whether they are pub-lished or not. The documents may come from teaching and research institutions in France or abroad, or from public or private research centers.
L’archive ouverte pluridisciplinaire HAL, est destinée au dépôt et à la diffusion de documents scientifiques de niveau recherche, publiés ou non, émanant des établissements d’enseignement et de recherche français ou étrangers, des laboratoires publics ou privés.
Sampling and estimation of diamond content in
kimberlite based on microdiamonds
Johannes Ferreira
To cite this version:
Johannes Ferreira. Sampling and estimation of diamond content in kimberlite based on micro-diamonds. Other. Ecole Nationale Supérieure des Mines de Paris, 2013. English. �NNT : 2013ENMP0078�. �pastel-00982337�
N°: 2009 ENAM XXXX
MINES ParisTech Centre de Géosciences
35 rue Saint-Honoré – 77305 Fontainebleau cedex
École doctorale n° 398: Géosciences et Ressources Naturelles
présentée et soutenue publiquement par
Johannes FERREIRA
le 12 décembre 2013Sampling and Estimation of Diamond Content
in Kimberlite based on Microdiamonds
Echantillonnage des gisements kimberlitiques à partir de microdiamants.
Application à l’estimation des ressources récupérables
Doctorat ParisTech
T H È S E
pour obtenir le grade de docteur délivré par
l’École nationale supérieure des mines de Paris
Spécialité “ Géostatistique ”
Directeur de thèse : Christian LANTUÉJOUL
T
H
È
S
E
JuryM. Xavier EMERY, Professeur, Université du Chili, Santiago (Chili) Président
Mme Christina DOHM, Professeur, Université du Witwatersrand, Johannesburg (Afrique du Sud) Rapporteur
M. Jean-Jacques ROYER, Ingénieur, HDR, E.N.S. Géologie de Nancy Rapporteur
M. Wynand KLEINGELD, Consultant Willow View, Wells (Royaume Uni) Examinateur
M. Christian LANTUÉJOUL, Directeur de Recherche, MINES ParisTech, Fontainebleau Examinateur
M. Matthew FIELD, Géologue principal, AMEC, Wells (Royaume Uni) Examinateur
3
Declaration
I declare that this thesis is my own work, except where otherwise acknowledged or referenced in the text. It is being submitted for the Degree of Doctor of Philosophy at the Ecole des Mines des Paris. It has not been submitted before for any other degree or examination at any other university.
__________ J.J. Ferreira August 2013
5 Dedicated to my family
7
Acknowledgements
During the years with De Beers and Anglo American, I could not have had more opportunities to grow into and experience the science and art of mineral resource evaluation, than under the leadership of Dr. Wynand Kleingeld.
I received invaluable exposure to size distributions and other aspects of diamonds under the management of Tinus Oosterveld. He shared with me all he knew about diamonds including the ‘secrets’ of microdiamonds. This thesis is an acknowledgement of the many years of his dedication in this field.
I acknowledge:
Christian Lantuéjoul for his support with the theoretical aspects of this methodology and helping me to finally write down this research;
Chris Prins for his assistance with the documentation and for the computer system he assembled from SAS and Excel sources developed during our years at De Beers;
Anglo American and the De Beers for opportunities created for me while employed;
Niall Young, Malcolm Thurston and Matthew Field for support when this topic was still controversial; Special thanks to the friends at the Ecole des Mines in Fontainebleau.
9
Contents
Declaration ... 3 Acknowledgements ... 7 Contents ... 9 Préambule ... 13 Preamble ... 15 Glossary ... 17 Introduction française ... 21 1 Introduction ... 27 1.1 Background ... 27 1.2 This research ... 29 1.3 Diamond Size ... 31 1.4 Diamond concentration ... 32 1.5 Diamond Content ... 33 1.6 Sampling... 34 1.7 Application ... 35 1.8 Further research ... 35 PART I METHODOLOGY ... 37 2 Diamonds in Kimberlite ... 39 2.1 Kimberlite Deposits ... 41 2.2 Diamonds in Situ ... 43 2.3 Microdiamonds ... 44 2.3.1 Definition ... 44 2.3.2 The Beginning ... 4510
2.3.3 Application ... 46
2.3.4 Benefits ... 47
2.4 Sample stones and sample carats ... 48
2.5 Diamond size (frequency and log probability) ... 49
2.6 Diamond liberation (maximum lockup) ... 55
2.7 Diamond Value ... 58 2.8 Kimberlite Evaluation ... 59 2.8.1 Evaluation Purpose ... 60 2.8.2 Evaluation Sequence ... 60 2.9 Kimberlite sampling ... 61 2.9.1 Sampling phases ... 62 2.9.2 Microdiamond sampling ... 63 2.9.3 Sampling Methods ... 71
3 Modelling kimberlite diamond content ... 73
3.1 Diamond occurrence ... 75
3.1.1 Spatial aspects ... 75
3.1.2 Poisson Process ... 75
3.1.3 Cox Process ... 76
3.1.4 Towards diamond content ... 78
3.2 Graphic modelling of diamond content ... 79
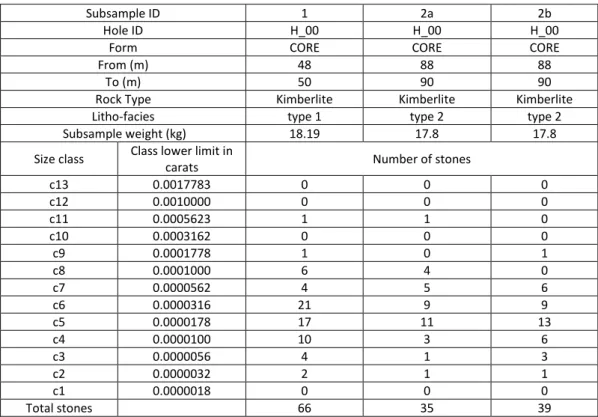
3.2.1 Organisation of sampling data... 79
3.2.2 Lognormality of diamond size ... 80
3.2.3 Presentation of diamond size ... 84
3.2.4 Lognormal Parameter estimation ... 90
3.2.5 Diamond Concentration ... 94
3.2.6 Incorporation of diamond concentration ... 95
3.2.7 Model confirmation ... 97
3.2.8 Confidence limits ... 100
3.2.9 Comments... 103
3.2.10 Alternative modelling procedure ... 105
3.2.11 Extreme Value Statistics ... 105
PART II CASE STUDIES ... 107
4 Case Studies I ... 109
11
4.1.1 Project background ... 111
4.1.2 Phase I Sampling and Estimation ... 111
4.1.3 Phase II Sampling and Estimation ... 118
4.1.4 Sampling assessment ... 122
4.1.5 Conclusions ... 129
4.2 Case Study 2 ... 130
4.2.1 Project background ... 130
4.2.2 Phase I Sampling and Estimation ... 130
4.2.3 Phase II ... 138
5 Case Studies II ... 145
5.1 Case Study 3 ... 147
5.1.1 Project background ... 147
5.1.2 Sampling ... 147
5.1.3 Diamond content estimation ... 149
5.1.4 Conclusion ... 156
5.2 Case Study 4 ... 158
5.2.1 Project background ... 158
5.2.2 Sampling and estimation of diamond content ... 158
5.2.3 Sampling assessment ... 166
6 Case Studies III ... 169
6.1 Case Study 5 ... 171
6.1.1 Project background ... 171
6.1.2 Sampling ... 171
6.1.3 Sampling Data ... 171
6.1.4 Zonal Diamond Content ... 173
6.1.5 Average recoverable diamond grade and value ... 185
6.1.6 Local diamond content estimation ... 190
6.2 Reliability ... 191
6.3 Conclusion ... 191
Conclusion et perspectives ... 193
7 Conclusion and Perspectives ... 197
13
Préambule
L'objet de ce travail est l'estimation des diamants de gisements kimberlitiques à partir d'information fournie par des microéchantillons.
Cette estimation repose traditionnellement sur les pierres commercialisables de plus de 0.5mm, sans tenir compte des petites pierres qui sont de loin les plus abondantes et qui finissent au rebut stérile. Le problème est la taille des échantillons. Ils doivent être assez grands pour contenir un nombre suffisant de telles pierres en vue de l'estimation.
Pour réduire la taille des échantillons, l'idée est d'abaisser le seuil de récupération des pierres. A cette fin, des techniques spécifiques ont été mises au point (dissolution de la kimberlite à l'acide), permettant de récupérer toutes les pierres de plus de 75 microns (0.0000018carat).
A partir de ces nouvelles données, des procédures d'estimation ont été élaborées au fil des ans pour déboucher sur un protocole mature.
Du point de vue traitement des données, le point le plus délicat est l'estimation de la loi des pierres commercialisables à partir de pierres essentiellement petites. La solution proposée repose sur une hypothèse de lognormalité de la taille des pierres, hypothèse pertinente dans la totalité des gisements primaires de diamants étudiés.
L'estimation des paramètres doit tenir compte du nombre limité des données et de leur biais, dû à la perte inévitable des pierres les plus petites au cours du traitement des échantillons. Elle se fait selon une procédure itérative, une phase de simulation d'une population de pierres selon la valeur courante des paramètres alternant avec une phase d'ajustement des paramètres destinée à mieux restituer la loi des données tronquées observées. Elle permet la prise en compte simultanée de plusieurs jeux de données récupérées à différents niveaux de troncature correspondant à différents modes d'échantillonnage. Cette procédure met en jeu une représentation graphique comparée des lois expérimentale et simulée, mettant ainsi en évidence la quantité de pierres perdues.
15
Preamble
This research deals with diamond content estimation in kimberlite based on information obtained from microdiamond sampling.
In spite of the abundance of diamonds smaller than 0.5mm square mesh the conventional approach of estimating diamond content is based on information derived from stones in the +0.5mm size fraction. While large samples are required to ensure recovery of sufficient numbers of diamonds for evaluation the largest number is therefore discarded as treatment tailings.
As far back as the 1960’s this inspired the approach to lower the bottom screen aperture in order to recover microdiamonds, and was accompanied by the introduction of recovery methodology based on acid dissolution.
As a consequence the required sample size is smaller, bringing along many practical advantages. The research deals with estimation of the weight of diamonds (diamond content) in kimberlite, based on information obtained from microdiamond sampling to a bottom screen diameter as low as 0.075 mm square mesh (~0.0000018 carats).
Determination of the diamond size distribution has always been a challenge when estimating deposit diamond content. The method proposed in the research is based on the assumption of lognormality, which is in line with experience at all primary deposits.
Over the years special techniques of estimating deposit diamond content have been developed and in this research have ‘matured’ into a proper sampling and estimation approach, taking cognisance of the fact that sampling is partially ‘flawed’ due to inevitable losses of diamonds during sample treatment. Some smaller diamonds are lost when they pass through the bottom cut-off screen used during diamond recovery, when according to their weight they should actually be recovered. Other losses of small diamonds occur when they remain locked in host rock particles and are discarded along with non-diamond bearing material.
Modelling of diamond content is performed by means of an iterative process of simulating diamonds as distributed in their in situ state, followed by emulating recovery effects to reproduce a representative sample.
16 Inclusion of multiple sets of data collected at different truncation levels by means of different sampling methods is allowed and the procedure uses graphic representations of diamond size and concentration to compare simulated and sampled diamonds. During the process simulation parameters are adjusted until the exact sampling results are reproduced, at the same time exposing what is being lost during recovery.
It is common in the Industry to fit a size distribution model to the actual recovered size distribution, regardless of the size of the sample considered and often unaware of the effects of applying a bottom cut-off in diamond recovery. In this research modelling is focused on obtaining a statistical model for the in situ size distribution, unaffected by processing, making it possible to determine recoverable diamond content at any given truncation level.
17
Glossary
1. ALIGNMENT FACTOR
This is the ratio of recovered carats to in situ carats in a size class. Application of alignment factors to in situ resource carats (stones) provides estimated recoverable resource carats (stones) per size class.
2. BOTTOM CUT-OFF
Setting a bottom screen size or bottom cut-off size, gets rid of small, uneconomic diamonds during the recovery process. However, due to their different shapes some smaller diamonds may still be recovered, while others that should be recovered are screened away. As a consequence diamond frequencies in the bottom size classes are affected and do not reflect in situ diamond occurrence accurately.
3. BOTTOM TRUNCATION
Size classes affected by the bottom cut-off procedure are eliminated from certain modelling procedures by truncation. Bottom truncation always takes place at or above bottom cut-off.
4. CLASS BREAKDOWN
When a parcel of diamonds is sieved the combination of class carats (or stones) for all the sieve classes is referred to as the parcel “breakdown”.
5. CRITICAL DIAMOND WEIGHT or SIZE
Diamonds are sized by sieve aperture with weight and stone shape determining the destiny of a diamond in the sieving system. Critical diamond weight is the class weight limit between two consecutive size classes. It is defined as the weight of diamond that will pass through the sieve or stay on top with equal probability. Alternatively, it is the weight of diamond that has 50% chance of staying on top of the screen. Since it depends on size as well as shape it is recommended that a set of critical diamond weights be determined for each new diamond assortment.
6. DIAMOND ASSORTMENT
This is the specific combination of colour, shape, intensity and size of diamonds from a deposit or from a domain within a deposit.
7. DIAMOND CONCENTRATION
The number of stones per unit weight of ore. In the case of microdiamond sampling, concentration is expressed as stones per 20kg or stones per kg. Generally it may also be expressed as stones per
18 tonne when appropriate, but always with the bottom screen size to be used for diamond recovery specified.
8. DIAMOND CONTENT
The total weight of diamonds contained in a domain, which could be a sample or the entire deposit, expressed in carats (5 carats = 1gram) above the bottom screen cut-off size in use for diamond recovery.
9. DIAMOND GRADE
The weight of diamonds per unit weight of ore, typically expressed as carats per tonne (cpt) or carats per 100 tonnes (cpht, 1 tonne = 1000kg). During sampling and evaluation diamond grade may also be expressed per unit volume as carats per cubic meter (cts/m3), always specified with the bottom screen size aperture to be used for diamond recovery.
10. DIAMOND LIBERATION
Diamonds are naturally contained in hard kimberlite rock. Diamond liberation is achieved by means of a treatment process that involves crushing the host rock to specific aperture sizes and separating diamonds and denser rock particles as concentrate. Less dense material that most likely does not contain diamonds is discarded as tailings. Large tailings particles may still contain small diamonds and are crushed in a secondary process to smaller aperture sizes for diamond recovery. If cost effective, the process may be repeated at yet smaller crusher aperture size.
11. DIAMOND LOCKUP
Diamond lockup occurs when diamonds are not liberated during the treatment process. When a particle contains a diamond so small that diamond-to-particle weight contribution is too small to be separated as concentrate, the diamond remains locked in the particle.
12. DIAMOND PARCEL
A collection of diamonds grouped together form a diamond parcel and may be diamonds that fully or partially represent recovery from production or sampling.
13. DIAMOND SIEVING
The large number of stones recovered during an ordinary production period prohibits reporting of results in the form of a listing of individual diamonds. Stones are sieved into standard size sieve classes and weighed and valued by size class. The sieve size class system of the De Beers Trading Company and the Antwerp sieve size classes are most frequently used.
14. DOMAIN /LITHO-FACIES
A kimberlite deposit may be composed of material deposited by more than one volcanic event forming multiple families of kimberlite in the deposit. Kimberlite within a deposit may display different geological characteristics containing different diamond assortments, described as different kimberlite facies. The research is based on the premise that a deposit is composed of different domains, each having unique lithology and diamond content characteristics. Diamond content and value are consistently assessed by domain, whether it is a facies or a subdivision of a litho-facies.
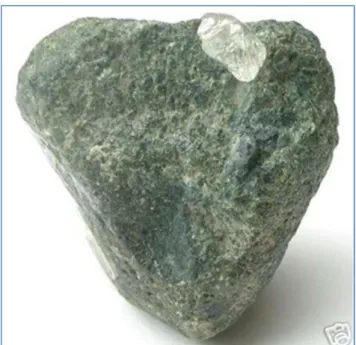
15. KIMBERLITE
A 'hybrid' rock composed of fragments of Peridotite and Eclogite transported from beneath the deep crust in the upper mantle of the earth. It is a volcanic rock that is best known for its diamond potential. Its naming is related to the town of Kimberley in South Africa, where the ‘Hope’ diamond (83.5-carat) was discovered in 1871.
19 16. KIMBERLITE PIPE
This is a vertical structure in the earth’s crust and the most important source of primary diamonds. The consensus on kimberlites is that they are formed deep within the mantle at depths between 150 and 450 km and they erupt rapidly and violently. [8]
17. LOG-CONCENTRATION LOG-SIZE CURVE (LC-curve)
Diamond concentration plotted against diamond size on log scales, with concentration expressed as stones per weight unit per unit class interval and with size represented by the average stone size per size class. The curve is used as modelling tool to obtain total or in situ diamond content.
18. LOG-PROBABILITY CURVE (LP-curve)
The percentage cumulative more than frequency distribution in the size frequency table, expressed as probability. The Gaussian inverse of this probability is plotted against the log of the lower diamond size class limit. [( 1 − ln x ]. If the size distribution is lognormal the LP-curve is linear.
19. MACRODIAMOND
A stone that does not pass through a 0.5mm square mesh screen is defined as a macrodiamond. It can be present in microdiamond sample recovery and its occurrence in microdiamond sampling results is for obvious reasons specially mentioned when microdiamond sampling results are quoted. 20. MICRODIAMOND
A microdiamond is defined as a diamond passing through 0.5mm square mesh. [7] The definition is based on size and not weight and was initially defined as diamonds that would pass through the lowest commercial screen size at 1mm. Microdiamonds were also known as ‘fine’ diamonds, but this terminology was abandoned to eliminate confusion, as commercial diamond size fractions are also referred to as ‘fines’, ‘middles’ and ‘coarse’.
21. MODIFYING FACTOR
Factors applied to convert resources to reserves. Factorisation that may be required in order to account for process inefficiencies during production treatment, which may differ from sample treatment processes that were used to create the resource.
22. ORE DRESSING
The first stages of treatment process for the extraction of mineral (diamond) from its host rock. 23. PRIMARY DIAMOND DEPOSIT
A kimberlite pipe is a primary diamond deposit, as it contains diamonds in the host rock of their primary origin. If kimberlite erodes and deposits its diamonds in gravel beds in rivers or in the ocean, then a SECONDARY DIAMOND deposit is formed.
24. RECOVERABLE DIAMOND GRADE/CONTENT
Diamond grade or diamond content modified to exclude diamonds that will not be recovered due to diamond lockup and screening losses in the bottom size classes, with bottom screen size to be used for diamond recovery specified.
25. SIZE FREQUENCY DISTRIBUTION (SFD)
The statistical distribution of diamonds into size classes is presented in tabular form as a size frequency distribution.
26. TYPICAL DIAMOND PARCEL
Any collection of diamonds grouped together form a diamond parcel. In the context of this thesis a typical parcel represents exactly what may be expected to be in a large production- or sampling parcel from a source, in terms of diamond size distribution and diamond concentration.
21
Introduction française
Ce travail est essentiellement consacré à l'estimation de gisements primaires de diamants, tels que des gisements kimberlitiques. Dans ces gisements, on y distingue deux types de pierre: les macrodiamants et les microdiamants. Les macrodiamants sont les pierres de valeur économique. Ils sont rares et un effort d'échantillonnage substantiel est nécessaire pour en estimer la concentration et la granulométrie. A l'inverse, les microdiamants sont des pierres sans valeur économique mais bien plus abondantes et récupérables au prix d'un effort d'échantillonnage limité. D'où la question: peut on estimer la granulométrie (loi du poids des pierres individuelles), la concentration (nombre de pierres dans un domaine donné) et la teneur (poids cumulé des pierres dans un domaine donné) des macrodiamants en s'appuyant sur l'information apportée par des microéchantillons?
Quelques jalons historiques
Cette question n'est pas récente. Elle fut initialement posée en 1965 par le Dr. L. Murray (Anglo-American). La réponse plutôt négative n'empêcha pas la création, à Kimberley entre 1971 et 1988, d'une base de données de microdiamants, à l'aide de laquelle il apparut que la teneur en macrodiamants était d'autant mieux estimée que la concentration en microdiamant était forte. En 1973 mention fut faite de la lognormalité de la loi du poids des microdiamants, et de la possibilité d'une relation simple liant la concentration des microdiamants et la teneur des macrodiamants. L'auteur fut confronté à cette question dès son arrivée à la de Beers en 1981 pour des travaux d'exploration. Le sujet était à l'époque tout à fait confidentiel, même si les travaux de Boxer et Deaken sur les données du gisement d'Argyle en Australie ne tardèrent pas à passer dans le domaine public [2].
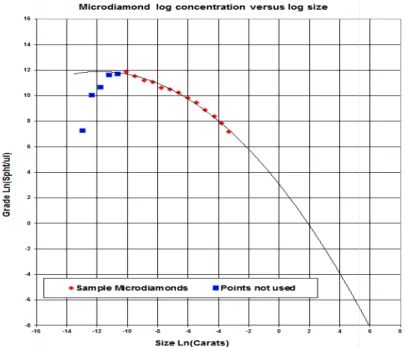
De son coté, L. Rombouts développa une méthodologie pour prédire le poids des grandes pierres à l'aide de la courbe de Lorenz du poids des microdiamants [51]. Il poursuivit ce travail avec plusieurs collaborateurs pour évaluer des lots de pierres en utilisant la théorie des valeurs extrêmes [6,4]. La recherche au sein de la de Beers manifesta une préférence marquée pour la courbe la concentration en diamants en fonction du poids des pierres. Le comportement lognormal du poids des pierres implique que la log-concentration est une fonction quadratique du log-poids des pierres (cf. Figure 1-1). Cette courbe, dite LC, est avantageuse dans la mesure où elle permet de combiner les données de différentes campagnes d'échantillonnage. C'est pour cette raison qu'elle est préférée à une courbe de Lorenz. Son estimation graphique était simple, et ses résultats furent jugés
22 suffisamment convaincants pour justifier la création d'un laboratoire de traitement des microéchantillons (Kimberlite Acid Laboratory).
Les microéchantillons s'avérant de plus en plus utile à l'estimation des macrodiamants, la base de données ne cessa de s'enrichir, et en 1997 toutes les mines sud-africaines ainsi que la majorité des mines du reste du monde y étaient représentées lorsque M.M. Oosterveld atteint l'âge de la retraite. En 2003, une équipe de recherche fut créée par la de Beers pour accélérer la mise en œuvre d'un certain nombre de méthodologies. Un groupe y fut spécialement constitué pour améliorer les techniques d'échantillonnage et d'estimation des gisements de kimberlite, tout particulièrement à l'aide de microdiamants. C'est dans ce cadre que l'efficacité des microéchantillons fut finalement démontrée dans toute sa généralité, de la phase d'exploration à l'étude de faisabilité.
Travaux de recherche
Pendant longtemps il a été cru que microdiamants et macrodiamants constituaient deux populations de pierres bien différentes, issues toutes deux du manteau. Cette croyance a longtemps persisté avant de se dissiper peu à peu grâce à une utilisation soutenu du microéchantillonnage et de l'efficacité dont il a fait preuve. Par exemple, la différence entre des valeurs estimées à partir de microéchantillons et macroéchantillons a mis en évidence que la kimberlite d'un gisement canadien était fortement diluée, ce qui avait été passé sous silence pendant l'échantillonnage.
Les pionniers de cette approche, L. Rombouts, M.M. Oosterveld, A. Davey, G.L. Boxer, A.S. Deakin, L. Kleinjan et O. Garvey, ont souvent été amenés à faire face à l'opinion de nombreux experts.
A titre personnel, c'est l'étude du gisement Victor au Canada qui me convainquit de l'intérêt du microéchantillonnage. Sur la base dune information géochimique prometteuse, il avait été décidé de forer des macroéchantillons de 6 pouces de diamètre, produisant 96 macrodiamants totalisant 6.99 carats . De leur coté, des microéchantillons analysés n'avaient produit que 113 microdiamants et suggéraient un gisement de peu d'intérêt. Par contre, la combinaison des pierres produisit une courbe LC tout à fait inhabituelle, avec une teneur estimée de 30 carats par tonne et un prix au carat supérieur à 200 $. Des examens plus poussés ont corroborés cette estimation [43].
En raison du rôle intensifié du microéchantillonnage pour l'estimation des teneurs, l'établissement d'un protocole d'échantillonnage devint nécessaire. Ce fut chose faite par M. Field en 2004, mettant en avant un certain nombre de variables clé telles que la dilution de la kimberlite [24]. Ce protocole fit l'objet d'une révision en 2006 suite à la découverte du gisement de Gacho Kue au Canada et à la mise en place de programmes d'extension des ressources des principales mines d'Afrique du Sud. En 2011, C. Lantuéjoul développa une procédure théorique d'estimation des teneurs à partir de microdiamants en partant d'un modèle (le processus de Cox), et de données tronquées [37]. La possibilité de recourir aux microdiamants présente de nombreux avantages. En voici quelques uns:
• l'abondance de petites pierres favorise l'utilisation de petits échantillons;
• les petits échantillons se manipulent bien. ILs est facile de les transporter et de les sauvegarder;
• les microéchantillons sont positionnés par inspection visuelle de sondages;
• les sondages sont coûtent moins cher que des forages de grand diamètre. En les orientant, on parvient à échantillonner des parties du gisement que ne pourraient l'être autrement;
23 • des économies substantielles sont réalisées en échantillonnant par petits sondages plutôt que par grands forages, même si la récupération des microéchantillons par digestion acide ou fusion caustique est une opération onéreuse;
• les microdiamants n'ont aucune valeur économique et n'ont pas besoin d'être sécurisés; • étant de petite taille, ils peuvent être entreposés et gardés éternellement;
• le microéchantillonnage peut fournir une courbe granulométrique avant même que le premier macroéchantillon ait été foré. Par utilisation de cette courbe et d'un nombre limité de macrodiamants, on peut très vite se faire une bonne idée de la valeur moyenne des pierres.
Granulométrie des pierres
La Figure 1.2 montre la courbes granulométriques de 12 microéchantillons prélevés dans une partie géologiquement homogène d'un gisement canadien. La proximité de ces courbes atteste de la continuité de la minéralisation.
A proximité de la flèche rouge qui indique la limite supérieure du poids des microdiamants, aucune discontinuité ne se manifeste sur les 12 courbes de cette figure. C'est sur cette observation typique que repose la procédure d'estimation des teneurs des macrodiamants.
Mis ensemble, les 12 microéchantillons fournissent une courbe granulométrique plus régulière et de support d'autant plus large qu'il repose sur un plus grand nombre de pierres.
Cette courbe granulométrique se modélise par une loi lognormale [52], ce qui est une pratique courante dans les procédures d'audit des revenus commerciaux dans l'industrie du diamant. La loi lognormale joue un rôle important dans ce travail. Elle modélise le poids des pierres même en deçà des seuils de troncature.
Concentration en diamant
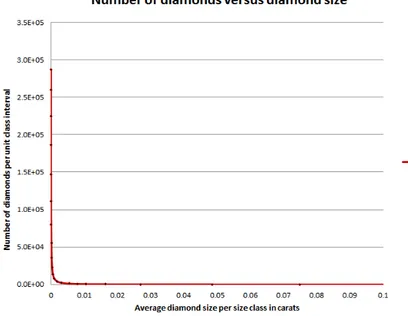
Les diamants sont des particules discrètes et leur poids est important car ce sont les plus grosses pierres qui ont le plus de chance de présenter de la valeur.
La courbe de concentration donne la répartition des pierres en fonction de leur poids. Elle est représentée sous forme bilogarithmique, le premier axe étant découpé en classes granulométriques et le second axe étant exprimé en nombre de pierres par tonne ou par centaine de tonnes.
La Figure 1.3 montre une courbe de concentration obtenue à partir d'un microéchantillonnage. Alors que les données ne sont disponibles que sur 5 classes granulométriques, sa modélisation par un polynôme du second degré couvre toutes les classes. Elle est utilisée pour en déduire la teneur en diamant au dessus de n'importe quelle taille critique.
Teneur en diamant
La granulométrie et la concentration des pierres jouent un rôle essentiel pour l'établissement de leur teneur.
Chaque gisement de diamants a une géologie et un assortiment de pierres qui lui est propre, et tout l'art d'estimer la teneur en diamant consiste trouver des modèles statistiques appropriés pour leur granulométrie et leur concentration et à les combiner.
Jusqu'à la fin des années 90, les estimateurs de la teneur en diamant reposaient exclusivement sur la courbe de concentration, sans modélisation préalable de la granulométrie des pierres. Cette
24 procédure était assez subjective et les estimateurs obtenus variaient d'un opérateur à l'autre, voire d'un essai à l'autre du même opérateur.
L'un des objectifs de ce travail est de robustifier le microéchantillonnage et l'estimation des teneurs en diamant. Cette procédure commence par modéliser la granulométrie des pierres puis leur concentration. On obtient alors une courbe de teneur par combinaison des deux courbes précédentes.
La modélisation de la granulométrie se fait à partir des données de microéchantillons. Par ce mode d'échantillonnage, seules les pierres de taille supérieure à 0.075 mm sont récupérées (à titre de comparaison, les pierres de plus de 0.5 mm sont récupérées par macroéchantillonnage et à l'exploitation).
La modélisation de la concentration se fait à partir des données de concentration de sous-échantillons. S'ils sont suffisamment nombreux, une loi statistique peut être ajustée.
Sous l'hypothèse de loi de type continu, une procédure a été développée pour générer des lots de pierres de granulométrie et de concentration données. Les modèles obtenus sont utilisés pour générer un échantillon de grande taille, typiquement 1 000 000 de sous-échantillons de microdiamants. Si les modèles sont réalistes, la teneur de l'énorme population simulée devrait être conformité à celle des données d'échantillonnage.
Au départ de la campagne d'échantillonnage, les données disponibles se limitent presque toujours à des microéchantillons.
S'il le gisement s'avère prometteur, des macroéchantillons sont alors prélevés pour confirmer le modèle fourni par les microdiamants et pour attribuer une valeur aux pierres.
Dans une phase encore plus avancée, la teneur en diamant est estimée localement à l'intérieur de différents domaines du gisement pour entreprendre la planification minière.
Échantillonnage
Les dimensions des gisements de diamants et la succession des tâches implique que l'échantillonnage doive être envisagé en plusieurs phases. Au départ, la question est de savoir si la kimberlite contient du diamant. Si oui, quelle en est la teneur globale. Ensuite, un modèle géologique du gisement aide à comprendre comment sont se répartissent les teneurs localement.
Si les teneurs estimées suggèrent que le gisement est économiquement viable, la variable d'intérêt devient la valeur des pierres. L'échantillonnage vise alors à récupérer des pierres d'intérêt commercial. Si la viabilité économique subsiste, l'échantillonnage s'intensifie pour fournir de l'information en vue d'études de faisabilité.
Le microéchantillonnage pour l'estimation des teneurs s'effectue par sondage carotté. Il est également utilisé pour estimer la géologie et la géométrie du gisement. Les sondages sont déposés dans des boites et des sous-échantillons sont sélectionnés visuellement selon un protocole bien établi pour s'assurer de la correction de l'échantillonnage effectué.
Le poids des sous-échantillons varie entre 8 et 20 kg, selon les circonstances. Par exemple, un dyke très fin ne peut pas toujours fournir le poids souhaité.
Au départ, l'échantillonnage commence avec peu, sinon aucune connaissance du gisement, et son objectif est de voir si la kimberlite contient du diamant ou non. Si oui, les résultats de la campagne initiale peut être utilisée pour mettre au point un protocole en vue d'un échantillonnage supplémentaire.
25 La reconnaissance du gisement est la première phase de l'échantillonnage. Elle a pout but de déterminer les limites du gisement et de fournir une première description de sa géologie interne, typiquement l'épaisseur de la découverture et une idée de sa complexité. Cette phase porte aussi sur la présence de gisements voisins qui pourraient s'avérer importants lors de l'exploitation.
Cette phase de reconnaissance est suivie d'une phase d'exploration qui vise à estimer les teneurs des diamants par domaine et à en déterminer la valeur économique. Le modèle géologique est aussi révisé et amélioré à l'aide des nouveaux sondages. Il se peut qu'un site doive être directement abandonné en phase de reconnaissance, mais il est aussi possible qu'un projet jugé potentiellement marginal lors de cette première phase reçoive un complément d'échantillonnage en phase d'exploration. A noter que cette phase d'opération survient également quand il s'agit de prolonger une mine dans une zone plus profonde non encore reconnue.
Les échantillonnages lors des phases de reconnaissance et d'exploration fournissent l'information nécessaire pour déterminer les chances qu'a l'extraction d'être économiquement viable, ou bien pour effectuer une étude préliminaire de faisabilité économique. De telles études se poursuivent au moyen des programmes d'échantillonnage avancé plus détaillés.
Application
L'échantillonnage par microdiamant est couramment utilisé en phase de reconnaissance et d'exploration de toute nouvelle source de diamants. L'auteur de ces lignes a eu l'occasion d'utiliser et de tester cette méthodologie dans 22 gisements dont la liste figure dans la partie anglaise de cette introduction.
Recherche à poursuivre
Plusieurs aspects de cette méthodologie nécessitent un certain nombre de prolongements: • considération d'autres lois que lognormale pour modéliser le poids des pierres; • quantification de la précision des estimateurs;
• application du microéchantillonnage au contrôle des réserves; • positionnement du microéchantillonnage dans la théorie de P. Gy; • conséquences du regroupement des pierres en classes de tamisage; • tomographie rayon X des pierres à l'intérieur de la kimberlite; • estimation et simulation de gisements à partir de microdiamants;
• développement de stratégies d'échantillonnage pour estimer la fraction +0.3mm des microdiamants dans des kimberlites de faible concentration et des pierres de granulométrie "grossière".
27
1 Introduction
1.1 Background
Diamonds are considered to be a rare mineral and the particulate nature of diamonds puts the evaluation of diamond deposits in a unique category of mineral resource evaluation.
The unique size distribution with a much more abundant presence of small stones in kimberlite material opens the door to smaller samples and a slightly less hostile environment for diamond content estimation. The research is focused on diamond content estimation based on microdiamond sampling from primary kimberlite deposits. (Secondary deposits have been addressed by Prins. [48] ) Recovery of microdiamonds was instigated by Dr L Murray and commenced in 1965 at the Anglo American Research Laboratories in Johannesburg (AARL). Treatment of 20kg samples started in 1969 and was carried out on a regular basis from 1971. Attempts to predict macro grade on the basis of microdiamonds did not produce good results initially and the application was regarded suitable only to distinguish between diamondiferous and non-diamondiferous material
Between 1971 and 1988 an extensive data base was created by AARL. At the Kimberley Acid Lab (KAL) a large amount of sampling material had been treated and the results were added to the AARL data base. At this time it was argued that macro grade prediction could be improved when microdiamond occurrence is classified into high or low microdiamond producers.1
In 1973 it was reported that the ‘weight-frequency’ distribution of ‘fine diamonds’ (microdiamonds) in kimberlite usually follows a lognormal distribution, but that the process of de-sliming kimberlite residues through 200 mesh (0.212mm) had the unfortunate effect of changing the shape of the distribution in the finer size classes. Already at that stage the weight-frequency distribution of diamonds was plotted on logarithmic probability paper.
It was reported that the distribution is lognormal, with strong indications that a simple relationship could exist between the concentration of fine diamonds and the overall grade of the kimberlite - ‘provided the diamonds are of a size grade enabling true representativity’. It was argued that such a
1
28 relationship would be ‘grossly affected by contamination of kimberlite by foreign matter’2. The use of the log-concentration versus log-size representation (or LC-curve) for diamond samples was already established.
During those years the recovery process was continuously being improved. A report was produced stating that it was proved that a direct relationship exists between the concentration of fine diamonds and the diamonds recovered by mining, being a ‘valuable practical method for the determination of the presence of diamond and the payability of any kimberlite mass by simple and inexpensive means’3.
The author‘s first encounter with the application of microdiamonds was in 1981, when he joined De Beers Consolidated Mines in Kimberley, South Africa. It was a highly sensitive subject and everything relating to the topic was confidential. Work carried out at the time was mostly aimed at assessing diamond potential in new discoveries.
Material was being collected from operating mines with the obvious view of testing the theory with kimberlite for which macrodiamonds were readily available and with known diamond content. In the public domain microdiamond work was reported to have been carried out on material from the Argyle Deposit in Australia [2]. Boxer and Deaken recognised a discrepancy zone in depicting log-stone frequency versus log log-stone size in the size range between 0.01 and 0.1 carat, showing linear and quadratic relationships for micro- and macrodiamonds.
The use of a second degree polynomial to approximate total diamond content was based on the lognormal nature of statistical distribution of diamond weights [54]. This characteristic of diamond weights in a representative diamond parcel has generally been observed and is used at operating mines to audit the treatment and recovery of diamonds.
Rombouts made use of a plot of cumulative grade versus microdiamond size to obtain an extreme value graph [51]. In collaboration with others he continued to apply Extreme Value Theory to diamond size and value analysis [6] and [4]. They focused on actual diamond parcels not on the in situ content as done in this thesis.
Caers published his PhD thesis in 1996 on the statistical and geostatistical valuation of diamond deposits, providing extensive coverage of new methods for valuation of primary and secondary diamond sources [5] . His work focuses mainly on macrodiamonds. He mentions that the topic of estimating macrodiamond content from microdiamonds was addressed while working on the thesis, but does not present any results.
Research at De Beers indicated preference for the representation of diamond concentration versus diamond size. Estimation was based on graphic representations of what was called the ‘diamond content curve’ and results were promising enough to justify the construction of the Kimberley Acid Laboratory.
The lognormal nature of the distribution of diamond weights implies that the Log-Concentration curve (LC-curve) is a second degree polynomial. An advantage of the LC-curve representation is that it allows micro- and macrodiamonds from different sampling campaigns to be combined for diamond content modelling and is therefore preferred above cumulative plots and Extreme Value Theory.
2
Glatthaar GW. Weight-frequency distribution of microscopic diamonds in kimberlite, July 1973 (AARL Report).
3
Garvey O and Glatthaar GW. Development of the treatment process and examination of kimberlite for the presence of microscopic diamonds, circa 1980 (AARL Report).
29 Figure 1-1 depicts plots for cumulative mean grade (left) and the LC-curve (right) based on individual stone weights and sieved diamond frequencies respectively.
Figure 1-1: Two methods of representing diamond content. The lognormal approach is preferred as the 2nd degree polynomial is easily modelled and allows diamond content modelling based on small samples. The curve on the right depicts log concentration versus log size (LC-curve) and may also be referred to as the ‘diamond content’ curve. The curve on the left represents cumulative mean grade with diamond size and is not used in this thesis.
A microdiamond data base was steadily growing as it was clear that there was potential to use microdiamond sampling to estimate macrodiamond potential. Sampling results from all the Southern African mines and many deposits worldwide were considered (such as [46]) for microdiamond modelling purposes by 4M.M. Oosterveld until and after his retirement in 1997.
In 2003 a research team was created by De Beers specifically with the aim of delivering techniques to shorten the time between discovery and mining or walking away from a deposit. One section of the research was concerned with sampling and estimation of diamond content in kimberlite deposits with special focus on microdiamonds.
The work has since culminated in a methodology that allows microdiamonds to be used as a valuable tool in sampling for diamond content estimation, from early reconnaissance to advanced feasibility stages of diamond resource evaluation.
1.2 This research
Microdiamonds are believed to come from a different diamond population in the mantle and for a long time it was believed that it would not be possible to extend diamond content properties based on diamonds from the microdiamond size range to diamond content in the macro size range.
This argument has been persistently posed even in the face of microdiamonds merely being defined on the basis of their size. However, continued application of the methodology and the obvious rewards by doing so has led to wide acceptance of the idea of microdiamond sampling for diamond content.
4
Oosterveld, M.M. played a major role in establishing and developing the application of microdiamond sampling in estimating diamond content in primary diamond deposits. The highly confidential nature of the work restricted the exposure he deserved in this field and this text as a whole must be seen as a credit to his work.
30 Luc Rombouts, Tinus Oosterveld, Andy Davey, Boxer, Deakin, Len Kleinjan and Owen Garvey are names in the industry who have been using microdiamonds to predict macrodiamond grade, in spite of what many experts have been saying. Much of the work was highly confidential5.
Estimation was based on a graphic presentation of what was known as the diamond content curve, but denoted the LC-curve in this thesis. Diamond content was estimated by comparing LC-curves for new discoveries with those constructed for known producers6.
The Anglo American Research Laboratory and the Kimberley Acid Laboratories were two facilities used by De Beers to recover diamonds by means of acid digestion.
Material was selected for microdiamond recovery in order to enable diamond content modelling. Deposit material most likely to contain diamonds was selected for treatment to maximise stone recovery, therefore much of the oldest sampling databases contain sufficient information for diamond size analysis, but could be misleading with respect to diamond concentration.
An incident is recollected where high diamond grade was estimated for a highly diluted kimberlite in Canada, without any of the sampling records referring to the high levels of dilution observed in drill core that was typical for this kimberlite. Other discrepancies between microdiamond and macrodiamond grade estimates occurred due to recovery issues and small sample variation, which had to be dealt with swiftly to restore confidence in the methodology [17].
The arrival of spreadsheet technology made it easier to do graphic representation and the 2nd degree polynomial proved to be applicable in every case examined, but often only when selected points on the sample LC-plot were eliminated. Rules were made about the minimum number of stones per size class required for reasonable LC modelling (the presence of at least ten stones in at least five consecutive size classes) and the minimum amount of sampling material (400kg) to be collected when sampling new sources7.
In 1997 a personal turning point came when a decision was made to treat more microdiamond samples from the Victor kimberlite in Canada. The decision was made to do limited 6-inch percussion drilling for macrodiamond recovery from this pipe, based almost solely on promising geochemistry results. Microdiamond sampling consistently yielded low stone counts and the associated non-typical LC-curve suggested low interest in the pipe.
Percussion sampling produced 96 macrodiamonds with combined weight of 6.99 carats and results were combined and plotted with existing microdiamond results on one LC-graph. An unusually coarse diamond concentration profile was observed and grade was estimated at more than 30cpht. The macrodiamonds were sent to Harry Oppenheimer House in Kimberley for diamond valuation8 [19].
Individual stone values were not customarily provided, but were requested and informally received. The values were grouped by size class and an average class value calculated. Combined with the size distribution derived from 113 microdiamonds from drill core and the 96 macrodiamonds from percussion drilling, an average diamond value in excess of US$200 was estimated, based on 6.99 carats.9 [22]
5
Author’s experience at De Beers 6
Oosterveld M.M., Diamond content curves for known Southern African producers, 1993, De Beers report 7
Ferreira J.J., A perspective on macrodiamond grade estimation based on microdiamond frequencies, 1995, De Beers report
8
Ferreira J.J., Attawapiskat grade estimate, 1997, De Beers report. 9
31 It was possible to model diamond size on the basis of the 96 macrodiamonds only, but the presence of the 113 microdiamonds confirmed the LC-curve for the coarse diamond size distribution. Observation of this coarse size distribution and the correlation between micro- and macrodiamonds gave impetus to the development and application of the methodology. [43]
With the intensified use of microdiamonds for diamond content estimation and the potential for wide application of the methodology, correct sampling procedures became a priority. Dr Matthew Field designed a sampling protocol in Kimberley and this was revised in 2004. It was again revised in 2006 in view of new findings from sampling planned for the Gacho Kue pipes in Canada and resource extension programs for the major Southern African mines.
The effect of kimberlite dilution as being directly related to diamond content was introduced by Dr Matthew Field and became one of the key variables to be recorded during microdiamond sampling [24].
In 2011 Dr Lantuéjoul introduced a theoretical approach to estimate diamond content based on microdiamonds using the Cox Process and incorporating the truncation principles used in this thesis [37].
Being able to access the more abundant size fraction of a diamond assortment provides real benefits, some of which are listed as follows:
• The abundance of small stones allows the use of much smaller samples. • Small samples are easy to handle, transport and store.
• Microdiamond samples are collected by visual inspection of drill core.
• Core drilling is cheaper than large diameter drilling and the possibility of drilling angled holes allows access to zones that would otherwise remain excluded from the sampling data base.
• Treatment and recovery takes place at authenticated laboratories and eliminates further overhead costs associated with sample treatment.
• Although the cost of recovering microdiamonds by means of acid digestion or caustic fusion is high, substantial saving is made with core drilling for microdiamond sampling instead of large diameter drilling (ldd) for macrodiamonds.
• Microdiamonds have no commercial value and it is not necessary to embark on an expensive campaign to secure diamonds.
• As the small stones hold no value and are easily stored they can be kept indefinitely. • Microdiamond sampling allows the development of a diamond size distribution model
even before the first macrodiamond sample is collected. Combination of the size distribution model with the values of a relatively small number of macrodiamonds provides a valuable first estimate of average diamond value for a deposit early in its evaluation sequence.
1.3 Diamond Size
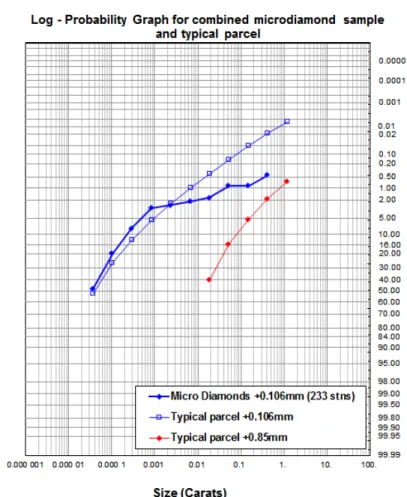
Continuity in the diamond size distribution is illustrated in Figure 1-2, which shows cumulative logarithmic probability curves (LP-curves) [60] for 12 microdiamond samples from a geological domain in a Canadian diamond deposit.
32 Figure 1-2: LP-graphs demonstrating continuity of distribution of diamond weight
The red arrow indicates the point which approximates the upper limit for microdiamond weights, clearly with no discontinuity in any of the sample curves. This is a typical observation, forming the basis for the use of microdiamonds for diamond content estimation.
The combined sample indicated by the black curve contains a large number of stones. Consequently its curve is more continuous and reaches well into the macrodiamond size range. If more samples are added, it will reach even further into the macrodiamond size range.
The use of the lognormal distribution for diamond weight has been used extensively [52] and is established in auditing procedures for commercial diamond recovery in the diamond industry. It plays an important role in this research and represents diamond assortments that include diamonds from far below commercial bottom truncation sizes.
Recovery of microdiamonds is achieved by means of acid digestion and caustic fusion methods and the high concentration of small stones holds many rewards with respect to sampling and estimation of diamond content.
1.4 Diamond concentration
Diamonds have a particulate nature and size plays an important role as larger stones generally tend to be more valuable.
Diamond content is derived from a combination of the distribution of diamonds in size classes and diamond concentration. The LC-curve is a graphic representation exposing the distribution of diamond concentration with diamond size. An example is shown in Figure 1-3.
Figure 1-3: Representat shows a plot of microdi recovery losses that suitable to be used for d
Sampling results are expressed stones per tonne (or per 100 t degree polynomial and is shown Until late in the 1990’s diam modelling diamond size. The substantially between different This research transformed micr modelling procedure. The iter diamond content via a combina The LC-curve in Figure 1-3 repre results and is used to derive dia
1.5 Diamond Content
The LP- and LC-curves introdu fundamental role in diamond co Every diamond pipe has a uniq diamond content estimation concentration. Diamond conte model and a model for diamond The continuous nature of the appropriate size range to be s above 0.075mm, while diamond sampling and production.
resentation of diamond content by means of LC-curve f microdiamond recovery with the bottom five size classe
that normally occur during sampling. These size cla sed for diamond size modelling.
xpressed as diamond concentration per size class in ter er 100 tonnes) per unit size class interval. The associa is shown to intersect the sample points not affected by b ’s diamond content estimates were based on the ize. The estimation process was highly subjective a different analysts and even between different attempts b microdiamond sampling and diamond content estima The iterative procedure first focuses on modelling dia combination of diamond concentration and diamond size
represents diamond concentration on the basis of erive diamond content above any appropriately selected
Content
introduced in the previous sections (Figure 1-2 mond content estimation.
unique diamond assortment and geological compo imation is to find statistical models for diamond d content is derived from a combination of the diam diamond concentration.
e of the distribution of diamond size provides the op to be sampled from. Microdiamond sampling is focus diamonds from size ranges above 0.5mm are recovered
33 urve. The example
ize classes affected by size classes are not
ss in terms of the number of e associated LC-curve is a 2nd
cted by bottom cut-off losses. n the LC-curve without first ective and estimates varied tempts by the same analyst. nt estimation into an iterative elling diamond size, then on
ond size.
sis of microdiamond sampling selected diamond size.
and Figure 1-3) play a
l composition and the art of iamond size and diamond diamond size distribution
s the option of selecting an is focused on the size range ecovered during conventional
34 Diamond size is modelled on the basis of the size distribution of microdiamonds in the form of the LP-curve.
Diamond concentration is modelled on the basis of subsample stone concentrations. If enough subsamples are available a statistical distribution is fitted to the concentration histogram.
Under the assumption of a continuous size distribution, a system has been developed to generate a typical diamond parcel with given diamond size and concentration distributions. The size and concentration models are used to generate a large sample in the form of, say 1million microdiamond subsamples. If the models are realistic the typical parcel should accurately reflect deposit diamond content in accordance with sampling data.
In the initial sampling stages the only data available almost always comprises microdiamonds recovered from thin core subsamples.
Continued interest in an occurrence eventually involves macrodiamonds to confirm the microdiamond size model and to provide diamond values for revenue modelling.
In the final estimation stages diamond content is established locally within domains in the deposit to allow mine planning exercises.
1.6 Sampling
The size of diamond deposits and the magnitude of sampling regimes inevitably require sampling to be done in phases. Initial interest is in the nature of the kimberlite deposit, mainly whether it is diamondiferous, and is immediately followed by an interest in diamond content. Further interest extends towards more detailed zonal diamond content in collaboration with developing a geological model for the deposit.
If diamond content suggests potential economic viability then diamond value becomes the next variable of interest and sampling is focused on recovering diamonds from the commercial size range. If economic viability is still indicated then sampling intensifies to provide information for Order of Magnitude and Pre- Feasibility or Feasibility studies.
The use of microdiamond sampling for diamond content estimation involves diamond core drilling, which is also used for the development of deposit geology and geometry. Core is laid out in core boxes and subsamples are visually selected according to a sampling protocol to ensure correct sampling procedures and repeatability of the sampling process.
Microdiamond subsamples vary between 8kg and 20kg, but subsample size is at times determined by the nature of the occurrence. For instance, intersecting a thin dyke may not always yield the predetermined subsample size.
Initial sampling commences with little or no knowledge of the deposit and the aim of initial sampling is to establish whether the occurrence is diamondiferous. If it is, then the results of the initial sampling program can be used to design a sampling protocol for further sampling.
Reconnaissance sampling is the first sampling phase and is aimed at determining the extremities of
the occurrence and a preliminary description of internal geology, such as the amount of overburden and an impression of the complexity of geology from drill core. This phase is also concerned with the occurrence of other bodies nearby which may contribute to an eventual mining operation.
This is followed by exploration sampling, aimed at diamond content by domain and estimates of average diamond value. The geological model is revised and improved with every additional hole drilled. An occurrence may be abandoned outright during the reconnaissance phase, but it is possible that a potentially marginal project may hinge on confirmation by further sampling even in the
35 exploration phase. This phase may also take place at an operating mine where sampling is required to extend the resource to deeper levels that have not been sampled before.
Reconnaissance and Exploration sampling provide information to determine if there are reasonable prospects for eventual economic extraction (RPEEE), or to perform a preliminary economic assessment (PEA). These studies are eventually followed by more detailed advanced sampling programs. [45]
1.7 Application
Microdiamond sampling is currently applied in reconnaissance and exploration sampling at almost every new primary source of diamonds. The author was involved in applying and testing microdiamond methodology successfully at the following occurrences:
• Gacho Kue kimberlites in Canada.
• The Fort a la Corne kimberlites in Canada. • Kimberlites in the Slave province in Canada
• Orapa, Letlhakane and Jwaneng mines in Botswana. • Venetia mine in South Africa.
• Diamond content estimation at the Lomonosov and Grib kimberlites in Russia. [16] • Estimation of Premier Mine C-Cut.
• Estimation of diamond content in Du Toits Pan mine, Kimberley • Koffiefontein, South Africa.
• Marsfontein kimberlite and dykes, South Africa. • Estimation of Finsch Mine Block 4 diamond content.
• Diamond size distribution modelling for AK6 (Karowe Mine) in Botswana. • Development of resources in Lesotho. [39]
• Development of Tongo Dyke deposits in Sierra Leone.
• Assessment of diamond content in the Lace Mine, South Africa. • Kimberlites in the DRC and Angola.
• Analysis of Snap Lake microdiamond sampling results.
• Exploration on Baffin Island in Canada and assessment of diamond potential for Chidliak pipe CH31 and others.
• Numerous other deposits in Canada, including Attawapiskat kimberlites. • Initial evaluation of Victor Pipe in Canada.
• Assessment of kimberlites in South America. • Lahtojoki kimberlite in Finland.
1.8 Further research
Several aspects of the application of microdiamonds in mineral resource estimation require further research.
• The assumption of a lognormal size distribution has yielded successful results, but other distributions are to be considered.
• Quantification of uncertainty associated with estimates. • Application of microdiamond sampling for ore reserve control.
36 • Implementation of sample size reduction methodology and the role of microdiamonds in
work relating to Sampling Theory by Pierre Gy.
• Practical aspects such as critical weight, average class weights, flexibility with respect to size class selections.
• Methodology associated with ‘Diamond within Kimberlite’ (DWIK) technology. • Local estimation and simulation based on microdiamonds [37].
• Sampling strategies that target the +0.3mm microdiamond size fraction for kimberlites with low diamond concentration and coarse diamond size distribution.
37
PART I METHODOLOGY
39
2 Diamonds in Kimberlite
Résumé
Un gisement de diamants est souvent constitué de plusieurs types de kimberlites, émanant de différentes éruptions volcaniques survenues à des millions d'années d'intervalle. Chaque type de kimberlite a ses propres caractéristiques de pierres en matière de concentration, de taille et de valeur. L'évaluation du gisement commence par la mise au point d'un modèle géologique qui identifie les différentes kimberlites qui le constitue et en détermine les caractéristiques. L'échantillonnage utilisé pour cette phase de reconnaissance est lui-même fonction de ces caractéristiques.
Une caractéristique importante des gisements de diamants est la nature discrète de la minéralisation, et la granulométrie des pierres joue un rôle essentiel dans l'estimation de leur valeur moyenne. Cette distribution granulométrique s'étend sur une large gamme de valeurs, allant de quelques microns à quelques millimètres. De façon générale, les pierres commercialisables ne se trouvent pas en abondance dans le gisement. La découverte d'une pierre de grande taille est rare et constitue un évènement en soi. Les pierres les plus petites sont les plus fréquentes, et de ce fait jouent un rôle important dans le processus d'échantillonnage et d'estimation, même si elles n'ont aucune valeur économique.
Les ressources en diamants d'un gisement de kimberlite sont principalement spécifiées par deux facteurs, à savoir la concentration en pierres et leur granulométrie. La présent chapitre explique en détail la façon dont ces deux facteurs affectent les procédures d'échantillonnage et d'estimation, en accordant une importance toute particulière à l'acquisition des données de microdiamants et de leur utilisation. La description des opérations d'une procédure séquentielle type d'estimation conclut ce chapitre.
Overview
A kimberlite deposit often comprises more than one kimberlite family, each family composed of material from a different volcanic pulse occurring millions of years apart. Material from each pulse contains a diamond assortment that is unique with respect to the amount and value of diamonds contained, or may be barren. A deposit is examined by means of sampling in a way that is determined by the distribution and amount of diamonds present in the deposit. Evaluation begins with the
40 development of a geological model that defines the composition of the ore body in terms of the characteristics of the kimberlite material it contains.
The particulate nature of diamonds is characteristic of diamonds and the distribution of diamond size plays a vital role in estimating the amount and average value of diamonds. In the context of the research the most important characteristic of diamond mineralisation is that diamonds occur as unique assortment in a deposit, containing stones occurring in a continuous size distribution from micro sizes to large valuable stones. Diamonds of commercial size do not occur in abundance and large diamonds are so rare that its occurrence is often newsworthy. Small diamonds are most abundant and although worthless in terms of monetary value, are highly valuable for sampling and diamond content evaluation.
The amount of diamonds in a deposit is determined by two variable components, diamond concentration and diamond size. The characteristics of the assortment of diamonds contained in kimberlite are discussed with respect to sampling and estimation. The emphasis is on the collection and application of microdiamond information. For perspective on sampling and estimation procedures the chapter concludes with a typical evaluation sequence.
Microdiamond sampling initially leads to an estimate of the amount of diamonds in situ. Recoverable diamond content is derived by taking cognisance of losses due to the application of a bottom cut-off size during production.