For Peer Review
Palaeoenvironmental history of the last six centuries in the Nettilling Lake area (Baffin Island, Canada): A multi-proxy
analysis
Journal: The Holocene Manuscript ID HOL-14-0258.R2 Manuscript Type: Paper
Date Submitted by the Author: 13-Feb-2016
Complete List of Authors: Beaudoin, Anne; Université Laval, Département de géographie Pienitz, Reinhard; Université Laval, Département de géographie FRANCUS, Pierre; INRS, ETE
Zdanowicz, Christian; Uppsala Universitet, Earth Sciences St Onge, Guillaume; UQAR, ISMER
Keywords: Nettilling Lake, Penny Ice Cap, Baffin Island, Lake sediment, Palaeoclimate, Little Ice Age
Abstract:
The Baffin Island region in the eastern Canadian Arctic has recently experienced a rapid warming, possibly unprecedented in millennia. To investigate the response of freshwater environments to this warming and place it in a secular perspective, we analyzed a 80-cm long sediment core from Nettilling Lake, the largest lake of the Canadian Arctic Archipelago. The core was taken from a part of the lake basin that receives meltwater and sediment inputs from the nearby Penny Ice Cap. The core time scale, established using 137Cs and palaeomagnetic techniques, spans an estimated 600 years. A multi-proxy approach was used to document changes in the physical, chemical and biological properties of the sediments. We found evidence for a relatively mild period (mid/late 15th century to mid/late 16th century) during the early part of the Little Ice Age (LIA), characterized by high sedimentation rates and laminations. This was followed by colder, drier and windier conditions corresponding to the coldest phase of LIA and coinciding with the latest and most extensive period of regional ice cap expansion (early 16th to late 19th centuries). A rapid warming occurred at the beginning of the 20th century. Variations in titanium (Ti) content in the core, a proxy for detrital sediment inputs, showed good agreement with reconstructed secular variations in summer melt rates on Penny Ice Cap between mid 14th century and the present-day, providing supporting evidence for a climatic-hydrological connection between the ice cap and Nettilling Lake.
For Peer Review
8 9 10 11 12 13 14 15 16 17 18 19 20 21 22 23 24 25 26 27 28 29 30 31 32 33 34 35 36 37 38 39 40 41 42 43 44 45 46 47 48 49 50 51 52For Peer Review
PALAEOENVIRONMENTAL HISTORY OF THE LAST SIX CENTURIES IN THE NETTILLING LAKE AREA (BAFFIN ISLAND, CANADA): A MULTI-PROXY ANALYSIS
Anne Beaudoin, Reinhard Pienitz, Pierre Francus, Christian Zdanowicz and Guillaume St-Onge.
The Baffin Island region in the eastern Canadian Arctic has recently experienced a rapid warming, possibly unprecedented in millennia. To investigate the response of freshwater environments to this warming and place it in a secular perspective, we analyzed a 80-cm long sediment core from Nettilling Lake, the largest lake of the Canadian Arctic Archipelago. The core was taken from a part of the lake basin that receives meltwater and sediment inputs from the nearby Penny Ice Cap. The core time scale, established using 137Cs and palaeomagnetic techniques, spans an estimated 600 years. A multi-proxy approach was used to document changes in the physical, chemical and biological properties of the sediments. We found evidence for a relatively mild period (mid/late 15th century to mid/late 16th century
)
during the early part of the Little Ice Age (LIA), characterized by high sedimentation rates and laminations. This was followed by colder, drier and windier conditions corresponding to the coldest phase of LIA and coinciding with the latest and most extensive period of regional ice cap expansion (early 16th to late 19th centuries). A rapid warming occurred at the beginning of the 20th century. Variations in titanium (Ti) content in the core, a proxy for detrital sediment inputs, showed good agreement with reconstructed secular variations in summer melt rates on Penny Ice Cap between the mid 14th century and the present-day, providing supporting evidence for a climatic-hydrological connection between the ice cap and Nettilling Lake.Keywords: Nettilling Lake, Penny Ice Cap, Baffin Island, lake sediments, palaeoclimate, Little Ice Age
8 9 10 11 12 13 14 15 16 17 18 19 20 21 22 23 24 25 26 27 28 29 30 31 32 33 34 35 36 37 38 39 40 41 42 43 44 45 46 47 48 49 50 51 52
For Peer Review
Anne Beaudoin (anne.beaudoin.1@ulaval.ca) and Reinhard Pienitz
(reinhard.pienitz@cen.ulaval.ca), Laboratoire de Paléoécologie Aquatique (LPA),
Département de Géographie and Centre d’études nordiques (CEN) Pavillon
Abitibi-Price, 2405 rue de la Terrasse, Université Laval, Québec, QC, Canada G1V 0A6.
Pierre Francus (pierre.francus@ete.inrs.ca), Institut national de la recherche
scientifique, Centre Eau Terre Environnement (INRS-ETE), 490 de la Couronne,
Québec, QC, Canada G1K 9A9 and Centre d’études nordiques (CEN) Pavillon
Abitibi-Price, 2405 de la Terrasse, Université Laval, Québec, QC, Canada G1V 0A6.
Christian Zdanowicz (christian.zdanowicz@geo.uu.se), Department of Earth
Sciences, Uppsala University, Villavägen 16, 752 36 Uppsala, Sweden
Guillaume St-Onge (guillaume_st-onge@uqar.ca), Institut des sciences de la mer de
Rimouski (ISMER), Paleomagnetism and Marine Geology Laboratory, Université du
Québec à Rimouski, and GEOTOP, 310 allée des Ursulines, Rimouski, Québec,
Canada, G5L 3A1. 8 9 10 11 12 13 14 15 16 17 18 19 20 21 22 23 24 25 26 27 28 29 30 31 32 33 34 35 36 37 38 39 40 41 42 43 44 45 46 47 48 49 50 51 52
For Peer Review
1. IntroductionHigh latitude ecosystems are particularly vulnerable to impacts of recent
human-induced climate change due to numerous positive feedback mechanisms (Overpeck et
al., 1997; Everett and Fitzharris, 1998). Earlier spring snowmelt and declining lake
and sea-ice cover extents, associated with decreasing surface albedo, result in
increased exposure to, and absorption of, solar energy. Observed and predicted
consequences of climate warming at high latitudes include higher air temperatures,
modifications of the hydrological regime, permafrost degradation and melting of
glaciers and ice caps (Pienitz et al., 2004; IPCC, 2013).
Evidence of recent warming in the Foxe Basin / southern Baffin Island region (Miller
et al., 2013) includes a reduction of seasonal sea ice cover volume (Moore, 2006) and
an increased rate of summer melting on terrestrial ice caps (Zdanowicz et al., 2012).
Long instrumental climate records in the Canadian Arctic are very sparse. In the
absence of such records, pollen, diatoms or other lake sediment properties can be
used to reconstruct regional climate variations or the response of aquatic ecosystems
to these variations. In particular, lakes are known to respond rapidly to environmental
changes, such as variations in temperature (e.g., Pienitz et al., 2004). An increase of
8 9 10 11 12 13 14 15 16 17 18 19 20 21 22 23 24 25 26 27 28 29 30 31 32 33 34 35 36 37 38 39 40 41 42 43 44 45 46 47 48 49 50 51 52
For Peer Review
only a few degrees can profoundly change ice cover conditions, modify the lake
dynamics and increase primary productivity (Wolfe and Smith, 2004; Hodgson and
Smol, 2008). Numerous studies have shown that recent environmental changes
experienced by northern lakes are without any analogues throughout the Holocene
and beyond (e.g., Axford et al., 2009, Wolfe and Smith, 2004).
Nettilling Lake on south-central Baffin Island has the largest freshwater catchment in
the Canadian Arctic Archipelago, and as such, is an interesting study site for
understanding the impact of current climate change on Arctic lacustrine
environments. In this paper, we present the first detailed reconstruction of the past
environmental history of Nettilling Lake, developed using an innovative, multi-proxy
approach that integrates physical, chemical and biological properties recorded in lake
sediments. Our main goal was to document past environmental and hydro-climatic
changes in Nettilling Lake. In addition, we compared the sedimentary record of
Nettilling Lake with an ice-core based proxy record of summer warmth developed
from nearby Penny Ice Cap (Grumet et al., 2001; Zdanowicz et al., 2012), which
supplies abundant meltwater and sediments to the lake.
8 9 10 11 12 13 14 15 16 17 18 19 20 21 22 23 24 25 26 27 28 29 30 31 32 33 34 35 36 37 38 39 40 41 42 43 44 45 46 47 48 49 50 51 52
For Peer Review
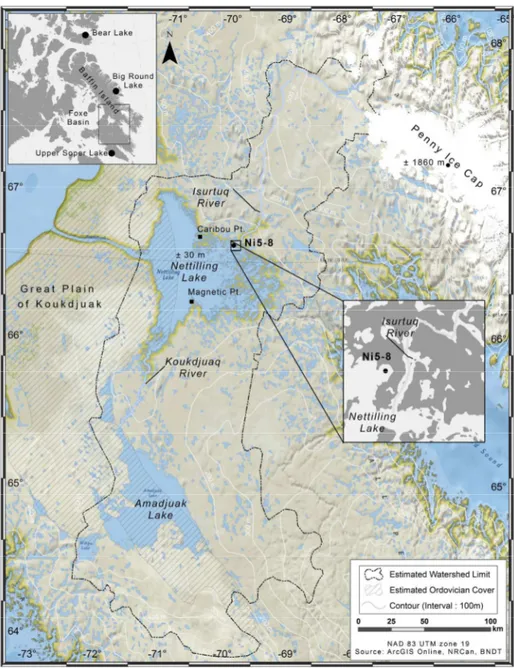
2. Study siteNettilling Lake (66.51°N, 70.90°W) is located in the south-central part of southern
Baffin Island, and has an estimated surface area of 5 542 km2 (Figure 1). The
maximum measured lake water depth is 132 m, but most of the lake is less than 60 m
deep (Oliver, 1964). With an estimated catchment area of 52,970 km2 (including the
Amadjuak Lake catchment area), Nettilling Lake is the most extensive freshwater
aquatic drainage system in the Canadian Arctic Archipelago. However, because of its
remote location, it has received limited research attention, and little is known of its
past environmental history (Jacobs et al., 1997).
[insert Figure 1.]
Like most Arctic lakes, Nettilling Lake has a low biological productivity, and its ice
cover persists approximately from mid-September to mid-July (Oliver, 1964; and
recent observations by the authors, 2010-2015). The lake can be subdivided into two
main morphological regions separated by a line from Magnetic Point (north shore) to
Caribou Point (south shore; Figure 1). The western region has a regularly shaped
deep basin and shoreline, while the eastern region has more irregular basin and
shoreline shapes and numerous islands. This subdivision coincides with the contact
between two different geological settings: the lowlands on the western side of the
8 9 10 11 12 13 14 15 16 17 18 19 20 21 22 23 24 25 26 27 28 29 30 31 32 33 34 35 36 37 38 39 40 41 42 43 44 45 46 47 48 49 50 51 52
For Peer Review
lake basin are mostly composed of Palaeozoic carbonates (Hudson Platform),
whereas the bedrock of the eastern side is mostly made up of low-relief granite and
gneiss plateaus of Precambrian age belonging to the Canadian Shield (Blackadar,
1967). Both areas are covered by unconsolidated glacial drift. Nettilling Lake is
located below the estimated regional maximum postglacial marine transgression limit
(~93 m above sea-level (asl.)), and was therefore likely submerged by marine waters
of the post-glacial Tyrrell Sea about 6.7 ka BP, following the retreat of the Laurentide
Ice Sheet (Blake 1966; Dyke, 1979; Jacobs et al., 1997). The postglacial isostatic
rebound eventually isolated the area from marine influence and allowed the
establishment of a freshwater basin around 5 ka BP (Blake, 1966; Narancic et al.,
2013).
Nettilling Lake drains to the west into Foxe Basin via the large Koukdjuak River
(~74 km long) (Figure 1). Main tributaries feeding into Nettilling Lake are Amadjuak
Lake, located to the south, and the Isurtuq River to the northeast. Isurtuq River, which
is fed by meltwater from Penny Ice Cap, is about 235 km long and splits into two
channels about 7 km before entering into Nettilling Lake. About 30 km from the ice
cap, the river intersects a deltaic complex formed at the former entry point of a long
8 9 10 11 12 13 14 15 16 17 18 19 20 21 22 23 24 25 26 27 28 29 30 31 32 33 34 35 36 37 38 39 40 41 42 43 44 45 46 47 48 49 50 51 52
For Peer Review
proglacial lake system. Together, these hydrographic features have, and probably
continue to exert influence on sediment delivery into Nettilling Lake.
Penny Ice Cap (6 410 km2) is a remnant of the Foxe Dome sector of the Wisconsinan
Laurentide Ice Sheet (Fisher et al., 1998). Summer melt rates on the ice cap have
been increasing irregularly since the mid-19th century, with the most recent
acceleration after the 1980s, and are presently as high as they have ever been through
the Late Holocene (Zdanowicz et al., 2012). Inputs of glacial meltwater from Penny
Ice Cap, highly charged with silt, create a large plume of suspended material in the
eastern part of Nettilling Lake, which contrasts with the transparent waters of the
western basin (Figure 2).
[insert Figure 2.]
3. Material and methods 3.1. Sediment core collection
Field work was conducted at Nettilling Lake during the summer of 2010. In this paper, we focus on results obtained from core Ni5-8, a 90-cm long core retrieved with a percussion corer at a water depth of 18.9 m in a small bay in the northeastern part of the lake (66.67 °N 69.92 °W) (Figure 1), using a handheld percussion corer (Aquatic
8 9 10 11 12 13 14 15 16 17 18 19 20 21 22 23 24 25 26 27 28 29 30 31 32 33 34 35 36 37 38 39 40 41 42 43 44 45 46 47 48 49 50 51 52
For Peer Review
Research Instruments). The maximum thickness of the sediments deposited at this site is presently unknown. The sampling site was chosen based on its location near the outlet of Isurtuq River, which provides favorable setting for the preservation of a climatemodulated record of detrital inputs from Penny Ice Cap glacial meltwater.
3.2. Core analysis
Sedimentology and chemical analyses
In the Laboratoire de Paléoécologie Aquatique (LPA) at Université Laval, one half of
core Ni5-8 was sampled at 0.5 cm resolution and then freeze-dried during 48 h.
Organic matter (OM) content was determined at 1-cm resolution (one sample out of
two) on 0.3 g of dry sediment using loss-on-ignition (LOI) at 550 °C during 5 h,
following the method of Heiri et al. (2001). Grain size analyses were performed at
1-cm resolution using a HORIBA laser diffraction analyzer at the Laboratoire de
Géomorphologie et Sédimentologie at Université Laval. About 0.3 g of freeze-dried
and OM-free sediment (removed by combustion) was mixed in 5 ml of Calgon
electrolytic solution (hexametaphosphate, 10 %). Prior to grain size measurements,
each sample was exposed to ultrasounds for 2 min in order to break down aggregates.
Statistical parameters of the grain size distribution (mean, median, skewness and
8 9 10 11 12 13 14 15 16 17 18 19 20 21 22 23 24 25 26 27 28 29 30 31 32 33 34 35 36 37 38 39 40 41 42 43 44 45 46 47 48 49 50 51 52
For Peer Review
sorting) were then calculated with the GRADISTAT v8.0 software using the
geometric method of moments (Blott and Pye, 2001).
The remaining half-sectioned core was first analyzed for magnetic susceptibility at
the Institut des Sciences de la Mer de Rimouski (ISMER) of the Université du
Québec à Rimouski. Measurements were done every cm using a Bartington point
sensor on a GEOTEK multi-sensor core logger. The same half-sectioned core was
then analyzed for major and minor element geochemistry using an ITRAX core
scanner at the Institut National de la Recherche Scientifique, Centre Eau Terre
Environnement (INRS-ETE), Québec. This instrument uses X-ray fluorescence
(XRF) to measure semi-quantitative fluctuations in geochemical elemental
abundances (Croudace et al., 2006). Measurements were done at high-resolution
intervals (100 µm with 30 s of exposure time, 30 kV of voltage and 25 mA of current)
using a molybdenum-source X-ray tube, and individual elemental profiles (in counts
per seconds; cps) were normalized by the total counts (expressed in kcps) at the
corresponding depths to eliminate the effects of variable water and OM content in the
sediment core (Croudace et al., 2006). Profiles were smoothed with a running mean
8 9 10 11 12 13 14 15 16 17 18 19 20 21 22 23 24 25 26 27 28 29 30 31 32 33 34 35 36 37 38 39 40 41 42 43 44 45 46 47 48 49 50 51 52
For Peer Review
over 1000 µm intervals. The scanner also produces a positive X-ray radiography (a
proxy for core density) with a 100 µm resolution.
Thin sections of core Ni5-8 were made according to methods described in Lamoureux
(1994) to characterize and interpret the fine sedimentary structures. Slabs of sediment
(18 cm-long x 2 cm-wide x 0.7 cm-deep) were sampled, submerged in liquid nitrogen
and then freeze-dried for 48 h. Samples were impregnated in a low viscosity resin
under light vacuum. After 48 h in an oven at 80 °C, slabs were cut with a 45˚ angle
into three blocks, from which polished thin sections were prepared.
Dating
In order to construct a depth-age model for core Ni5-8, two different approaches were
combined: radiometric dating and palaeomagnetism. First, the cesium-137 (137Cs)
activity of the sediment was measured in the top 15 cm of core Ni5-8 by gamma-ray
spectroscopy using a High Purity Germanium (HPGe) well detector system at the
Laboratoire de Radiochronologie, Université Laval. The measurements were carried
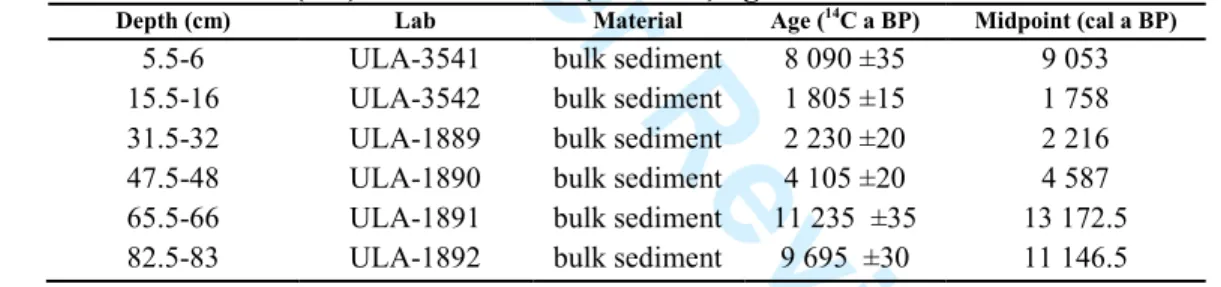
out at 1-cm intervals from 0 to 30 cm depth. Radiocarbon (14C) and lead 210 (210Pb)
measurements were also performed, but results were not considered usable due to
8 9 10 11 12 13 14 15 16 17 18 19 20 21 22 23 24 25 26 27 28 29 30 31 32 33 34 35 36 37 38 39 40 41 42 43 44 45 46 47 48 49 50 51 52
For Peer Review
extremely low OM content and the predominance of sediment probably eroded from
the crystalline bedrock beneath Penny Ice Cap (see supplementary file).
To develop the depth-age model beyond 15 cm core depth, we combined 137Cs and
palaeomagnetism. This method is based on the principle that under favorable
conditions in aquatic environments, magnetic particles in the sediments can record
the orientation and intensity of the geomagnetic field at the time of deposition, which
can be estimated from geomagnetic models (e.g., Tauxe, 2010; Stoner and St-Onge,
2007). To measure changes in direction of the geomagnetic field, magnetic properties
were measured at 1-cm intervals at the Laboratoire de Paléomagnétisme et Géologie
Marine of ISMER (Rimouski, Québec), using a 2 G EnterprisesTM 755 cryogenic
magnetometer on 3 U-channels (4 cm2). Because the core had been already
subsampled for thin sections, a few sections of the U-channels were not completely
filled with sediment. To minimize errors in measurements, U-channels were
overlapped and data were removed from the dataset where duplication of U-Channel
sampling intervals was not possible (gaps in Figure 3). The Natural Remanent
Magnetization (NRM) was measured using alternating field (AF) demagnetization
steps from 0 to 75 mT (5 mT increments). The magnetic inclination in the sediment
was computed by principal component analysis (PCA) using AF demagnetization
8 9 10 11 12 13 14 15 16 17 18 19 20 21 22 23 24 25 26 27 28 29 30 31 32 33 34 35 36 37 38 39 40 41 42 43 44 45 46 47 48 49 50 51 52
For Peer Review
steps from 15 to 75 mT (Mazaud, 2005). The maximum angular deviation (MAD)
values were also computed and used as indicators of the quality of the
palaeomagnetic data.
Biological analyses
In the Laboratoire de Paléoécologie Aquatique (LPA), fossil diatoms preserved in
core Ni5-8 were extracted with hydrogen peroxide (30% H2O2) digestion techniques
and mixed with marker microspheres (1.57 x 10⁶ microspheres ml-1). Microscope
slides were mounted using Naphrax, a highly refractive synthetic resin (Battarbee et
al., 2002). A minimum of 300 to 500 diatom valves were counted and identified for
each subsample according to their concentration. Where diatoms were less abundant,
300 valves were identified or 1000 microspheres were counted. Identification of
diatom species was made using a Leica DMRB microscope at 1000x magnification
under oil immersion. The main taxonomic keys used were Fallu et al. (2000),
Krammer & Lange-Bertalot (1986, 1988, 1991a, b) and Antoniades et al. (2008).
Statistical analyses
PCA Chronological cluster analysis was performed on down-core profiles of
normalized chemical element abundances, LOI, and water content to detect common
patterns of variations in these data. Subsequently, chronological cluster analysis was
8 9 10 11 12 13 14 15 16 17 18 19 20 21 22 23 24 25 26 27 28 29 30 31 32 33 34 35 36 37 38 39 40 41 42 43 44 45 46 47 48 49 50 51 52
For Peer Review
also performed on the same data. Data were first standardized and transformed in
Euclidean distance, and the clustering results were used to divide core Ni5-8 into
distinct stratigraphic zones. The number of significant zones was determined using
the broken stick model (Birks, 2012). Geochemical data were transformed from depth
(cm) to age (year) scale using the developed age model (see section 4.2) in order to
facilitate comparisons with other records. Correlation coefficients (R) between
different profiles of chemical elements were computed on the normalized data. Serial
autocorrelations in the data were taken into account, and reduced degrees of freedom
were used in order to test the significance of the observed correlations (Ebisuzaki,
1997).
Penny Ice Cap data
A proxy record of past summer warmth was developed from ice cores drilled at the summit of Penny Ice Cap (67.25 ° N, 65.77 ° W, ~1860 m a.s.l.) in 1995 and 2010 (Grumet et al., 2001; Fisher et al., 2011; Zdanowicz et al., 2012). The proxy used is the volumetric percentage of ‘’melt features’’ (MF %) in the cores, which are distinct, bubble-poor layers or lenses of ice formed by the refreezing of surface meltwater into underlying firn. Koerner (1977) first established that the relative abundance of these features is correlated to past summer warmth conditions. The composite MF record
8 9 10 11 12 13 14 15 16 17 18 19 20 21 22 23 24 25 26 27 28 29 30 31 32 33 34 35 36 37 38 39 40 41 42 43 44 45 46 47 48 49 50 51 52
For Peer Review
developed from Penny Ice Cap cores covers the period 1695 to 1992 AD at 5 to 10-year resolution, and extends to ~3300 years ago, but with a 25-year resolution only. For the period considered in this paper, i.e. the past 6 centuries, the possible dating error in the Penny Ice Cap chronology is estimated to be < 10 % of true age (Zdanowicz et al., 2012).
4. Results
4.1. General core description
Visual and X-ray examination of core Ni5-8 revealed diffuse, dark yellowish brown layers (Munsell color scale = 10YR 4/6) and dark gray ~0.5 cm thick layers (10YR 4/1) in the upper part of the core. A notable perturbation in sedimentary structures (very diffuse layer boundaries) was found in the middle part of the core (~17 to 47 cm). The lower part (60 to 90 cm) is also characterized by several black diffuse layers (~2 mm to 5 mm). Neither discontinuities nor erosion surfaces were observed in thin sections and X-radiographies.
8 9 10 11 12 13 14 15 16 17 18 19 20 21 22 23 24 25 26 27 28 29 30 31 32 33 34 35 36 37 38 39 40 41 42 43 44 45 46 47 48 49 50 51 52
For Peer Review
4.1. Development of core chronologyThe chronology of core Ni5-8 was developed using 137Cs and palaeomagnetic secular
variations (PSV) correlated with geomagnetic field model outputs. Such a
combination of techniques has been successfully applied for dating marine and lake
sediments at other sites in the Canadian Arctic (e.g., Barletta et al., 2010a, Antoniades
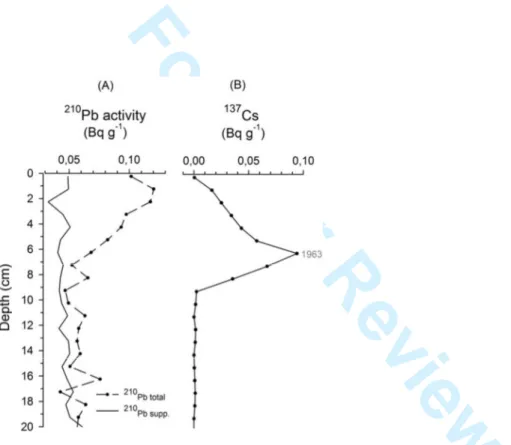
et al., 2011, Cook et al, 2009). The 137Cs profile presents a well-defined peak at
6.25 cm, which is attributed to the year 1963 AD when maximum atmospheric fallout
of 137Cs from pre-moratorium surface nuclear weapon tests was attained (Figure 3A)
(Appleby, 2001). The 137Cs peak is sharp, which suggests negligible vertical mixing
in the sediments.
[insert Figure 3.]
Geomagnetic inclination variations were used to define the core chronology below 15
cm depth (Figure 3). Inclination values oscillate around the geocentric axial dipole
(GAD) (77.8°N for Nettilling Lake) and very low maximum angular deviation
(MAD) values were obtained (below 5.4°, with a mean of 2.3°), which indicate
high-quality directional data (Stoner and St-Onge, 2007). An initial chronology was first
developed for the entire core Ni5-8 assuming a constant sedimentation rate based on
8 9 10 11 12 13 14 15 16 17 18 19 20 21 22 23 24 25 26 27 28 29 30 31 32 33 34 35 36 37 38 39 40 41 42 43 44 45 46 47 48 49 50 51 52
For Peer Review
137Cs peak. The inclination profile was then compared to several model
reconstructions of past global geomagnetic field variations for the location of
Nettilling Lake using the AnalySeries 2.0.4 software (Paillard, 2006) to provide
further chronological constraints (Figure 3). We used the Cals3k.4 model that spans
the past 3000 years (Korte and Constable, 2011), as well as the GUMF1 model which
extends back to 1590 AD (Jackson et al., 2000). In addition, we compared the Ni5-8
inclination record to the Eastern Canadian Stack, a 14C-constrained compilation of
marine palaeomagnetic directional and palaeointensity records (Barletta et al.,
2010b).
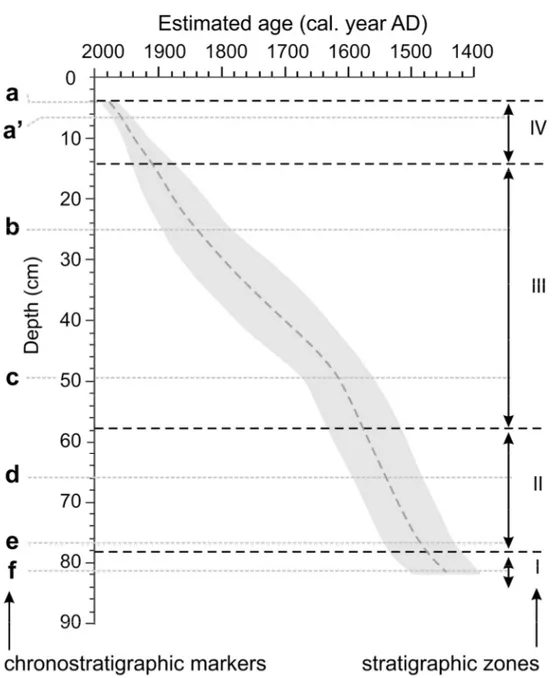
Correlations between the Ni5-8 palaeomagnetic profile and these various datasets
were established using 6 tie points labelled a to f in Figures 3 and Table 1. A highly
significant correlation was found between the Ni5-8 inclination series and the Cal3k.4
model output for the Nettilling Lake region (R = 0.74, p-value = 0.0147, α = 0.05).
The inclination profile of core Ni5-8 was also highly correlated with the GUMF1
model for the region (R = 0.77, p-value = < 0.01, α = 0.05).
Table 1. Correlated tie points with the Cals3k.4 (Korte and Constable, 2011), GUMF1 (Jackson et al., 2000) models and the Eastern Canadian stack (Barletta et al., 2010b) associated with depth in core Ni5-8.
Cals3k.4 GUMF1 Eastern Canadian
stack
Estimated
mean age Depth (cm)
8 9 10 11 12 13 14 15 16 17 18 19 20 21 22 23 24 25 26 27 28 29 30 31 32 33 34 35 36 37 38 39 40 41 42 43 44 45 46 47 48 49 50 51 52
For Peer Review
(AD) a 1980 1984 - 1982 4 b 1850 1842 - 1846 25 c 1610 1625 - 1617.5 49 d - - 1541 1541 66 e - - 1492 1492 77 f - - 1450 1450 82The age-depth model developed by combining 137Cs and palaeomagnetic data gives
an estimated bottom age for core Ni5-8 in the early 14th century, at ~1362 AD
(Figure 4). The time interval recorded in core Ni5-8 therefore spans much or most of
the Little Ice Age (LIA) cold climate interval, which, on the basis of various
palaeoclimatic proxies, is estimated to have lasted from the mid-/late 13th to the 19th
century in the eastern Canadian Arctic (Grumet et al., 2001; Moore et al., 2001;
Briner et al., 2009; Kaufman et al., 2009; Rolland et al., 2009; Thomas and Briner, 2009; Miller et al. 2012; Margreth et al., 2014).
Our age-depth model for core Ni5-8 yields sedimentation rates ranging from 0.10 to
0.26 cm a-1 over the past ~600 years, with an average of 0.15 cm a-1, close to the one
(0.13 cm a-1) obtained from the 137Cs peak.
In order to estimate the possible error of the age model for Nettilling Lake core Ni 5-8, a Markov chain Monte Carlo procedure was employed to simulate stochastic variations in sedimentation rates between pairs of chronostratigraphic markers. The
8 9 10 11 12 13 14 15 16 17 18 19 20 21 22 23 24 25 26 27 28 29 30 31 32 33 34 35 36 37 38 39 40 41 42 43 44 45 46 47 48 49 50 51 52
For Peer Review
method adopted here shares similarities with the Bayesian approach of Blaauw and Christen (2011), but differs in some respects. In Blaauw and Christen's method, sedimentation is assumed to follow an autoregressive gamma function, the parameters of which must be estimated a priori. In our approach, rather than imposing a defined probability function (PDF), we used Holocene sedimentation data series from proglacial lakes on Baffin Island as models, based on the assumption that sedimentation in Nettilling Lake shares the same type of PDF (whatever it may be) and spectra of temporal variations. Such assumptions are plausible, even if sedimentation rates differ between lakes. The template data used originate from Donard Lake on southeastern Baffin Island (Moore et al., 2001), and from Big Round Lake on northeastern Baffin Island (Thomas and Briner, 2009). In an iterative procedure, randomly-selected subsets of these data were used to generate surrogate series of stochastic sedimentation rate variations with the same PDF and temporal spectra as the template series, but with different (prescribed) means. The Iterative Amplitude Adjusted Fourier Transform (IAAFT) algorithm of Schreiber and Schmitz (1996) was used to generate thousands of surrogate series, from which the possible range of corresponding ages between chronostratigraphic markers was estimated. The procedure implicitly takes into account autocorrelation in the data series to the extent
8 9 10 11 12 13 14 15 16 17 18 19 20 21 22 23 24 25 26 27 28 29 30 31 32 33 34 35 36 37 38 39 40 41 42 43 44 45 46 47 48 49 50 51 52
For Peer Review
that it partly defines their temporal spectra. We also accounted for the possible age uncertainties on the various marker horizons, which were conservatively estimated to range between ± 20 years (2σ) for the 137Cs-dated 1963 layer, to ± 50 years (2σ) for marker horizons dated by palaeomagnetism. In the latter case, the age uncertainty reflects possible errors in the estimated correlative depths with the Cals3k.4 or GUMFI models, or with the Eastern Canadian Stack, or 14C uncertainties in the data used to constrain these models. The resulting estimated error range for the age model of core Ni 5-8, as determined by the procedure described above, is shown as gray shading in Figure 4. The width of the shaded envelope corresponds to the outer bounds of the 95 % confidence interval, and the broken line is the median age estimate of the sediment layers. The largest dating error, found at mid-depth between horizons b and c (~38 cm), is estimated to be ± 110 years.
[insert Figure 4.] 8 9 10 11 12 13 14 15 16 17 18 19 20 21 22 23 24 25 26 27 28 29 30 31 32 33 34 35 36 37 38 39 40 41 42 43 44 45 46 47 48 49 50 51 52
For Peer Review
4.2. Stratigraphy and sedimentologyGeneral core description 4.1. General core description
Visual and X-ray examination of core Ni5-8 revealed diffuse, dark yellowish brown layers (Munsell color scale = 10YR 4/6) and dark gray ~0.5 cm thick layers (10YR 4/1) in the upper part of the core. A notable perturbation in sedimentary structures (very diffuse layer boundaries) was found in the middle part of the core (~17 to 47 cm). The lower part (60 to 90 cm) is also characterized by several black diffuse layers (~2 mm to 5 mm). Neither discontinuities nor erosion surfaces were observed in thin sections and X-radiographies.
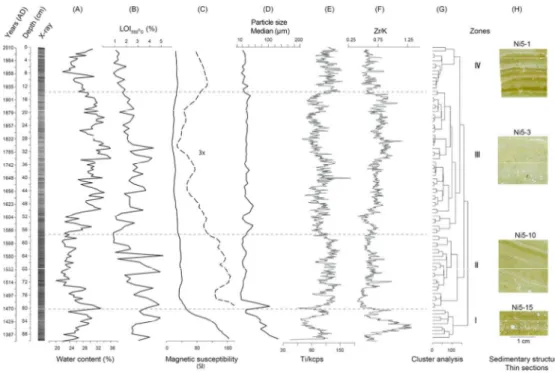
The lithostratigraphy of core Ni5-8 was divided into 4 zones of distinctive
sedimentological and geochemical features. Profiles of the sedimentological
characteristics within these zones are shown in Figure 5, and are described below,
starting with the bottom of the core.
Zone I (90 - 78.9 cm)
The OM in this zone varies from 1.5 to 4 %, with a mean of 2.6 % (Figure 5B).
Magnetic susceptibility is at its maximum (234 x 10-5 SI) near the bottom of the core,
and decreases upwards through the zone to reach 38 x 10-5 SI (Figure 5C). These high
8 9 10 11 12 13 14 15 16 17 18 19 20 21 22 23 24 25 26 27 28 29 30 31 32 33 34 35 36 37 38 39 40 41 42 43 44 45 46 47 48 49 50 51 52
For Peer Review
values are coupled to relatively coarse particle sizes, and the presence of abundant
large grains (250-1000 µm) of feldspar and quartz found sporadically in the finer
matrix. These particles are presumed to be transported by wind and deposited on the
lake ice-cover during winter, and we refer to them as niveo-aeolian grains (Figure
5H). The sedimentary matrix in zone I is mainly composed of medium silt to fine
sand (> 60 % between 30–130 µm) (Figure 5D). The median grain size decreases
upward through the zone from 130 µm to 18 µm. The grain size distribution is poorly
sorted (index of 3.2 to 4.1), but only slightly skewed (-0.9 < skewness < -0.1),
implying that the mean of the distribution is close to its median. Examination of thin
sections did not reveal any remarkable sedimentary structures in this zone, other than
the sporadic presence of niveo-aeolian grains (Figure 5H).
[insert Figure 5.]
Zone II (78.9 - 57.9 cm)
The relatively high sediment density in this zone, which shows as dark gray shades
on the X-radiography, is linked to relatively low water content, decreasing upwards
from ~30 to 20 % (Figure 5A). Magnetic susceptibility and OM content also decrease
upwards (Figures 5B-C). The transition from zone I to II is clearly distinct in the
particle size distribution and magnetic susceptibility graphs (Figures 5C-D). The
8 9 10 11 12 13 14 15 16 17 18 19 20 21 22 23 24 25 26 27 28 29 30 31 32 33 34 35 36 37 38 39 40 41 42 43 44 45 46 47 48 49 50 51 52
For Peer Review
grain size distribution shifts towards a median of ~35 µm, while the mean grain size
varies between 22 and 45 µm (silt > 75 %). Except for one sample at 76 cm, the
particle size distribution is symmetrical (-0.2 ≤ skewness ≤ 0.8) and moderately
sorted (index ~2). Diffuse layers are observed in thin sections, as well as an important
decrease in the number of niveo-aeolian grains relative to zone I (Figure 5H). The
estimated mean sedimentation rate in zone II is 0.23 cm a-1 (Figure 4).
Zone III (57.9 - 14.6 cm)
The X-radiography for this zone suggests a low sediment density relative to zones I
and II, which also corresponds with a higher water content (27 - 45 %) (Figure 5A).
The grain size distribution in the lower part of the zone (47-58 cm) is variable
(median between 20-54 µm) and the sedimentation rate relatively high (0.26 cm a-1),
whereas the grain size distribution is more constant from 47 to 14.6 cm (median from
26-38 µm) and the sedimentation rate is lower (0.10 g cm-2 a-1) than in underlying
sediments (Figure 4). Sorting is similar to that in zone II, the index varying from 1.9
to 2.7. Apart from sporadic niveo-aeolian grains, the main distinguishing structural
feature of zone III is the notable presence of in-situ perturbation features (distorted
layers) observed in the thin sections (Figure 5H).
8 9 10 11 12 13 14 15 16 17 18 19 20 21 22 23 24 25 26 27 28 29 30 31 32 33 34 35 36 37 38 39 40 41 42 43 44 45 46 47 48 49 50 51 52
For Peer Review
Zone IV (14.6 - 0 cm)The OM content in zone IV decreases upward from 1.1 to 0.04 % (Figure 5B). The
median grain size varies between 20 and 30 µm, which are the smallest median
values in the entire core. Sediment in zone 4 is mainly composed of silt at > 80 %.
Laminations are visible in thin sections, with thickness ranging from 0.3 to 3 mm, but
more commonly between 0.5 and 1.5 mm (Figure 5H). These laminations consist of
alternating finer and coarser silt layers, but the irregular and disturbed nature of
laminae does not allow for an unambiguous classification as varves (i.e., annual
deposits). Furthermore, counting couplets of laminae from the top of the core (2010)
down to the 137Cs peak (1963) only yielded approximately half of the expected total
of 47 years. No niveo-aeolian grains were found in thin sections; however, some fecal
pellets (~0.2 to 0.6 mm) were observed.
4.3. Geochemistry
A total of 27 elements were measured in core Ni5-8. However, only silicon (Si),
potassium (K), calcium (Ca), titanium (Ti), iron (Fe), rubidium (Rb), strontium (Sr)
and zirconium (Zr) are discussed in this paper because other elements presented noisy
profiles near the limits of detection. Coefficients of correlation (R) were computed
8 9 10 11 12 13 14 15 16 17 18 19 20 21 22 23 24 25 26 27 28 29 30 31 32 33 34 35 36 37 38 39 40 41 42 43 44 45 46 47 48 49 50 51 52
For Peer Review
between down-core variations in these elements in order to identify significant
geochemical associations between them (Table 2). Strong positive correlations were
found between Si, Ti, K, Ca and Sr (0.73 ≤ R ≤ 0.91, p-value = < 0.01, α = 0.05).
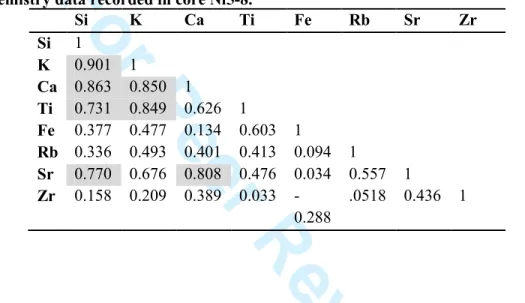
Table 2. Correlation coefficients (R) calculated for linear regressions between geochemistry data recorded in core Ni5-8.
Si K Ca Ti Fe Rb Sr Zr Si 1 K 0.901 1 Ca 0.863 0.850 1 Ti 0.731 0.849 0.626 1 Fe 0.377 0.477 0.134 0.603 1 Rb 0.336 0.493 0.401 0.413 0.094 1 Sr 0.770 0.676 0.808 0.476 0.034 0.557 1 Zr 0.158 0.209 0.389 0.033 -0.288 .0518 0.436 1
In view of the dominant lithologies in the eastern part of the Nettilling Lake
watershed (granites and gneisses), we consider that these 5 elements are good
indicators of detrital inputs into the lake.
The Si/Ti ratio is commonly used as a proxy for biogenic silica (Rothwell and Rack,
2006). However, considering the high correlation between Ti and Si (R = 0.73,
p-value = < 0.01) in core Ni5-8, the predominantly crystalline bedrock geology of the
8 9 10 11 12 13 14 15 16 17 18 19 20 21 22 23 24 25 26 27 28 29 30 31 32 33 34 35 36 37 38 39 40 41 42 43 44 45 46 47 48 49 50 51 52
For Peer Review
region, and the low amount of biogenic silica (see section 4.4 below) to significantly
influence the Si/Ti ratio in the sediments, we suggest it is more likely that Si
concentrations in Nettilling core Ni5-8 are controlled by inorganic silica inputs.
Variations in the Zr/K ratio (Figure 5F) in the core follow those in the particle size
profile. Generally, Zr is associated with weathering-resistant, coarse mineral particles
such as zircon ( ZrO2), and K with less resistant, and therefore usually finer particles
(feldspars and clay minerals), thus the Zr/K ratio is a good proxy for relative particle
size (Cuven et al., 2010), which is confirmed by the particle size distribution (Figure
5D).
4.4. Diatom stratigraphy
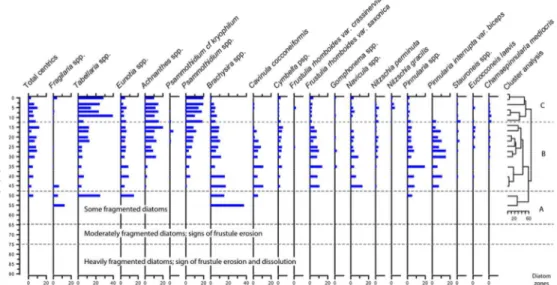
The biostratigraphy of core Ni5-8 was divided into 3 zones of distinctive limnological
features. These zones are shown in Figure 6, and are described below, starting with
the bottom of the core.
Diatoms below 65 cm in core Ni5-8 are found in extremely low concentration and
they are highly fragmented, presenting signs of erosion and dissolution (Figure 6).
8 9 10 11 12 13 14 15 16 17 18 19 20 21 22 23 24 25 26 27 28 29 30 31 32 33 34 35 36 37 38 39 40 41 42 43 44 45 46 47 48 49 50 51 52
For Peer Review
Few fragments could be identified as taxa belonging to the freshwater genera Eunotia
spp., Pinnularia spp., Frustulia spp., Aulacoseira spp. and Tabellaria spp..
In zone A, from 65 cm to 47.5 cm depth, diatoms are still found at low concentration,
but are less fragmented and eroded than below. Most taxa that could be identified
belong to the freshwater genera Fragilaria, Tabellaria, Eunotia, Brachysira and
Pinnularia. Diatoms appear to be better preserved in zone B, starting at 47 cm depth or ~1625 AD. The concentration of diatoms varies from 0 to 30.31 x 10⁵ valves g-1
dry sediment. Of a total of 158 different taxa identified in core Ni5-8, only 83 have
relative abundances > 1 %, and 41 have abundances > 2 %. The latter represent at
least 79 % of the diatoms identified in each sample. Most benthic diatoms identified
in this zone belong to the genera Eunotia, Brachysira, Cavinula, Frustulia and
Pinnularia, which are typically associated with circumneutral to slightly acidic and low-electrolyte waters, as well as with dystrophic bog environments (Krammer and
Lange-Bertalot, 1986, 1991a, b; Fallu et al., 2000; Pienitz, 2001; Antoniades et al.,
2008). Zone C (after ~1911 AD) is characterized by a decrease in taxa belonging to
these genera, and concurrent with increases in Psammothidium spp. and Tabellaria
flocculosa. [insert Figure 6.] 8 9 10 11 12 13 14 15 16 17 18 19 20 21 22 23 24 25 26 27 28 29 30 31 32 33 34 35 36 37 38 39 40 41 42 43 44 45 46 47 48 49 50 51 52
For Peer Review
5. Discussion5.1. Nettilling Lake palaeoenvironments
Zone I (Early LIA: mid-14th century to mid/late 15th century)
The characteristics of the lowermost zone I in core Ni5-8 suggest that sedimentary
processes in Nettilling Lake during the 14th and 15th centuries were completely
different from those that prevailed later. Compared to the other three zones, the
relatively coarse particle size, and the abundance of niveo-aeolian grains are
indicative of sediment inputs from proximal sources. Considering the low catchment
topography, it is plausible that the drainage network feeding into Nettilling Lake was
different than at the present. A possible greater inflow of water draining the carbonate
terrain in zone 1, relative to zone 2, is plausible, although speculative, We speculate that prior to the late 15th century, the dominant inflow to Nettilling Lake originated from Amadjuak Lake located to the South, which drains limestone terrain. This will have likely raised the the pH of lake waters to above 7, which could and could
explain the poor diatom frustule preservation prior to the mid/late 16th century, an
observation often reported from alkaline Arctic lake sediments (Flower, 1993; Ryves
et al., 2009). 8 9 10 11 12 13 14 15 16 17 18 19 20 21 22 23 24 25 26 27 28 29 30 31 32 33 34 35 36 37 38 39 40 41 42 43 44 45 46 47 48 49 50 51 52
For Peer Review
Zone II (Warm phase of LIA: mid/late 15th century to mid/late 16th century) The relatively high mean sedimentation rate (0.23 cm a-1) and the presence of
laminations throughout this zone are characteristics usually associated with mild
warmer climatic conditions in Arctic lake sediment records (Hughen et al., 2000;
Moore et al., 2001; Lamoureux and Gilbert, 2004). Some changes in sediment
transfer could have occuredoccurred in the Isurtuq river between zone I and II, such that discharge of silty sediment in the bay where the cores were obtained increased, thereby reducing the mean grain size (in zone II). Thomas and Briner (2009) provide
evidence for a warming period during the LIA that lasted from 1375 to 1575 AD in
varved sediments from Big Round Lake (northeastern Baffin Island) (Figure 7). We
postulate that during this milder warmer interval, the rate of glacial meltwater
discharge from Penny Ice Cap into the Isurtuq River increased substantially, and this
is indirectly supported by glaciological evidence (see section 5.2). Once the sediment storage capacity along the Isurtuq River was exceeded, until a threshold was reached at which downstream sediment transport was no longer impeded by the proglacial delta located at 30 km distance from the ice cap. At this point, the inflow of silty
glacial meltwaters into Nettilling Lake via the Isurtuq River would have increased
8 9 10 11 12 13 14 15 16 17 18 19 20 21 22 23 24 25 26 27 28 29 30 31 32 33 34 35 36 37 38 39 40 41 42 43 44 45 46 47 48 49 50 51 52
For Peer Review
significantly. However, this new inflow apparently did not lower lake water pH
sufficiently to allow for good diatom frustule preservation.
[insert Figure 7.].
Zone III (Late cold phase of LIA: mid/late 16th century to early 20th century) Sediment laminations rendered visible through X-radiographs in this part of the core
are not recognizable in thin-sections. This may be due to some bioturbation, coupled
with decreasing sedimentation rates after ~1600 AD (Figure 4). With lower
sedimentation rates, water circulation or small benthic organisms can more easily
disturb the water-sediment interface. The abundant niveo-aeolian grains found in
zone III are generally associated with the presence of expanded lake ice cover, high
surface wind velocities and/or reduced snow accumulation in the catchment basin
(Lewis et al., 2002; Lamoureux and Gilbert, 2004). Winds capable of entraining
coarse sediments such as niveo-aeolian grains are usually more frequent during cold
and dry climatic periods. More numerous sand particles can be trapped in cracks
during a longer period when ice is covering the lake; and stronger winds also favor the formation of such lake ice cracks (Vologina et al. 2005). Lamoureux and Gilbert
(2004) observed a relative increase in the abundance of coarse grains between
1350-1750 AD in the sedimentary record from Bear Lake (Devon Island). These
8 9 10 11 12 13 14 15 16 17 18 19 20 21 22 23 24 25 26 27 28 29 30 31 32 33 34 35 36 37 38 39 40 41 42 43 44 45 46 47 48 49 50 51 52
For Peer Review
considerations suggest that zone III in the Nettilling Lake Ni5-8 record is associated
with a period of relatively cool, dry and windy climatic conditions, which may
correspond to the coldest phase of the LIA. Sedimentary, palaeolimnological and
glaciological records indicate that in the eastern Canadian Arctic, the LIA spanned an
extended period between the 13th and 19th centuries (Grumet et al., 2001; Moore et
al., 2001; Briner et al., 2009; Kaufman et al., 2009; Rolland et al., 2009; Thomas and Briner, 2009; Miller et al., 2012). Moreover, compiled lichenometric ages and
radiocarbon dates on fossil vegetation exhumed from beneath Canadian Arctic ice
caps bracket several late Neoglacial episodes of ice cap expansion on southern Baffin
Island, the latest and most extensive beginning ca. 1500 AD and ending in the mid- to
late 19th century (Miller et al., 2012; Margreth et al., 2014). We suggest that zone III
in core Ni5-8 represents sedimentation during part of this latest interval, which was
also characterized by reduced inputs of glacial meltwater into Nettilling Lake,
presumably owing to colder conditions and reduced summer snow/ice melt (see also
section 5.2 below). This could also explains the apparent increase in LOI in zone III.
In fact, LOI might not be increasing, it is probably, which mayjust the result fromof lower inputs of detrital sediment due to colder conditions and less reduced meltwater inputs. We further postulate that by that time, the pH in Lake Nettilling water had
8 9 10 11 12 13 14 15 16 17 18 19 20 21 22 23 24 25 26 27 28 29 30 31 32 33 34 35 36 37 38 39 40 41 42 43 44 45 46 47 48 49 50 51 52
For Peer Review
dropped below 7, allowing the preservation of diatoms in the sediments. The greater
diatom diversity during this period (Figure 6) likely resulted from reduced water
turbidity, greater water column transparency and stability, and hence deeper light
penetration during the short summer ice-free period in the lake and the Isurtuq River.
The diatom accumulation rate might not be highest during Zone III, as increased absolute diatom abundance values during this zone may be a function of reduced sediment inputs (as reflected by higher LOI). The diatom assemblage found in this
zone is mostly composed of benthic circumneutral to acidophilic taxa (e.g.,
Brachysira procera, Cavinula cocconeiformis, Frustulia saxonica and Pinnularia spp.) that are usually found in wetlands rich in Sphagnum moss habitats (Krammer
and Lange-Bertalot, 1986, 1991a, b; Fallu et al., 2000; Pienitz, 2001; Antoniades et
al., 2008). Thus, their abundance could reflect the presence of extensive moss mats
that may have covered the banks of the Isurtuq River at a time of reduced inflow
(Figure 2).
Zone IV (after the early 20th century)
The abrupt transition from zones III to IV in core Ni5-8 indicates that conditions in
Nettilling Lake changed markedly in the early 20th century. These changes are
reflected in many sediment properties such as grain size, magnetic susceptibility and
8 9 10 11 12 13 14 15 16 17 18 19 20 21 22 23 24 25 26 27 28 29 30 31 32 33 34 35 36 37 38 39 40 41 42 43 44 45 46 47 48 49 50 51 52
For Peer Review
diatom assemblage composition (Figures 5-6). The mean sedimentation rate in the lake had apparently increased earlier, possibly as early as the mid-19th century (Figure 4). This timing agrees well with the inferred termination of the LIA as documented in other regional proxy records (Rolland et al., 2009; Margreth et al., 2014). Rising temperatures would have caused increased seasonal snow and ice melt rates and detrital sediment delivery into the lake (see also section 5.2 below). Positive
correlations between air temperature and sedimentation rates have been documented
in several Canadian Arctic lakes (Hughen et al., 2000; Moore et al., 2001; Lamoureux
and Gilbert, 2004). Rapid sedimentation flux reduces the potential for bioturbation
and may explain the better preservation of laminated sediment structures in the upper
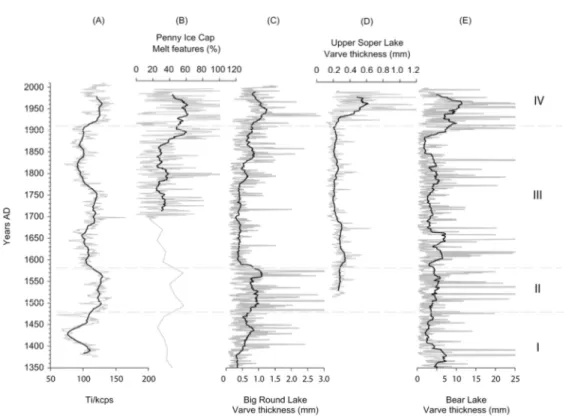
part of the Nettilling Lake core Ni5-8. It is also noteworthy that the increase in Ti
concentration in the core in the early 20th century coincides, within possible dating
errors, with a marked increase in the thickness of varves in the sediment records of
Upper Soper Lake (southern Baffin Island; Hughen et al., 2000), Bear Lake (Devon
Island; Lamoureux and Gilbert, 2004) and Big Round Lake (eastern Baffin Island;
Thomas and Briner, 2009) reflecting a rise in regional air temperatures (Figure 6).
The changes observed in floral composition in core Ni5-8 closely mirror those
displayed in the sedimentological and geochemical proxies. More competitive genera,
8 9 10 11 12 13 14 15 16 17 18 19 20 21 22 23 24 25 26 27 28 29 30 31 32 33 34 35 36 37 38 39 40 41 42 43 44 45 46 47 48 49 50 51 52
For Peer Review
such as Tabellaria, Achnanthes and Psammothidium, progressively replaced the
benthic acidophilic taxa found before the 20th century, probably due to reduced light
penetration in Nettilling Lake as silty meltwater inflows from Penny Ice Cap
increased via the Isurtuq River.
5.2. Comparison with the Penny Ice Cap summer melt record
To further investigate the hydrological connection between sedimentation in eastern
Nettilling Lake and glacial melt rates on southern Baffin Island, we compared the
profile of Ti abundance obtained from core Ni5-8 with a proxy record of past summer
warmth developed from ice cores drilled at the summit of Penny Ice Cap (67.25 ° N,
65.77 ° W, ~1860 m a.s.l.) in 1995 and 2010 (Grumet et al., 2001; Fisher et al., 2011; Zdanowicz et al., 2012). The proxy used is the volumetric percentage of ‘’melt features’’ (MF %) in the cores, which are distinct, bubble-poor layers or lenses of ice formed by the refreezing of surface meltwater into underlying firn. Koerner (1977) first established that the relative abundance of these features is correlated to past summer warmth conditions. The composite MF record developed from Penny Ice Cap cores covers the period 1695 to 1992 AD at 5 to 10-year resolution, and extends to ~3300 years ago, but with a 25-year resolution only. For the period considered in this paper,
8 9 10 11 12 13 14 15 16 17 18 19 20 21 22 23 24 25 26 27 28 29 30 31 32 33 34 35 36 37 38 39 40 41 42 43 44 45 46 47 48 49 50 51 52
For Peer Review
i.e. the past 6 centuries, the possible dating error in the Penny Ice Cap chronology is estimated to be < 10 % of true age (Zdanowicz et al., 2012).
To facilitate comparison of multi-decadal trends, the time series of Ti abundance in
core Ni5-8 and the Penny Ice Cap MF record were both smoothed with a 30-year
running mean. This was done in part to mitigate the possible time-averaging effect of
deep water percolation on the Penny Ice Cap MF % record, which may result in the
apparent age of MF variations in this record being earlier (younger) than the variations in summer warmth that caused them. Given that the summit of Penny Ice
Cap, where the MF% record was developed, is situated more than 1830 m above the
Nettilling Lake basin (~ 30 m asl.), some altitude-dependent time lag may also be
expected between the responses of the ice cap summit and the lake to regional
temperature changes.
The smoothed time series of Ti content in Nettilling Lake core Ni5-8 and of MF% on
Penny Ice Cap were found to correlate positively over the common interval
1695-1992 AD (R = 0.45, p-value = 0.0579; α = 0.05), with the strength of the correlation
increasing after the mid-19th century (R = 0.63, p-value = 0.011; Figures 7, A-B). The
earlier part of the Penny Ice Cap MF%, although with a limited 25-year resolution,
also shows a general agreement with the pattern of variations seen in the Nettilling
8 9 10 11 12 13 14 15 16 17 18 19 20 21 22 23 24 25 26 27 28 29 30 31 32 33 34 35 36 37 38 39 40 41 42 43 44 45 46 47 48 49 50 51 52
For Peer Review
Lake Ti record from mid-14th century to late 17th century. The good correspondence
between these two records supports our hypothesis that changes in Ti concentrations
in sediments of eastern Nettilling Lake are modulated, on multi-decadal to secular
time scales, by the supply of silty glacial meltwater from Penny Ice Cap via the
Isurtuq River. During colder periods associated with reduced summer Penny Ice Cap
melt rates, the supply of fine glacigenic sediments to the lake is presumably reduced,
whereas during periods of increased summer melt rates the supply of these sediments
to the lake increases.
Some secular changes in melt rates of Penny Ice Cap appear to be offset by a few
decades relative to the presumed corresponding changes in Ti abundance in core
Ni5-8. For example, the initial rise in MF% of Penny Ice Cap at the end of the LIA
occurred between ~1860 and 1890 AD, whereas Ti concentrations in eastern
Nettilling Lake sediments increased later, on or after 1900 AD. The mismatch could
be due to age model inaccuracies in one or the other (or both) records (see Figure 4).
It could also imply that melt rates on Penny Ice Cap must exceed some threshold for a
sedimentological response to be registered in the Nettilling Lake sediment record.
This threshold might conceivably vary over time as a function of the channel
8 9 10 11 12 13 14 15 16 17 18 19 20 21 22 23 24 25 26 27 28 29 30 31 32 33 34 35 36 37 38 39 40 41 42 43 44 45 46 47 48 49 50 51 52
For Peer Review
morphology, sediment storage capacity, and drainage configuration of the Isurtuq
River, as discussed earlier.
6. Summary and conclusions
Using multiple proxies, we developed a ~600-year long, high-resolution palaeoenvironmental record from a sediment core taken in Nettilling Lake on Baffin Island, at the centre of a vast and remote understudied region of the Canadian Arctic Archipelago. We used an unconventional approach in palaeolimnology to establish the core chronology by combining radiometric (137Cs) and palaeomagnetic dating techniques, which allowed us to date the bottom of the 90-cm long core to the mid 14th century. This finding implies a relatively high mean sedimentation rate (~0.15
cm a-1) for an Arctic lake.
Our sedimentary record from Nettilling Lake spans most of the LIA cold interval (mid-13th to 19th centuries). It contains evidence for at least two episodes of colder and drier conditions during this period (mid-14th century to mid/late 15th century and mid/late 16th century to early 20th century), with somewhat milder warmer conditions in between. The second cool interval is presumed to correspond with the coldest
8 9 10 11 12 13 14 15 16 17 18 19 20 21 22 23 24 25 26 27 28 29 30 31 32 33 34 35 36 37 38 39 40 41 42 43 44 45 46 47 48 49 50 51 52
For Peer Review
phase of the LIA in this region. At the turn of the 20th century, major shifts observed in all proxies were interpreted as reflecting the impact of recent climate warming in this region. At the same time, we noticed a shift towards more clearly defined sediment laminations, decreasing particle size, as well as important changes in diatom community composition.
Down-core variations of Ti in the sediments were compared with independent reconstructions of regional summer temperatures derived from ice core and varved lake sediment records from Baffin Island. These comparisons revealed significant positive correlations, thereby emphasizing the usefulness of combining geochemical and biostratigraphic proxies in palaeolimnological studies. Further research on the Nettilling Lake sediment archive promises to yield more detailed insights into the climatic and environmental history of this poorly known region of the Canadian Arctic.
7. Acknowledgements
This study was made possible through grants from the Natural Sciences and Engineering Research Council (NSERC) of Canada to R. Pienitz and from the Network of Centres of Excellence ArcticNet. The Polar Continental Shelf Program
8 9 10 11 12 13 14 15 16 17 18 19 20 21 22 23 24 25 26 27 28 29 30 31 32 33 34 35 36 37 38 39 40 41 42 43 44 45 46 47 48 49 50 51 52
For Peer Review
(PCSP), the Northern Studies Training Program (NSTP) and Centre d’Études Nordiques (CEN) provided logistic support for the fieldwork at Nettilling Lake. Implementation of the IAAFT algorithm for estimating age model errors was facilitated by using MATLAB codes developed and made available by A. Leontitsis and V. Venema.We would like to thank GH Miller and an anonymous reviewer for their insightful comments on an earlier version of the manuscript.
8 9 10 11 12 13 14 15 16 17 18 19 20 21 22 23 24 25 26 27 28 29 30 31 32 33 34 35 36 37 38 39 40 41 42 43 44 45 46 47 48 49 50 51 52
For Peer Review
The freshwater floras of Prince Patrick, Ellef Ringes, and Northern Ellesmere Islands from the Canadian Arctic Archipelago. In Lange-Bertalot, H. (ed), Iconographia Diatomologica vol.17, A.R.G. Gantner Verlag K.G.: 649 p.
Antoniades D, Francus P, Pienitz R, St-Onge G, Vincent WF (2011) Holocene dynamics of the Arctic’s largest ice shelf. Proceedings of the National Academy of Sciences of
the United States of America 108 (47): 18899–18904. DOI:
10.1073/pnas.1106378108.
Appleby P (2001) Chronostratigraphic techniques in recent sediments. In: Last WM and Smol JP (eds) Tracking Environmental Change Using Lake Sediments: Basin
Analysis, Coring and Chronological Techniques. Development in
Palaeoenvironmental Research (DPER). Springer, pp.171-203.
Axford Y, Briner JP, Cooke CA, Francis DR, Michelutti N, Miller GH, Smol JP, Thomas EK, Wilson CR, Wolfe AP (2009) Recent changes in a remote Arctic lake are unique within the past 200,000 years. Proceedings of the National Academy of Sciences 106 (44): 18443-18446.
Barletta F, St-Onge G, Channell JET, Rochon A (2010a) Dating of Holocene western Canadian Arctic sediments by matching palaeomagnetic secular variation to a geomagnetic field model. Quaternary Science Reviews 29: 2315–2324.
Barletta F, St-Onge G, Stoner SJ, Lajeunesse P, Locat J (2010b) A high-resolution Holocene palaeomagnetic secular variation and relative palaeointensity stack from Eastern Canada. Earth and Planetary Science Letters 298: 162–174.
Battarbee R, Jones V, Flower R, Cameron N, Bennion H, Carvalho L, Juggins S (2002) Diatoms. In: Smol J, Birks J, Last W, Bradley R, Alverson K (eds) Tracking Environmental Change Using Lake Sediments: Terrestrial, Algal, and Siliceous Indicators. Development in Palaeoenvironmental Research (DPER). Springer,
pp.155–202.
Birks HJB (2012) Analysis of stratigraphical data. In: Birks HJB, Lotter AF, Juggings S, Smol JP (eds) Tracking Environmental Change Using Lake Sediments: Data handling
and numerical techniques. Development in Palaeoenvironmental Research (DPER).
Springer, pp.355-378. 8 9 10 11 12 13 14 15 16 17 18 19 20 21 22 23 24 25 26 27 28 29 30 31 32 33 34 35 36 37 38 39 40 41 42 43 44 45 46 47 48 49 50 51 52
For Peer Review
Blaauw M and Christen JA (2011) Flexible paleoclimate age-depth models using an autoregressive gamma process. Bayesian Analysis 6: 457-474.
Blott S and Pye K (2001) GRADISTAT: A grain size distribution and statistics package for the analysis of unconsolidated sediments. Earth, Surface, Processes and
Landforms 26 (11): 1237-1228.
Briner JP, Davis TP, Miller GH (2009) Latest Pleistocene and Holocene glaciation of Baffin Island, Arctic Canada : Key patterns and chronologies. Quaternary Science
Reviews 28: 2075-2087.
Cook TL, Bradley RS, Stoner JS, Francus P (2009) Five thousand years of sediment transfer in a high arctic watershed recorded in annually laminated sediments from Lower Murray Lake, Ellesmere Island, Nunavut, Canada. Journal of Paleolimnology 41:77-94.
Croudace IW, Rindby A, Rothwell RG (2006) ITRAX: description and evaluation of a new sediment core scanner. In: Rothwell RG (ed) New ways of looking at sediment
cores and core data. Geological Society of London special Publication, pp.51-63.
Cuven S, Francus P, Lamoureux S (2010) Estimation of grain size variability with micro X-ray fluorescence in laminated lacustrine sediments, Cape Bounty, Canadian High Arctic. Journal of Palaeolimnology 44: 803–817.
Dyke (1979) Glacial and Sea-Level History of Southwestern Cumberland Peninsula, Baffin Island, N.W.T.,Canada. Arctic, Antarctic and Alpine research 11(2): 179-202. Ebisuzaki W (1997) A method to estimate the statistical significance of a correlation
when the data are serially correlated. Journal of Climate 10: 2147–2153.
Everett JT and Fitzharris BB (1998) The Arctic and the Antarctic. The regional impacts of climate change. An assessment of vulnerability. A special report of IPCC working
group II for the Intergovernmental Panel of Climate Change. Cambridge University
Press : 85-103.
Fallu M A, Allaire N, Pienitz R (2000) Freshwater Diatoms from Northern Québec and
Labrador (Canada): Species-Environment Relationships in Lakes of Boreal Forest, Forest-Tundra and Tundra Regions. Cramer, Berlin, 200 p.
8 9 10 11 12 13 14 15 16 17 18 19 20 21 22 23 24 25 26 27 28 29 30 31 32 33 34 35 36 37 38 39 40 41 42 43 44 45 46 47 48 49 50 51 52
For Peer Review
Recent melt rates of Canadian Arctic ice caps are the highest in four millennia. Global
and Planetary Change 84–85: 3–7. DOI:10.1016/j.glopacha.2011.06.005.
Flower R J (1993) Diatom preservation: experiments and observations on dissolution and breakage in modern and fossil material. Hydrobiologia 269 (270): 473-484.
Grumet NS, Wake CP, Mayewski PA, Zielinski GA, Whitlow SI, Koerner RM, Fisher DA, Woollett JM (2001) Variability of sea ice in Baffin Bay over the last millennium.
Climatic Change 49: 129–145.
Heiri O, Lotter A, Lemcke G (2001) Loss on ignition as a method for estimating organic and carbonate content in sediments: reproducibility and comparability of results.
Journal of Palaeolimnology 25: 101-110.
Hodgson DA and Smol JP (2008) High-latitude palaeolimnology. In: Vincent WF and Laybourn-Parry J (eds) Polar lakes and rivers: Limnology of Arctic and Antarctic
Aquatic Ecosystems. Oxford University Press, pp.43-64.
Hughen K, Overpeck J, Anderson R (2000) Recent warming in the 500-year palaeotemperature record from varved sediments, Upper Soper Lake, Baffin Island, Canada. The Holocene 10: 9-19.
Jackson A, Jonkers ART, Walker MR (2000) Four centuries of geomagnetic secular variation from historical records. Philosophical Transaction of Royal Society of
London 358: 957-990.
Jacobs JD and Grondin LD (1988) The Influence of an Arctic Large-Lakes System on Mesoclimate in South-Central Baffin Island, NWY, Canada. Arctic and Alpine
Research 20 (2): 212-219.
Jacobs JD, Headley AN, Wang H (1993) Climate Autostation Operations at Remote Integrated Studies Sites in Baffin Island, NWT 1987 – 1992. Canadian Climate
Centre Report No. 93-4. Atmospheric Environment Service, Downsview, Ontario, 44
pp.
Jacobs JD, Headley AN, Maus LA, Mode WN, Simms ÉL (1997) Climate and Vegetation of the Interior Lowlands of Southern Baffin Island: Long-term Stability at the Low Arctic Limit. Arctic 50(2): 167-177.
8 9 10 11 12 13 14 15 16 17 18 19 20 21 22 23 24 25 26 27 28 29 30 31 32 33 34 35 36 37 38 39 40 41 42 43 44 45 46 47 48 49 50 51 52