Preliminary analysis of Martian nightglow and aurora observed by MAVEN's Imaging Ultraviolet Spectro-graph. A. Stiepen1, A.I.F. Stewart1, S.K. Jain1, N.M. Schneider1, J.Deighan1, J.S. Evans2, M.H. Stevens3, F. Mont-messin4, M.H. Chaffin1, W.E. McClintock1, J.T. Clarke5, G.M. Holsclaw1, and B.M. Jakosky1
1Laboratory for Atmospheric and Space Physics, University of Colorado, 3665 Discovery Dr., Boulder, CO 80303, arnaud.stiepen@lasp.colorado.edu, 2Computational Physics, Inc., 3Space Science Division, Naval Research Labora-tory, 4LATMOS/IPSL, Guyancourt, France, 5Center for Space Physics, Boston University, Boston, MA, USA,
Abstract: We report the detection of widely dis-tributed nightside emissions from nitric oxide nightglow and auroral emissions on Mars. The obser-vations were made with the Imaging Ultraviolet Spectrograph (IUVS), a remote sensing instrument on the Mars Atmosphere and Volatile EvolutioN (MAVEN) spacecraft. Both emissions have been detected by the SPICAM UV spectrograph on the Mars Express mission. Key differences between the SPICAM and IUVS observations and results include: • IUVS observations were obtained as limb scans,
allonging multiple vertical profiles to be ob-tained each periapse pass
• IUVS observations detected nightglow and auro-ral emissions with greater tempoauro-ral frequency
and spatial coverage, sometimes up to hundreds of kilometers
• The IUVS instrument is also capable of mapping the emissions in two dimensions in nadir view-ing
• MAVEN carries a suite of fields-and-particle instruments capable of probing the precipitating particle population and magnetic field environ-ment.
Over the course of MAVEN’s mission, finding the distribution of auroral emission relative to crustal magnetic fields will be a high priority. Similarly, mapping the NO emission as a tracer of seasonal-lydependent day-to-night global circulation will help constrain global circulation models of the atmos-phere.
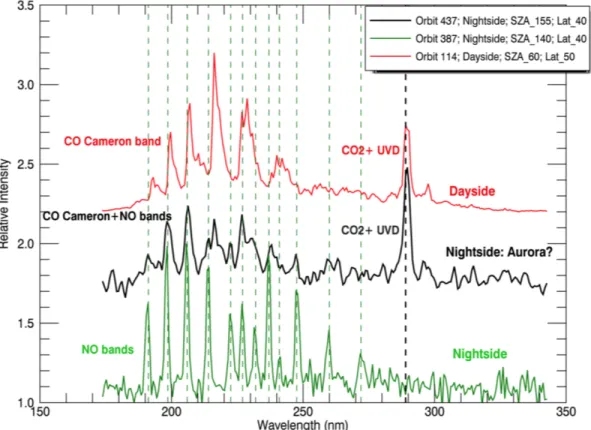
Figure 1. The top spectrum shows Mars dayside exhibiting the well-observed Cameron bands and UV Doublet. The bottom spectrum shows the nightside nitric oxide emissions, with positions noted by green dotted lines. In between is a mix between the two, though the “dayside” emissions are appearing at solar zenith angles over 150 degrees. The day/night change in the spectral shape is presumably due to differences in the auroral excitation mechanism.
2937.pdf 46th Lunar and Planetary Science Conference (2015)
2937.pdf 46th Lunar and Planetary Science Conference (2015)