Development of a GIS-Based Method for Sensor
Network Deployment and Coverage Optimization
Thèse
Meysam Argany
Doctorat en sciences géomatiques
Philosophiae doctor (Ph.D.)
Québec, Canada
©
Meysam Argany, 2015
iii
Résumé
Au cours des dernières années, les réseaux de capteurs ont été de plus en plus utilisés dans différents contextes d’application allant de la surveillance de l’environnement au suivi des objets en mouvement, au développement des villes intelligentes et aux systèmes de transport intelligent, etc. Un réseau de capteurs est généralement constitué de nombreux dispositifs sans fil déployés dans une région d'intérêt. Une question fondamentale dans un réseau de capteurs est l'optimisation de sa couverture spatiale. La complexité de l'environnement de détection avec la présence de divers obstacles empêche la couverture optimale de plusieurs zones. Par conséquent, la position du capteur affecte la façon dont une région est couverte ainsi que le coût de construction du réseau.
Pour un déploiement efficace d'un réseau de capteurs, plusieurs algorithmes d'optimisation ont été développés et appliqués au cours des dernières années. La plupart de ces algorithmes reposent souvent sur des modèles de capteurs et de réseaux simplifiés. En outre, ils ne considèrent pas certaines informations spatiales de l'environnement comme les modèles numériques de terrain, les infrastructures construites humaines et la présence de divers obstacles dans le processus d'optimisation.
L'objectif global de cette thèse est d'améliorer les processus de déploiement des capteurs en intégrant des informations et des connaissances géospatiales dans les algorithmes d'optimisation. Pour ce faire, trois objectifs spécifiques sont définis. Tout d'abord, un cadre conceptuel est développé pour l'intégration de l'information contextuelle dans les processus de déploiement des réseaux de capteurs. Ensuite, sur la base du cadre proposé, un algorithme d'optimisation sensible au contexte local est développé. L'approche élargie est un algorithme local générique pour le déploiement du capteur qui a la capacité de prendre en considération de l'information spatiale, temporelle et thématique dans différents contextes d'applications. Ensuite, l'analyse de l'évaluation de la précision et de la propagation d'erreurs est effectuée afin de déterminer l'impact de l'exactitude des informations contextuelles sur la méthode d'optimisation du réseau de capteurs proposée. Dans cette thèse, l'information contextuelle a été intégrée aux méthodes d'optimisation locales pour le déploiement de réseaux de capteurs. L'algorithme développé est basé sur le
iv
diagramme de Voronoï pour la modélisation et la représentation de la structure géométrique des réseaux de capteurs. Dans l'approche proposée, les capteurs change leur emplacement en fonction des informations contextuelles locales (l'environnement physique, les informations de réseau et les caractéristiques des capteurs) visant à améliorer la couverture du réseau. La méthode proposée est implémentée dans MATLAB et est testée avec plusieurs jeux de données obtenus à partir des bases de données spatiales de la ville de Québec. Les résultats obtenus à partir de différentes études de cas montrent l'efficacité de notre approche.
v
Abstract
In recent years, sensor networks have been increasingly used for different applications ranging from environmental monitoring, tracking of moving objects, development of smart cities and smart transportation system, etc. A sensor network usually consists of numerous wireless devices deployed in a region of interest. A fundamental issue in a sensor network is the optimization of its spatial coverage. The complexity of the sensing environment with the presence of diverse obstacles results in several uncovered areas. Consequently, sensor placement affects how well a region is covered by sensors as well as the cost for constructing the network. For efficient deployment of a sensor network, several optimization algorithms are developed and applied in recent years. Most of these algorithms often rely on oversimplified sensor and network models. In addition, they do not consider spatial environmental information such as terrain models, human built infrastructures, and the presence of diverse obstacles in the optimization process.
The global objective of this thesis is to improve sensor deployment processes by integrating geospatial information and knowledge in optimization algorithms. To achieve this objective three specific objectives are defined. First, a conceptual framework is developed for the integration of contextual information in sensor network deployment processes. Then, a local context-aware optimization algorithm is developed based on the proposed framework. The extended approach is a generic local algorithm for sensor deployment, which accepts spatial, temporal, and thematic contextual information in different situations. Next, an accuracy assessment and error propagation analysis is conducted to determine the impact of the accuracy of contextual information on the proposed sensor network optimization method.
In this thesis, the contextual information has been integrated in to the local optimization methods for sensor network deployment. The extended algorithm is developed based on point Voronoi diagram in order to represent geometrical structure of sensor networks. In the proposed approach sensors change their location based on local contextual information (physical environment, network information and sensor characteristics) aiming to enhance the network coverage. The proposed method is implemented in MATLAB and tested with
vi
several data sets obtained from Quebec City spatial database. Obtained results from different case studies show the effectiveness of our approach.
vii
Table of Contents
Résumé ... iii
Abstract ... v
Table of Contents ... vii
List of Tables ... xiii
List of Figures ... xv Acronym ... xix Acknowledgments ... xxiii Foreword ... xxv CHAPTER 1 ... 1 Introduction ... 1 1.1 Research Context ... 1 1.2 Problem Statement ... 4 1.2.1 General Problem ... 4 1.2.2 Specific Problems ... 5
1.2.2.1 Problem with the spatial and environmental information integration in deployment process ... 5
1.2.2.2 Problem with the local deployment optimization ... 5
1.2.2.3 Problem with uncertainty in spatial information that is used in sensor deployment process ... 6
1.3 Research Objectives ... 6
1.3.1 General Objectives ... 7
1.3.2 Specific objectives ... 7
1.3.2.1 Defining a framework in order to integrate spatial information in sensor networks deployment algorithms ... 7
1.3.2.2 Developing a local context-aware optimization algorithm for sensor network deployment ... 7
1.3.2.3 To perform data quality assessment and error propagation analysis ... 8
viii
1.5 Methodology ... 9
1.5.1 Phase 1: Literature review ... 9
1.5.2 Phase 2: To define a GIS based context-aware framework for integrating environmental information in sensor network deployment algorithms ... 10
1.5.3 Phase 3: To develop a local geometric structure for network modeling and sensor placement optimization ... 11
1.5.4 Phase 4: Spatial data quality and uncertainty assessments ... 12
1.6 Organization of the Thesis ... 15
1.7 References ... 16
CHAPTER 2 ... 19
Fundamentals of the Geosensor Networks, Deployment, and Optimization ... 19
2.1 Introduction ... 19
2.2 Wireless GeoSensor Networks: An Overview ... 20
2.3 Wireless Sensor Networks Technology ... 22
2.4 Wireless Sensor Networks Problems and Technical Challenges ... 23
2.4.1 Sensor Network Topology ... 23
2.4.2 Network Control and Connectivity ... 24
2.4.3 Data Fusion and Processing in Sensor Networks ... 24
2.4.4 Sensor Network Interface and Data Query ... 25
2.4.5 Real Time Output in Sensor Networks ... 25
2.4.6 Sensor Network Deployment ... 26
2.5 Spatial Modeling Issues in Deployment of Wireless Geosensor Networks ... 27
2.5.1 Sensing models ... 27
2.5.1.1 Variable sensibility ... 28
2.5.1.2 Non-circular sensibility ... 29
2.5.2 Communication models ... 30
2.5.3 Preliminary geometric structures ... 32
2.6 Spatial Coverage in GeoSensor Networks ... 34
2.7 Optimization Algorithms in Geosensor Networks Deployment ... 37
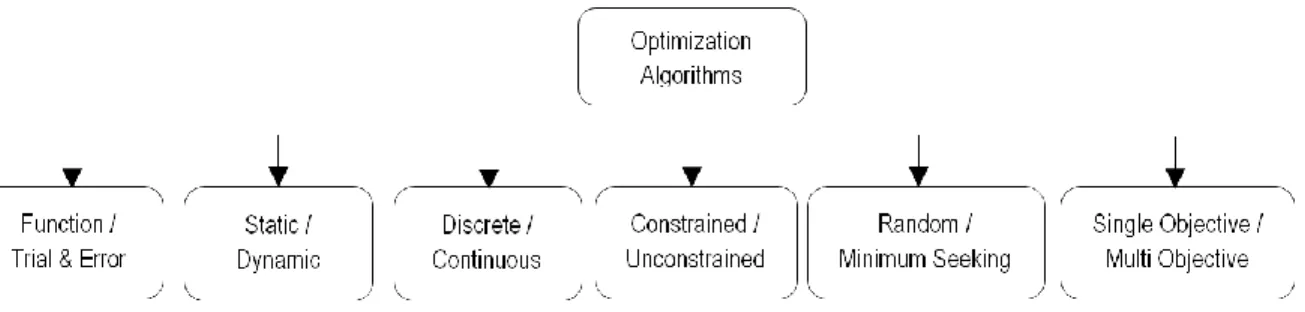
2.7.1 General Concept of Optimization and its Categories ... 38
2.7.2 Global Optimization Approaches in Sensor Network Deployment ... 40
ix
2.8 Conclusion ... 45
2.9 References ... 46
CHAPTER 3 ... 53
A GIS based Wireless sensor network Coverage Estimation and Optimization: A Voronoi approach ... 53
3.1 Abstract ... 53
3.2 Introduction ... 54
3.3 State of the art on Geosensor Networks and their applications ... 55
3.4 Coverage Problem in Geosensor Networks ... 57
3.4.1 Coverage Based on Exposure ... 58
3.4.2 Coverage Based on Mobility ... 60
3.5 Role of Voronoi diagram and Delaunay triangulation ... 61
3.5.1 Coverage Hole Detection ... 61
3.5.2 Healing the Holes ... 63
3.5.2.1 Static Sensor Networks ... 63
3.5.2.2 Mobile Sensor Networks ... 64
3.5.2.3 Hybrid Sensor Networks ... 67
3.5.3 Node Scheduling ... 67
3.5.4 Other Challenges ... 68
3.5.4.1 K-coverage Sensor Networks ... 68
3.5.4.2 Sensor Networks with Various Sensing Ranges ... 68
3.5.4.3 Directional Sensor Networks ... 69
3.5.4.4 Sensor Networks in a 3D Environment ... 69
3.6 Proposed Approach for a Realistic Sensor Network Deployment ... 70
3.7 Implementation of the proposed Approach for Two case Studies ... 73
3.8 Discussion and Conclusions ... 77
3.9 Acknowledgment ... 78
3.10 References ... 78
x
Context-Aware Local Optimization of Sensor Network Deployment ... 83
4.1 Abstract ... 83
4.2 Introduction ... 83
4.3 Optimization Algorithms for Sensor Networks Deployment ... 86
4.4 The Concept of Context in Sensor Networks ... 87
4.5 A conceptual Framework for Sensor Network Deployment Using Voronoi Diagram and Contextual Information ... 89
4.6 Implemented Local Context-Aware Optimization Method for Sensor Placement 94 4.6.1 Formal Presentation of the Local Context-Aware Algorithm ... 94
4.6.2 Strategies for Sensor Movement in the Proposed Local Optimization Algorithm 98 4.6.3 Strategies for CI Integration in the Proposed Local Optimization Algorithm . 100 4.7 Different Case Studies for Evaluation of the Proposed Local Context-Aware Sensor Network Deployment Optimization Algorithm ... 102
4.7.1 Optimization Considering the Obstacles and Surface Model as CI ... 104
4.7.2 Optimization Considering the Restricted Area as CI ... 107
4.7.3 Optimization Considering Desirability of Coverage in a Given Area as CI .... 112
4.7.4 Optimization Considering the Environment Activities as CI ... 116
4.8 Discussions and Conclusions ... 117
4.9 References ... 120
CHAPTER 5 ... 125
Impact of the Quality of Spatial 3D City Models on Sensor Networks Placement Optimization ... 125
5.1 Abstract ... 125
5.2 Introduction ... 126
5.3 Sensor Network Deployment Optimization Based on 3D City Models ... 128
5.3.1 Global optimization approaches ... 130
5.3.2 Local optimization approaches ... 131
xi
5.4 Spatial Data Quality in 3D City Models ... 134
5.5 The Impact of 3D City Models Quality on Sensor Deployment ... 137
5.6 Experimentation and Results ... 142
5.7 Conclusions ... 151
5.8 Acknowledgments ... 152
5.9 References ... 152
CHAPTER 6 ... 155
Conclusion and Perspectives ... 155
6.1 Summary ... 155
6.2 Contributions and Discussions ... 158
6.2.1 Using Voronoi diagram to construct local geometrical structure of the network and environmental elements ... 159
6.2.2 Developing a novel local context-aware optimization algorithm for sensor network deployment ... 159
6.2.3 Investigating the impact of spatial data quality on the sensor network deployment process ... 160
6.3 Research perspectives and future works ... 161
6.4 References ... 163
xiii
List of Tables
Table 3.1: Visibility and coverage before and after optimization ... 76
Table 4.1: Results of Context-Aware and CMA-ES optimization algorithms ... 107
Table 4.2: Impact of increasing the number of sensors on the coverage using context-aware method in case of considering the restricted area (Zone 1 and 2) ... 111
Table 5.1: Initial information on the sensor network used in our experimentation. ... 144
Table 5.2: Results obtained from the CMA-ES method. ... 145
Table 5.3: Results obtained from the SA method. ... 145
Table 5.4: Results obtained from the enhanced VORonoi-based method. ... 145
xv
List of Figures
Figure 1.1: The schema of the research methodology ... 14
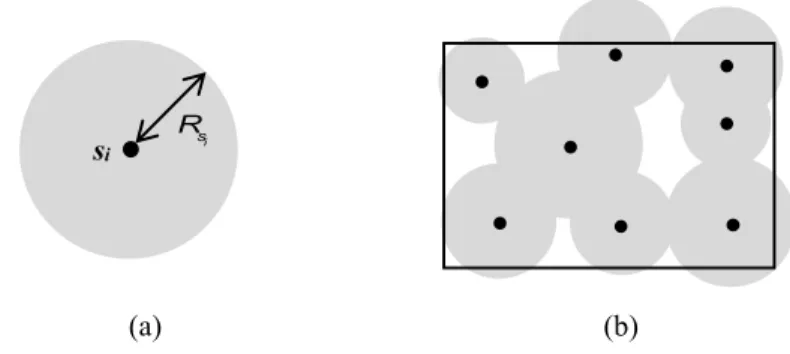
Figure 2.1: Binary disc model of sensing: (a) Only the gray region is covered by the sensor 𝑠𝑖; (b) Modeling the coverage problem of a sensor network using the binary disc model ... 28
Figure 2.2: Attenuation of the sensing capacity with increasing distance to the sensor 𝑠𝑖 .. 28
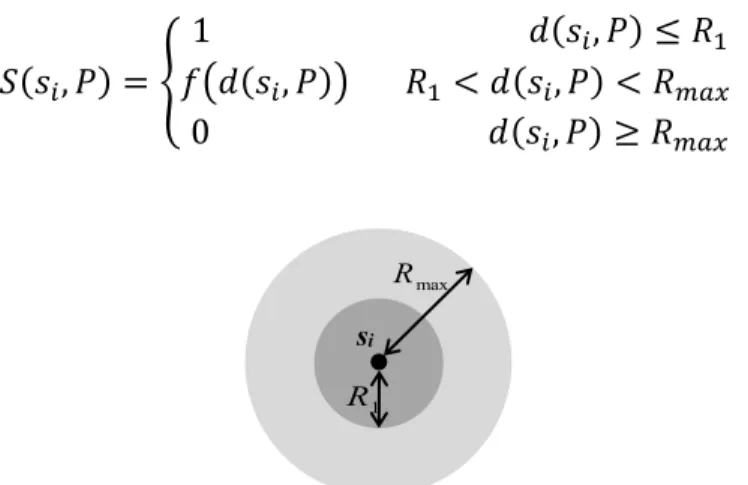
Figure 2.3: Probability sensing model: The dark gray disk is covered; the coverage of the light gray nut is a probability function of distance to 𝑠𝑖; elsewhere is not covered. 29 Figure 2.4: A directional sensor ... 30
Figure 2.5: Binary disc model of communication: (a) The sensor 𝑠𝑖 is able to communicate with the sensors located in the gray region; (b) The sensors si and 𝑠𝑗 can communicate with each other, because the one with the smaller communication range falls in the communication range of the other one. ... 31
Figure 2.6: Basic sensor network topologies ... 32
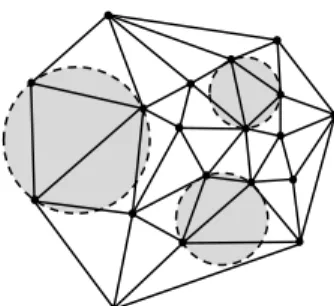
Figure 2.7: 2D Delaunay triangulations; three of the circum-circles are shown ... 33
Figure 2.8: Voronoi diagram of a set of points in the plane ... 33
Figure 2.9: Duality of Delaunay triangulation (solid lines) and Voronoi diagram (dashed lines) ... 34
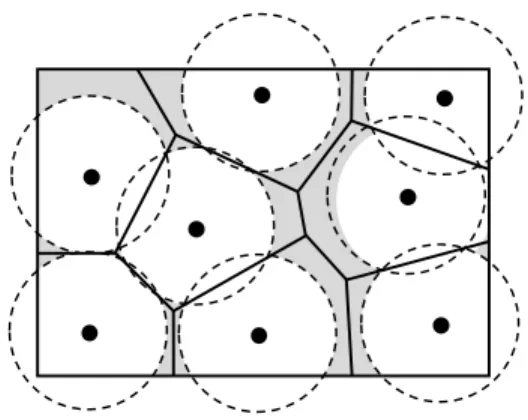
Figure 2.10: Overlaying the Voronoi diagram and sensor sensing regions to detect the coverage holes (shaded regions) in a sensor network ... 35
Figure 2.11: Sensor field with weighted Voronoi diagram and maximal breach path (Meguerdichian et al. 2001) ... 36
Figure 2.12: Sensor field with weighted Delaunay triangulation and maximal support path (Meguerdichian et al. 2001) ... 37
Figure 2.13: Sensor field with maximal breach path (𝑃𝐵) and maximal support path (𝑃𝑆) (Meguerdichian et al. 2001) ... 37
Figure 2.14: Diagram of an optimization process ... 38
Figure 2.15: Categories of optimization algorithms ... 38
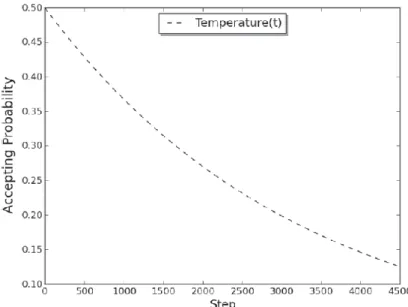
Figure 2.16: The temperature function illustration in the SA method. Here, it is assumed that the maximum number of iterations is 4550 (Akbarzadeh et al. 2013). ... 42
Figure 3.1: Coverage hole (shaded region) in a sensor network with disk model sensing range ... 58
Figure 3.2: Minimum and maximum exposure paths in a simple sensor network (Huang & Tseng 2005)... 59
Figure 3.3: Using Voronoi diagram to detect the coverage holes (shaded regions) in a sensor network ... 62
xvi
Figure 3.4: Maximum breach path in a sensor network and its connection to Voronoi
diagram ... 63
Figure 3.5: Maximum support path in a sensor network and its connection to Delaunay triangulation ... 63
Figure 3.6: Deploying an additional sensor to heal the hole in a static sensor network ... 64
Figure 3.7: An example of using VEC algorithm to move the sensors (Wang et al. 2006) . 65 Figure 3.8: Movement of a sensor in VOR algorithm ... 66
Figure 3.9: An example of using VOR algorithm to move the sensors (Wang et al. 2006) 66 Figure 3.10: Using weighted Voronoi diagram to examine the coverage quality of a sensor network with various sensing ranges ... 69
Figure 3.11: A sensor network in a 3D environment with various obstacles. The superimposed 2D Voronoi diagram cannot determine the network coverage ... 70
Figure 3.12: The proposed framework ... 73
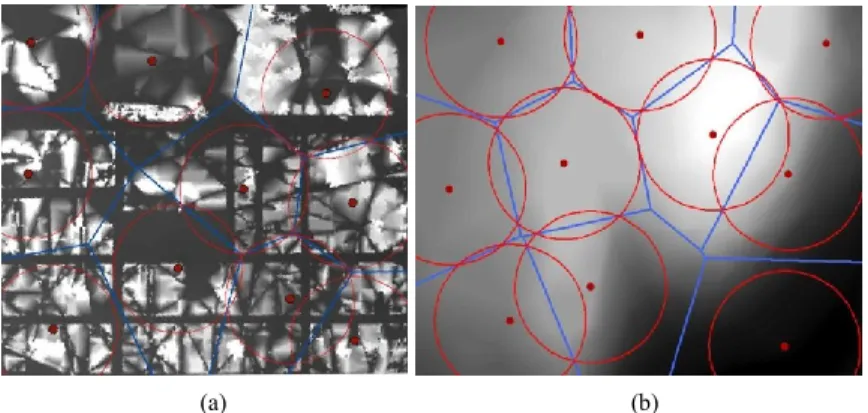
Figure 3.13: The study areas: (a) a small part of Quebec City (urban area) and (b) a small part of Montmorency Forest in Quebec (natural area) ... 74
Figure 3.14: Initial positions of the sensors on the DTM: (a) urban area (b) natural area ... 74
Figure 3.15: Viewshed of the first sensor deployment: (a) urban area (b) natural area. Green regions are visible and red regions are invisible. ... 74
Figure 3.16: Sensor’s positions and their related sensing buffer and Voronoi cells in the initial deployment: (a) urban area (b) natural area ... 75
Figure 3.17: The covered regions in the sensing field of each sensor node in initial deployment: (a) urban area (b) natural area. Green regions are visible and pink regions are invisible. ... 75
Figure 3.18: The covered regions in the sensing field of each sensor node in second deployment (green regions are visible and pink regions are invisible) ... 76
Figure 4.1: Three components of context in sensor network deployment ... 88
Figure 4.2: Context definition for the intelligent sensor deployment for a given time ... 89
Figure 4.3: Context-aware sensor network deployment framework ... 93
Figure 4.4: The pseudo-code of the proposed local context-aware optimization algorithm 96 Figure 4.5: Simplified simulation of one round of the proposed algorithm to deploy five sensors. Red vector represents the move direction of the sensor with best priority to move in each step. ... 97
Figure 4.6: Voronoi diagram for five sensors in a network. Dashed circles represent the sensing area of each sensor; the gray region represents the uncovered area of the Voronoi cell associated to the sensor s. ... 99
Figure 4.7: Moving direction and distance changes during the optimization process, dashed line represents the first step of the optimization, and solid line the second. ... 100
Figure 4.8: The study area of experiments ... 102
Figure 4.9: The initial positions of sensors based on a triangular configuration ... 103 Figure 4.10: Sensor movement simulation of the context-aware optimization algorithm . 105
xvii
Figure 4.11: Coverage improvement over iterations of the context-aware method ... 106 Figure 4.12: Coverage map of deploying 12 sensors using the context-aware method ... 106 Figure 4.13: Sensor’s move representation in case of considering the restricted area.
Searching locations have been limited to lines S1A, and Bv4. ... 108 Figure 4.14: Illegal zones of sensor deployment: the street (Zone 1) and the buildings (Zone
2). ... 108 Figure 4.15: Coverage map of 12 sensors using the local context-aware method,
considering the street (Zone 1) as the restricted area (the red border zone). ... 109 Figure 4.16: Coverage map of deploying 12 sensors using the context-aware method,
considering the buildings (Zone 2) as the restricted area (the red border zones). .. 110 Figure 4.17: Coverage map of deploying 12 sensors using the context-aware method,
considering the street (Zone 1), and buildings (Zone 2) as the restricted area (the red border zones). ... 110 Figure 4.18: Impact of number of sensors on the coverage obtained by the context-aware
method in case of considering the restricted area (Zones 1 and 2). ... 111 Figure 4.19: Coverage map of deploying 35 sensors using the context-aware method,
considering the street (Zone1), and buildings (Zone2) as the restricted area (the red border zones). ... 112 Figure 4.20: Sensor’s move representation in case of considering circular coverage and
desirability coverage at the pink area (street), s1 represents the initial sensor
position, s1 represents the position with highest weight score on the line s1v4. ... 113
Figure 4.21: Simulation of the scoredc on the weight map, followed by finding new sensor
position regarding CI of desirability of coverage. ... 114 Figure 4.22: Coverage map of deploying 12 sensors using the context-aware method,
considering the street (Zone 1) as the desired region to be covered (the red border). ... 115 Figure 4.23: Coverage map of deploying 8 sensors using the context-aware method,
considering the street (Zone 1) as the desired region to be covered (the red border). ... 115 Figure 4.24: Coverage map of deploying 12 sensors using the context-aware method,
considering the activity in the network; Zone 3: the area with low activity, but high interested to be covered ... 117 Figure 5.1: Direct visibility between an observer and a target, point A is visible while point C is invisible because its line-of-sight is concealed at point B. ... 129 Figure 5.2: Movement of a sensor in the VOR algorithm. ... 132 Figure 5.3: Parameters and visibility of sensor si in a 3D model ... 133 Figure 5.4: Impact of positional accuracy on sensor network coverage: (a) small
displacement of three buildings at positions A, B, and C shown on DTM (b) area which will be covered after the displacement shown in light red. ... 138
xviii
Figure 5.5: Impact of completeness on sensor network coverage: (a) elimination of some blocks at positions A, B, and C shown on DTM (b) area which will be covered after elimination shown in light red ... 139 Figure 5.6: The five Levels of Detail in 3D city models (LOD) according to the Open
Geospatial Consortium (Gröger et al. 2012) ... 140 Figure 5.7: The impact of completeness on the line-of-sight; Point B is visible but point A
is invisible because of the presence of balconies in the building representation ... 141 Figure 5.8: Raster versus vector representation of limits of a building; visibility and
line-of-sigh can be computed more accurately using vector model. ... 142 Figure 5.9: Sensor locations in a 3D city model, red points show the assumptive positions
of 8 sensors in the environment and the circles depict their sensing area ... 143 Figure 5.10: (a) Best sensor configuration over a map with 10 cm resolution from
CMA-ES, (b) best sensor configuration over a map with 10 cm resolution from SA, and (c) best sensor configuration over a map with 10 cm resolution from enhanced
VORonoi-based. ... 146 Figure 5.11: Comparison between average coverage obtained from different optimization
methods over different map resolutions and best coverage obtained from different algorithms and map resolutions over ground truth dataset. ... 147 Figure 5.12: Comparison of differences between average coverage values obtained from
original maps and the ground truth for three optimization methods. ... 148 Figure 5.13: Box plot of one-way ANOVA test for different map resolutions for: (a)
xix
Acronym
2D Two-Dimensional
3D Three-Dimensional
ANOVA Analysis of Variance
API Application Programming Interface
CEN European Committee for Standardization (French: Comité Européen
de Normalisation)
CI Contextual Information
CityGML City Geography Markup Language
CMA Covariance Matrix Adaptation
CMA-ES Covariance Matrix Adaptation Evolution Strategy
CRG Center for Research in Geomatics
DRDC Defence Research and Development Canada
DSM Digital Surface Model
DT Delaunay Triangulation
DTM Digital Terrain Model
EA Evolutionary Algorithm
FGDC Federal Geographic Data Committee
GA Genetic Algorithm
GEOIDE GEOmatics for Information Decisions (a Scientific Network)
GIS Geographic Information System
GPS Global Positioning System
GSN GeoSensor Network
IEEE Institute of Electrical and Electronics Engineers
ISO International Organization for Standardization
LOD Level Of Detail
LVSN Computer Vision and Systems Laboratory (French: Laboratoire de Vision et Systèmes Numérique)
MDA MacDonalds, Dettwiler and Associates (a Canadian Aerospace, GIS,
xx
MEMS MicroElectroMechanical Sensor
OGC Open Geospatial Consortium
SA Simulated Annealing
TIN Triangulated Irregular Network
UML Unified Modeling Language
VD Voronoi Diagram
VEC VECtor-based algorithm
VOR VORonoi-based algorithm
xxi
To my family,
And those who are pushing science boundaries…
xxiii
Acknowledgments
No words on paper come close to describing my gratitude to the many people who have been part of this PhD journey over the past five years. I would not be writing these words without their love, support, caring, dedication, belief, and sheer patience.
My doctoral committee; Prof. Mir Abolfazl Mostafavi, my supervisor who helped clinch my decision to choose Université Laval as my launching pad into the PhD world. Had I not met him when I was a master student at University of Tehran, I wouldn’t be writing these lines. He may not remember these words during our very first meetings, but they were predictive. “You will fall in love with your PhD project and never forget our brilliant scientific members at the Center for Research in Geomatics”. He was right, so very right. I thank him for making that spontaneous statement, and for providing countless support and direction when I needed it most. My deepest thanks go to him for the many ways he has supported and encouraged me during my PhD. Prof. Christian Gagné, an incredible scholar, leader, and researcher. I continue to be inspired by his grace, wisdom, and vision for doing research in optimization algorithms and sensor networks. Dr. Benoit Debaque, I will never forget my doctoral exam. I appreciate your directedness and supportive comments. Prof. Eric Guilbert, thank you for accepting to be “pre-lecture” of this thesis and later in the Jury. My great thanks also belong to Prof. Kate Beard, I am proud to have you in my Jury.
The Geomatics Department staff; thanks for smoothing over all my tough moments with your calm and purposeful behavior. Thanks for pushing the Geomatics Sciences, a goal that I continually set for my future work in melding my academic, research, and professional career passions.
The CRG members; what an incredible group! My friends in LVSN; We’ve talked, laughed, cried, enjoyed, played, and shared happy and sad life changes. For me, nothing has the value to replace my country, Iran, but the exceptional environment, which you, all the members of the “Center for Research in Geomatics” and the “Computer Vision and Systems Laboratory of Laval University”, have created, made it possible for me not to have the feeling of being
xxiv
far from my hometown. For this reason, I would proudly say that here is my second hometown. My friends, my colleagues, saying thanks is somehow not enough. Reda Yaagoubi, I never forget your great collaboration and encouragement to prepare the accuracy assessment paper. Farid Karimipour, you had awesome hearty scientific support during the first days of my PhD. How can I appreciate those efforts? Vahab Akbarzadeh, we had such a great moment during the GEOIDE project. Thank you for your clarifications over the computer science concepts.
Oh, my family; who can gratify to your love, your affection, and kindness? My parents, how can I appreciate your spiritual supports? My loving Mom, you never forgot to call me every night. There was no morning I was waiting for your call, to talk to you Dad. Without your encouragement and help I would never have ended up now with a PhD.
Last, but not least, my Love, Narges; who knows the difficulties you passed, thousands of kilometers away during these five years. Words are not able to appreciate your patience. I had not finished this PhD without your inspiration, understanding, encouragement and supports.
xxv
Foreword
This thesis has been prepared as an article insertion thesis and includes three international scientific journal papers and one international conference paper. The author of this thesis, Meysam Argany, is the principle author of these papers. The co-authors are Prof. Mir-Abolfazl Mostafavi, his supervisor, Dr. Christian Gagné, his co-supervisor, Dr. Farid Karimipour, Dr. Reda Yaagoubi, and Mr. Vahab Akbarzadeh. The author’s contribution in these manuscripts was to perform all the experimental work, data preparation and analysis, and to write the first draft versions, which were revised by co-authors through their comments and recommendations before submission.
The papers that were inserted in this thesis are as follows: Journal Papers:
1. Argany, M., Mostafavi, M. A., Karimipour, F., & Gagné, C. (2011). A GIS Based Wireless Sensor Network Coverage Estimation and Optimization: A Voronoi Approach. Transaction on Computational Science XIV, 6970, 151–172.
2. Argany, M., Mostafavi, M.A., Gagné, C. (2014). Context-Aware Local Optimization of Sensor Network Deployment. Journal of Sensor and Actuator Networks (JSAN), Submitted.
3. Argany, M., Mostafavi, M. A., Akbarzadeh, V., Gagne, C., & Yaagoubi, R. (2012). Impact of the Quality of Spatial 3D City Models on Sensor Networks. Geomatica, 66(4), 291–305.
Conference Paper:
4. Argany, M., Mostafavi, M. A., & Karimipour, F. (2010). Voronoi-Based Approaches for Geosensor Networks Coverage Determination and Optimisation: A Survey. In 2010 International Symposium on Voronoi Diagrams in Science and Engineering (pp. 115–123). Ieee. doi:10.1109/ISVD.2010.36
xxvi
The author of this thesis has had also contribution to publish a book chapter, which has been used partially in this thesis as well as a journal paper, which has not been included here. Book Chapter:
5. Karimipour, F., Argany, M., Mostafavi, M.A. (2013) Spatial Coverage Estimation and Optimization in GeoSensor Networks Deployment. Book chapter, Wireless Sensor Networks: From Theory to Applications, Editors: El Emary, I. M. M., Ramakrishnan, S., CRC Press, Taylor and Francis, 59-83.
Journal Paper:
6. Akbarzadeh, V., Gagne, C., Parizeau, M., Argany, M., & Mostafavi, M. A. (2013). Probabilistic Sensing Model for Sensor Placement Optimization Based on Line-of-Sight Coverage. IEEE Transactions on Instrumentation and Measurement, 62(2), 293–303. doi:10.1109/TIM.2012.2214952
1
CHAPTER 1
Introduction
1.1 Research Context
The importance of monitoring, collecting, and distributing location based information on diversed dynamic phenomena has been highlighted in different applications. Sensor networks are widely used for collecting information needed to establish smart environments, smart buildings, utilities, industries, home, shipboard, transportation systems, or elsewhere. Sensor networks are also useful in vehicle traffic monitoring and control. Most traffic intersections have either overhead or buried sensors to detect vehicles and control traffic lights. Furthermore, video cameras are frequently used to monitor road segments with heavy traffic, with the video sent to human operators at central locations (Chong & Kumar 2003). Sensor networks can be used for infrastructure security in critical buildings and facilities, such as power plants and communication centers. Networks of video, acoustic, and other sensors provide early detection of possible threats (Soro & Heinzelman 2005). Commercial industries has long been interested in sensing as a means of lowering cost and improving machine (and perhaps user) performance and maintainability. Monitoring machine “health” through determination of vibration or wear and lubrication levels, and the insertion of sensors into regions inaccessible by humans, are other examples of industrial applications of sensors (Chong & Kumar 2003). A broad classification of sensor network applications may include the monitoring of continuous phenomena (e.g., to assess plant health and growth circumstances, or to observe and measure geophysical processes), detecting of real time events (e.g., flood and volcano), and tracking of mobile objects (e.g., animal monitoring) (Nittel 2009; Szewczyk et al. 2004; Worboys & Duckham 2006).
What is a sensor network? Sensor networks are usually composed of a set of small, smart and low-cost sensors with limited on-board processing capabilities, storage and short-range
2
wireless communication links based on radio technology. Previously, sensor networks consisted of a small number of sensor nodes that were wired to a central processing station. However, nowadays, the focus is more on wireless, distributed, sensing nodes (Worboys & Duckham 2006). A sensor node is characterized by its sensing field, memory and battery power as well as its computation and communication capabilities. A sensor can only cover a small area. However, collaboration of a group of sensors with each other can cover a more significant sensing field and hence accomplish much larger tasks. Each element of a group of sensors can sense and collect data from the environment, apply local processing, communicate data to other sensors and perform aggregations on the observed information (Sharifzadeh & Shahabi 2004). These tiny and ingenious devices are usually deployed in a wireless network for accessing remote and inaccessible areas without a wired communication and often without even power lines. Deploying sensor networks allows coverage of inaccessible areas by minimizing the sensing costs compared to the use of separate sensors. Furthermore, the size reduction of computing and storage platforms has led to low power consumption and has enabled computational platforms that can run on battery power for extended periods of time. In addition, the advances in real-time data input and output fundamentally change data collection and information preparation by sensor networks and make it available for use directly on the web. From the computation capability viewpoint, onboard computing advances including the local data analysis, data filtering and sampling have reduced the data transmission and battery consumption.
Sensor networks are also referred to as Geosensor networks as they are intensively used to acquire spatial information (Nittel 2009). Hereafter, we will use both of the terms “sensors” and “geosensors” interchangeably. Geosensors can be deployed on the ground, in the air, under water, on bodies, in vehicles, and inside buildings.
Despite the advances in the sensor network technology, the efficiency of a sensor network for collection and communication of the information may be constrained by the limitations of sensors deployed in the network nodes. These restrictions may include sensing range, battery power, connection ability, memory, and limited computation capabilities. These limitations create challenging problems for the users of the sensor networks which has pushed researchers from different disciplines in recent years to study various problems
3
related to the design and deployments of efficient sensor networks. Also sensor networks have some limitations in modeling, monitoring, and detecting environmental processes. Environmental elements like obstacles, which exist in both static and dynamic forms, are also important considerations in realistic sensor networks. Other examples of such elements include contextual information of the sensors environment and physical phenomena in the network. It is necessary to know how to use sensor network to detect and consider those phenomena appropriately and efficiently. For this purpose, one needs to introduce relevant models of the phenomena type, the accessibility or inaccessibility of the observation area, environmental conditions, spatial relations, information availability, etc.
Sensor placement and the impact of the quality of initial datasets used to deploy sensors in the networks are two aspects of the complexity of wireless sensor networks. Therefore, choosing the way of deploying sensors and the data accuracy needed to set up a sensor network in an optimal manner are difficult due to the abundance of available deployment algorithms as well as design of a consistent, reliable, and robust network. Thus, study of wireless sensor networks is a challenging task that requires multi-disciplinary knowledge and expertise.
Coverage and communication between sensors are two important challenges in sensor network deployment. Nodes use their sensing devices to detect events occurring in the region of interest. Each device is assumed to have a sensing range, which depends on the phenomenon being sensed and the environmental constraints. The existence of obstacles affects network coverage and may result in holes in the sensing field. Communication between nodes is equally important, because information collected from the region should be transferred directly to a processing center or via its adjacent sensor. In the latter case, each sensor needs to be aware of the position of other adjacent sensors in its proximity. Several approaches exist to detect holes and increase the coverage of sensor networks through optimizing sensor placement (Romoozi & Ebrahimpour-komleh 2010; Aziz et al. 2009; Niewiadomska-Szynkiewicz & Marks 2009; Ghosh & Das 2008; Wang et al. 2009). From a broader perspective, proposed approaches can be classified as global and local solutions. Some of the proposed algorithms from both categories use computational geometry, in particular Voronoi diagrams and Delaunay triangulation, to locally identify
4
and deal with holes and coverage problem (Wang et al. 2006). These structures are useful for evaluating the spatial distribution of sensors in the environment.
Spatial coverage of sensor networks is much related to the spatial distribution of the sensors in the environment. The deployment optimization algorithms try to distribute sensors in the field to obtain desired coverage regarding tasks at hand. However, more investigation is needed to extend the application of these algorithms in coverage determination and optimization of more complex sensor networks, e.g., sensor networks with environmental obstacles. Since little existing research has targeted the integration of geo-spatial characteristics of the environment, development of new approaches that take into account such features of the environment (e.g., heterogeneity of the field, terrain model, man-made and natural obstacles) has a practical significance. The integration of information in the form of the terrain and other spatial information will result in more realistic models of the sensor networks and will provide more efficient methods for their deployment in a real world environment. In this context, geographical information systems can help to provide the required information (e.g., digital terrain models) or spatial analyses (e.g., visibility analysis) functionalities in order to better evaluate and optimize geosensor networks.
1.2 Problem Statement
Currently sensor networks take advantage of high technology, but as explained before many challenges exist in the field to be investigated. One of these challenges is efficient determination of sensor positions in the environment, also known as the sensor placement problem. This depends not only on the consideration of geospatial information in the optimization process but also on the impact of the quality of such information on this process. This thesis tackles general and specific sensor placement problems.
1.2.1 General Problem
Finding the best sensor locations to get desired coverage of a region of interest is an important issue in sensor network deployment. In some literatures, coverage is defined according to the visibility between the observer and the target points (De Berg et al. 2000). More specifically, in sensor networks, the coverage of a point means that the point is located
5
in the sensing field of a sensor node. Failing this condition for some points in the region of interest will result in coverage holes. Based on the mentioned definition of coverage in sensor networks, the coverage problem basically means placing a minimum number of nodes in an environment, such that every point of interest in the sensing field is well covered (Aziz et al. 2009; Ghosh & Das 2008). Sensor placement methods mainly proposed in the literature are based on simplistic models that usually assume flat terrain without obstacles (Ahmed et al. 2005). So, the general problem, of this thesis is the lack of consideration of spatial environmental elements in the current methods of deployment optimization and hence the problem of inefficient spatial coverage of such networks.
1.2.2 Specific Problems
Considering the general problem, the specific problems that will be considered in this thesis are introduced in the following subsection.
1.2.2.1 Problem with the spatial and environmental information
integration in deployment process
As mentioned before, taking into account the environmental elements of the network is an important issue in coverage estimation and optimization of sensor networks. In addition to the form and the topography of area covered by the sensor network, various obstacles may prevent the sensors from covering the whole area or allowing data communication between the sensors. To carry out a realistic sensor placement scheme, it is necessary to take into account the environmental information that affects sensor performance and network coverage. Furthermore, the spatial relations among sensors in the network and between sensors and the environmental elements define other types of information to be considered in the sensor network. We called these three aspects the Contextual Information (CI).
1.2.2.2 Problem with the local deployment optimization
Most of the optimization methods used for sensor network deployment are based on considering global information and relations that exist inside the network (Romoozi & Ebrahimpour-komleh 2010; Aziz et al. 2009; Niewiadomska-Szynkiewicz & Marks 2009; Ghosh & Das 2008; Wang et al. 2009). They mostly look for the optimum solution of the
6
problem considering the entire network connections, coverage, and sensor configurations. Usually, global methods are more sophisticated, in terms of defining and considering all spatial relations as well as different situations of environmental elements. They often use stochastic or probabilistic methods to find the answer. Thus, they need heavy calculations and as a result high processing time and resources to solve the problem. While, in local approaches, the solution is realized step by step, looking at the problem locally inside the network. These methods look at the specific parts of the network to find the answers locally, and then move to another part for searching the next step.
1.2.2.3 Problem with uncertainty in spatial information that is
used in sensor deployment process
Wireless sensor networks may not cover the study area as expected when they are deployed in the real environment because of several factors. For example, some environmental impacts exist, which may lead to non-deterministic behavior, malfunction of the sensors, or even completely bar the sensor’s field of view. Accuracy of the spatial information is very important in coverage estimation in sensor networks. Hence, data quality assessment is necessary in sensor network deployment, due to the dependency of the final results to the spatial information used in the optimization process. In addition, optimization models used in the sensor networks deployment are usually simplified representation of the reality, and consequently may lead to uncertainty in the results. Thus, it is important to perform the spatial data quality assessment, and define the accuracy level, which is necessary to satisfy the objective of optimization, as well as assess the impact of probable error propagation in sensor network deployment.
1.3 Research Objectives
Sensor networks have been intensely studied by researchers in the recent years. Many research works have been done and many papers have been published, but many unknown aspects are still open to study (Nittel 2009; Ghosh & Das 2008; Wang et al. 2009; Chen & Koutsoukos 2007; Akyildiz et al. 2002; Ahmed et al. 2005; Zhu et al. 2012). In this section the general and specific objective of this thesis will be explained.
7
1.3.1 General Objectives
The general objective of the present thesis is to improve spatial coverage in the deployment of a sensor network. Therefore, finding the best sensor location for desired coverage in the region of interest, regarding the initial situations, is the focus of this thesis. Hence, defining a conceptual framework for sensor network deployment is an important issue of the general objective of this thesis. Another aspect of main objective is to investigate different optimization algorithms of sensor deployment and introduce an algorithm to deploy a minimum number of nodes over the network in order to maximally cover the sensing area.
1.3.2 Specific objectives
In order to achieve the general objective of this research work, we have defined our specific objectives as follows:
1.3.2.1 Defining a framework in order to integrate spatial
information in sensor networks deployment algorithms
As a first specific objective, we propose a conceptual framework that defines the method allowing the integration of contextual information in the sensor network optimization process. This information should include spatial information, the topography of study area as well as the natural and man-made obstacles. For that purpose, a geographic information system (GIS) is applied to model the realistic environment in a manner that more detailed environmental information is considered in the sensor network placement. Moreover, functions and capabilities available in GIS serve more spatial facilities to deploy sensors in the network. On the other hand, spatial information and geometrical relations among sensors as well as sensors and the environment need to be analyzed and investigated during the optimization process.
1.3.2.2 Developing a local context-aware optimization algorithm
for sensor network deployment
Developing a local optimization algorithm according to the proposed framework for sensor network deployment is the next specific objective of the thesis to tackle the sensor placement problem, and maximize the spatial coverage of the network. In order to develop a
8
context-aware optimization algorithm, the Contextual Information (CI) available in the network area should be investigated and considered in different spatial, temporal, and thematic cases. Hence, the concept of context needs to be defined based on its application for sensor network deployment. Then, different CI categories related to sensor networks should be introduced. They need to be considered in the optimization algorithm to make a realistic deployment through finding candidate positions of sensor nodes, which are consistent with reality. In addition, the optimization algorithm is developed to carry out the deployment regarding local configuration of sensors in the network. Thus, corresponding actions such as sensor movement inside the network are defined considering both local geometric structure of the network, and local specific CI.
1.3.2.3 To perform data quality assessment and error
propagation analysis
There are many factors in a real environment that affect sensor network performance, and require investigation of data quality. It is important to determine the required level of accuracy in different applications of sensor networks as well as investigate error propagation in the mathematical equations used by the optimization algorithms. Therefore, the next specific objective of this thesis is to perform the accuracy assessment and error analysis. For this purpose, specific implications of spatial data quality criteria for a 3D city model used in sensor network optimization algorithms are investigated. Then, the impact of some data quality components (e.g. geometric accuracy, positional accuracy, etc.) on the estimation of sensor network coverage is analyzed. Afterwards, the impact of 3D city models quality on the estimation of coverage using global and local optimization algorithms is demonstrated.
1.4 Hypothesis
The general hypothesis of this research postulates that the integration of spatial and environmental information with the optimization algorithms and geometric approaches can improve sensor networks coverage and provide optimal deployment of sensor network in the real environment.
9
1.5 Methodology
The proposed methodology is composed of four phases to achieve the objectives of the thesis and validate the hypotheses. Given the general objective of this research, the different phases of the methodology have been defined.
1.5.1 Phase 1: Literature review
This phase was dedicated to survey the related researches and ideas, which already have been developed regarding to the sensor networks and their characteristics, specially the network coverage. This step helped in better understanding the project, its problems, objectives, available solutions and the state of the art, e.g., sensor network technology, communication in sensor networks, network topology, network control and spatial integration, data processing in sensor networks, data fusion, programming, and etc. Since the main objective of the research is coverage optimization, the literature review was classified into four categories:
1- Geosensors, sensor networks and their characteristics, challenges and current problems. 2- Coverage optimization approaches in sensor networks from global approaches, such as evolutionary algorithms to local approaches like geometric approaches, which consider the topology of the network in their algorithms.
3- The concept of context in sensor network deployment, the contextual information, different types of contextual information, and context-aware optimization methods
4- Uncertainty of geographic information, the quality of spatial data and their impact on the sensor network coverage optimization process.
The concepts related to the geographic information systems (GIS) were investigated in all parts of literature review, as it is a powerful tool to provide spatial information and spatial analysis tools for optimization process in sensor network. The literature review included both global and local optimization approaches. Then, an overview of the current and state of the art methods was done, and the appropriate techniques for applying in the context of the
10
project was selected and introduced. Then, advantages and disadvantages of each method was discussed and the most proper way to optimize sensor placement chosen and improved. Another important task that was explored in this phase was to find consistent and compatible datasets to make a realistic representation of the environment within GIS as an input for the sensor network optimization algorithm. The appropriate data set that has been used in this thesis is a part of down town Quebec City since it meets the requirements of applying and testing the proposed methods and algorithms. The optimization algorithms were implemented on MATLAB to carry out the experimentations and validate the proposed approaches.
1.5.2 Phase 2: To define a GIS based context-aware framework for
integrating environmental information in sensor network
deployment algorithms
In this phase two main ideas were pursued: defining a context-aware framework to consider the sensors, and the environmental information and explain how GIS could help to integrate the contextual information for the optimization algorithms. Given the sensor types and their characteristics, a context-aware optimization platform was developed to integrate the environmental information in order to enhance the network coverage. GIS was used in the framework to appropriately include environmental and network objects such as buildings, vegetation and sensor nodes in the framework considering different applications. Many environmental elements may be considered in the context-aware algorithms, e.g., digital terrain models (DTM) are the important issue to be explicitly included in a realistic modeling of sensor placement, which have not been considered in previous studies. In this phase of the research, we integrated spatial information in the optimization framework. Using GIS capacities improved the proposed framework ability to take into account the environmental elements in different classified layers of information such as man-made and natural obstacles, streets, building blocks, trees, poles and terrain topography as well as analyzing the information to get the intended purposes. Legal information such as restricted area for sensors deployment was introduced as another contextual information layer. Desirability of coverage in a specific area such as a distinctive street or a special building was represented as the next contextual information. These contextual information layers
11
were supposed to be changed during the deployment optimization process. The impact of these variations on the coverage was attended in the proposed framework.
To fulfill the optimization process, all mentioned contextual information, whether environmental or network elements were applied to define logical rules in the framework. Afterward, appropriate actions are extracted using the CI, for example, to move or delete existing sensors or add new sensors in the network to satisfy the optimum coverage.
1.5.3 Phase 3: To develop a local geometric structure for network
modeling and sensor placement optimization
In this phase, a sensor network was modeled using geometric approaches. This includes sensors nodes and their sensing areas as well as their topological relations within a network. Next, the optimization process was conducted using the defined structure and proposed framework. The optimization algorithm acted as an operation to rearrange node configurations in the network in order to discover the proper sensor placement aiming at desired coverage level in the network. Since, the geometric structure of sensor nodes may change during the optimization process, the coverage over the network may change as well. Therefore, the local geometric optimization algorithm was defined as an iterative method to reconstruct the geometric structure and recalculate the network coverage in each step. During running the algorithm, the coverage was compared with the former value. Then, the evolved values were accepted to conduct the new sensor actions. The optimization algorithm stopped when there was no more improvement in the new step versus the previous.
Since spatial coverage of sensor networks is related to the spatial distribution of the sensors in the environment, the algorithm applied Voronoi diagrams and the CI available in the network area. Voronoi diagrams were utilized to develop sensor deployment optimization algorithms in two categories of coverage hole detection, and healing the holes in the networks. The proposal is a generic algorithm to optimize the deployment, by means of considering the CI to determine the sensor configuration in the network. It was done through defining sensors actions such as movement, deletion, and insertion inside the network. The types of CI and their related sensor behavior might be different and customized according to the sensor network deployment task at hand. In the extended algorithm, sensors were sorted
12
in a priority queue based on their coverage gain following related moves in the network. Then the sensor with the maximum gain was selected. The sensor obtained the highest coverage improvement by its movement in the network, and then stood at the top of the queue. By changing the position of the topmost sensor of the queue, the network configuration was updated. Next, the coverage gain of the adjacent sensors of the moved sensor was recalculated and their ordering in the priority queue was updated. In the next iteration, the (new) topmost sensor of the queue was chosen to move, and so on. This local optimization process was iteratively conducted until the predefined stopping criteria were maid. This will be explained in more details in Chapter 4.
1.5.4 Phase 4: Spatial data quality and uncertainty assessments
Spatial information is inherently uncertain. Several factors may contribute to the uncertainty of spatial information. Since spatial models are simplified representation of complex reality, they may produce and propagate errors. In addition, instruments, which are used to collect spatial information, may have some inaccuracies. The other problem that may lead to inaccuracy in data acquisition is involvement of humans in this process. The level of acceptability of the spatial data quality depends on applications (R. Devillers 2006). The quality of the spatial data may be characterized by their spatial accuracy, precision, semantic quality and their logical consistency. All of these elements of quality must be considered in order to characterize the overall quality of the spatial information.
In this phase, spatial data quality and the concept of uncertainty in spatial data were investigated with respect to the optimization of the sensor network deployment. Main criteria of spatial data quality like positional, attribute, and temporal accuracies (Oort 2006) were surveyed in this phase, and their impact on the optimization of sensor network deployment were investigated. To study the impact of uncertainty in spatial data on sensor network placement, main categories of spatial data quality assessment were tested by defining some simple analyses. The positional accuracy assessment was done by comparing with another dataset of better quality, also called “control” or “reference” data set. This comparison is absolutely relative, because it relates to the accuracy of the reference dataset (Servigne et al. 2006).
13
A probabilistic error model was defined based on investigating the impact of spatial data quality in sensor network deployment and sensor network coverage. After error model definition one may question how important the uncertainty in the data is. Small errors may be negligible in subsequent calculation, whereas large errors may have a significant impact. This question was answered using an error propagation model. To investigate the error propagation, one solution might be involving some deliberate errors in datasets using any above mentioned data quality criteria and study their impact on the final expected results. Consequently, a study on the accuracy and uncertainty of the different layers of spatial information, which were used to optimize the sensor network placement and its coverage, was done. For example, the accuracy assessment of obstacles, which was considered in the coverage optimization algorithm, was fulfilled. It investigated how changing the position of each obstacle will affect the coverage of deployed sensor nodes. The same procedure was done on other spatial information layers as well as the initial or final position of sensor nodes. Other components of spatial data quality may have significant impact on the sensor network optimization as well as positional accuracy.
14
Figure 1.1: The schema of the research methodology
Phase 1: Literature review and database
preparation
Phase 2: To define a GIS based context-aware framework for integrating environmental information
in sensor network deployment algorithms
Hypotheses To define the research
work
Phase 3: To develop and test a local context-aware sensor network
optimization algorithm
To write and submit thesis
Phase 4: Spatial data quality and uncertainty assessments
15
1.6 Organization of the Thesis
This thesis has resulted in 4 articles. Two articles that compose Chapters 3 and 5 were accepted and published in scientific journals; one that composes Chapter 2 was published as a book chapter, and one article that composes Chapter 4 was submitted to a scientific journal.
The first chapter was focused on the definition of the research context, problem statement, research objectives (general and specific), and the research method.
The second chapter presents the background of the research, including a presentation of fundamental concepts of geosensor network deployment and optimization algorithms, a review of wireless sensor network technology and applications used in this thesis, and a literature review on spatial modeling issues in sensor network deployment containing introducing the concept of optimization in sensor network deployment, which is classified in two categories of local and global optimization approaches. This chapter is published in the book entitled Wireless Sensor Networks, From Theory to Applications in 2013 by
Taylor& Francis, CRC Press.
Chapters 3, 4 and 5 present the contributions of the thesis, which were submitted or published in scientific journals. The third chapter presents a GIS based wireless sensor network coverage estimation and optimization approach by using the concept of Voronoi diagram. It proposes a more realistic deployment approach by integrating spatial information in the optimization process based on Voronoi diagram and the GIS functionalities. This chapter has been published as an article in the journal of Transactions
on Computational Science XIV in 2011.
The fourth chapter is a paper presents the context-aware optimization of sensor network deployment. This chapter proposes the problem of placing sensors in the network to get optimum coverage by investigating the concept of contextual information, and introduces a local context-aware framework of sensor network deployment optimization method. It has been submitted to the special issue “Environmental Wireless Sensor Networks” of the
16
The fifth chapter is a paper presents the impact of the quality of a spatial 3D city model on sensor network placement optimization. It investigates specific implications of spatial data quality criteria for a dataset used in sensor network deployment optimization algorithms, and the impact of these criteria on the positions of the sensors in the network, and estimation of the network coverage. This chapter has been published as an article in the
Geomatica journal in 2012.
The last chapter presents the conclusion of the thesis, including future research perspectives. The papers that were published and that compose the thesis have been very slightly modified after being integrated in the thesis. Consequently, the content of some chapters may seem redundant, but this is only to ensure that each article stands by its own and presents adequate background and context.
1.7 References
Ahmed, N., Kanhere, S. & Jha, S., 2005. The holes problem in wireless sensor networks: a survey. ACM SIGMOBILE Mobile Computing and Communication Review, 1(2), pp.1–14. Available at: http://dl.acm.org/citation.cfm?id=1072992 [Accessed January 9, 2013]. Akyildiz, I.F. et al., 2002. Wireless sensor networks: a survey. Computer Networks, 38(4), pp.393–422. Available at: http://linkinghub.elsevier.com/retrieve/pii/S1389128601003024. Aziz, N., Aziz, K. & Ismail, W., 2009. Coverage strategies for wireless sensor networks.
World Academy of Science, Engineering and Technology, 50, pp.145–150. Available at:
http://www.waset.ac.nz/journals/waset/v26/v26-24.pdf [Accessed January 9, 2013]. De Berg, M. et al., 2000. Computational Geometry. In Computational Geometry SE - 1. Springer Berlin Heidelberg, pp. 1–17. Available at: http://dx.doi.org/10.1007/978-3-662-04245-8_1.
Chen, J. & Koutsoukos, X., 2007. Survey on coverage problems in wireless ad hoc sensor networks. In IEEE SouthEastCon. Available at:
http://citeseerx.ist.psu.edu/viewdoc/download?doi=10.1.1.65.5285&rep=rep1&type=pdf [Accessed January 9, 2013].
Chong, C. & Kumar, S., 2003. Sensor networks: evolution, opportunities, and challenges.
Proceedings of the IEEE, 91(8). Available at:
http://ieeexplore.ieee.org/xpls/abs_all.jsp?arnumber=1219475 [Accessed January 9, 2013]. Ghosh, A. & Das, S.K., 2008. Coverage and connectivity issues in wireless sensor
17
http://linkinghub.elsevier.com/retrieve/pii/S1574119208000187 [Accessed November 30, 2012].
Niewiadomska-Szynkiewicz, E. & Marks, M., 2009. Optimization Schemes For Wireless Sensor Network Localization. International Journal of Applied Mathematics and Computer
Science, 19(2), pp.291–302. Available at:
http://versita.metapress.com/openurl.asp?genre=article&id=doi:10.2478/v10006-009-0025-3 [Accessed October http://versita.metapress.com/openurl.asp?genre=article&id=doi:10.2478/v10006-009-0025-30, 2012].
Nittel, S., 2009. A survey of geosensor networks: advances in dynamic environmental monitoring. Sensors (Basel, Switzerland), 9(7), pp.5664–78. Available at:
http://www.pubmedcentral.nih.gov/articlerender.fcgi?artid=3274151&tool=pmcentrez&ren dertype=abstract [Accessed November 18, 2012].
Oort, P. van, 2006. Spatial data quality : from description to application. Wageningen Universiteit.
R. Devillers, R.J., 2006. Spatial data quality: concepts. In Fudumentals of Spatial Data
Quality. ISTE, pp. 31–42.
Romoozi, M. & Ebrahimpour-komleh, H., 2010. A Positioning Method in Wireless Sensor Networks Using Genetic Algorithms. In Proceedings of 2010 International Colloquium on
Computing, Communication, Control, and Management (CCCM2010). pp. 174–179.
Available at: http://cpfd.cnki.com.cn/Article/CPFDTOTAL-ZNXX201008006054.htm [Accessed January 9, 2013].
Servigne, S., Lesage, N. & Libourel, T., 2006. Quality components, Standards, and Metadata. In Fudumentals of Spatial Data Quality. ISTE, pp. 179–210.
Sharifzadeh, M. & Shahabi, C., 2004. Supporting spatial aggregation in sensor network databases. Proceedings of the 12th annual ACM international workshop on Geographic
information systems - GIS ’04, p.166. Available at:
http://portal.acm.org/citation.cfm?doid=1032222.1032248.
Soro, S. & Heinzelman, W.B., 2005. The coverage problem in video-based wireless sensor networks. In Broadband Networks, BroadNets. pp. 932 – 939. Available at:
http://ieeexplore.ieee.org/xpls/abs_all.jsp?arnumber=1589704&tag=1.
Szewczyk, B.R. et al., 2004. Habitat Monitoring with Sensor Networks. Communications of
the ACM, 47(6), pp.34–40.
Wang, B., Lim, H.B. & Ma, D., 2009. A survey of movement strategies for improving network coverage in wireless sensor networks. Computer Communications, 32(13-14), pp.1427–1436. Available at:
http://linkinghub.elsevier.com/retrieve/pii/S014036640900108X [Accessed November 30, 2012].
18
Wang, G., Cao, G. & Porta, T. La, 2006. Movement-assisted sensor deployment. IEEE
TRANSACTIONS ON MOBILE COMPUTING, 5(6), pp.640–652. Available at:
http://ieeexplore.ieee.org/xpls/abs_all.jsp?arnumber=1354668 [Accessed January 9, 2013]. Worboys, M. & Duckham, M., 2006. Monitoring qualitative spatiotemporal change for geosensor networks. International Journal of Geographical …, 00(00), pp.1–28. Available at: http://www.tandfonline.com/doi/abs/10.1080/13658810600852180 [Accessed July 21, 2014].
Zhu, C. et al., 2012. A survey on coverage and connectivity issues in wireless sensor
networks. Journal of Network and Computer Applications, 35(2), pp.619–632. Available at: http://linkinghub.elsevier.com/retrieve/pii/S1084804511002323 [Accessed November 30, 2012].