Published in: Optics Letters (2004), vol.29, iss.3, pp.274-276 Status: Postprint (Author’s version)
Picosecond laser for performance of efficient nonlinear spectroscopy from
10 to 21 µm
Alaa A. Mani1, Zachary D. Schultz2, Andrew A. Gewirth2, Jeffrey O. White2, Yves Caudano3, Christophe Humbert3, Laurent Dreesen3, Paul A. Thiry3, and Andre Peremans3
1Laboratoire de Spectroscopie Moléculaire de Surface, University of Namur, 61 Rue de Bruxelles, Namur B-5000, Belgium
2Frederick Seitz Materials Research Laboratory, University of Illinois at Urbana — Champaign, 104 S. Goodwin Avenue, Urbana, Illinois 61801
3Laboratoire de Spectroscopie Moléculaire de Surface, University of Namur, 61 Rue de Bruxelles, Namur B-5000, Belgium
Abstract
Laser tunability from 10 to 21 µ m is obtained by use of an optical parametric oscillator based on a KTP crystal followed by a difference-frequency stage with a CdSe crystal. An all-solid-state picosecond Nd:YAG oscillator mode locked by a frequency-doubling nonlinear mirror is used for synchronous pumping.
As was demonstrated in 1988,1 infrared-visible sum-frequency generation (SFG) spectroscopy has emerged as a
versatile interface-sensitive vibrational technique. SFG requires intense laser sources that are widely tunable across the vibrational fingerprint of the molecules. In recent years the infrared tunability of tabletop lasers has been extended to 11 µm by use of a single parametric conversion in a AgGaS2 crystal. However, the important
spectral region from 10 to 20 µ m has remained out of reach for tabletop SFG spectrometers so far. Performance of SFG measurements in that range has been essentially limited to the use of very expensive free-electron lasers, which are available only in large-scale installation facilities.2 Tabletop lasers tunable in the mid-IR have been realized by means of multiple conversion steps of a near-IR pump, using either a CdSe or a GaSe crystal as a difference-frequency generator.3,4 However, in these two cases, the beam power generated at 15 µm in the picosecond regime was in the range from 0.02 mW (Ref. 3) to 0.4 mW (Ref. 4), which is too low for sensitive SFG spectroscopy.
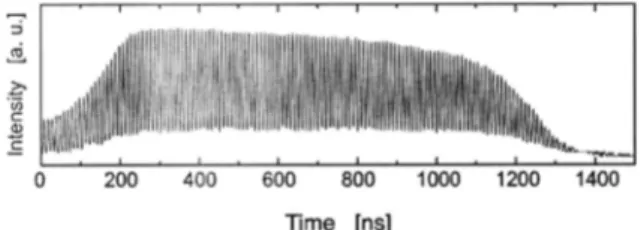
In this Letter we describe the scheme of a tabletop laser that enables us to perform SFG spectroscopy from 10 to 21 µm. The picosecond pump laser consists of a Nd:YAG oscillator mode locked by a frequency-doubling nonlinear mirror combined with a GaAs platelet acting as a two-photon absorber. Careful adjustment of the mirror elements (i.e., telescope distance, air space between the crystal and the dichroic mirror, diameter of the intracavity aperture) allows us to achieve pulse durations as short as 8.3 ps. A train of ~100 pulses (train repetition rate of 25 Hz, pulse repetition rate inside the train of 100 MHz) is extracted from the laser cavity: The train envelope is illustrated in Fig. 1.5,6
The pulse train is amplified by a double pass through a second Nd:YAG oscillator to produce a power of ~1.3 W. Two-thirds (900 mW) of this power pumps a mid-IR optical parametric oscillator (OPO), while the
remainder is frequency doubled to generate a visible beam at 532 nm. The tandem KTP-CdSe OPO depicted in Fig. 2 relies on the two-step conversion process proposed in Ref. 4.
The first step consists of synchronously pumping an OPO built around a KTP crystal. The cut angle of the KTP crystal (type II, 5 mm X 5 mm X 15 mm long, antireflection coated at 2.1 µm, manufactured by Altechna) is optimized for the following SFG process: 1.064 µm (pump) → 1.987 µm (signal) + 2.290 µ m (idler) (o → o +
e). The crystal cut angle (θ = 55°, φ = 0°, surface normal in the xz plane) differs from the one used in Ref. 4 (θ =
47°, φ = 90°, surface normal in the yz plane). The cut angle chosen in this Letter provides the advantages of a
larger nonlinear effective coefficient (2.65 pm/V in the xz plane versus 1.4 pm/V in the yz plane) and of parallelism between the KTP and the CdSe crystal rotation axes. These axes are set vertically to keep all the beam wave vectors inside one plane parallel to the optical table. The KTP crystal is placed in an OPO cavity delimited by a gold mirror (Ml) and an output coupler (dielectric mirror M2) with radii of curvature R = 5 m. The output coupler reflection coefficient is ~0.7 at 2.3 µm, permitting oscillation of the idler beam (λ = 2.23-2.45
µ m) when the cavity length (approximately 1.5 m) properly matches the repetition rate (100 MHz) of the pulses.
Published in: Optics Letters (2004), vol.29, iss.3, pp.274-276 Status: Postprint (Author’s version)
off the axis of the OPO cavity. For a pump beam diameter of ~1.6 mm (i.e., peak irradiance ~1.5 GW/cm2) in the KTP crystal, we measured an idler beam of ~90 mW, corresponding to a conversion efficiency of ~20%. The total output power (signal + idler) is ~110 mW. Type II phase matching in KTP ensures a limited bandwidth of 1.6 cm-1.
Fig. 1: Envelope of the pulse train (~100 pulses) extracted from the Nd:YAG oscillator mode locked by a
frequency-doubling nonlinear mirror.5
Fig. 2: KTP OPO followed by a DFG stage in CdSe. Dashed-dotted line, pump beam at 1.064 µm (vertical
polarization); long-dashed line, KTP OPO idler beam (2.23-2.45 µm, horizontal polarization); short-dashed line, KTP OPO signal beam (1.87-2.03 µm, vertical polarization); solid line, DFG beam (10-21 µm, vertical polarization).
By use of the delay line (DL) shown in Fig. 2, the signal and idler beams from the KTP OPO are focused in the CdSe crystal (10 mm wide × 5 mm high × 15 mm long, type II, θ = 70°). The experimental points in Fig. 3 represent the observed phase-matching curve of the CdSe crystal. The points show good agreement with a calculation using the Sellmeier coefficients.7
The theoretical assumption of beam collinearity accounts for the departure of the calculation from the
experiment. The total peak irradiance on the CdSe is approximately 75 MW/cm2. Indeed, a 50% depletion of the signal beam (λ = 1.94 µ m) is observed on optimization of the difference-frequency generation (DFG) stage at 11
µ m, indicating the adequacy of the irradiance obtained without inserting a telescope between the two conversion
steps. The absence of a telescope, as well as the length of the KTP OPO, ensures low divergence of the two input beams in the DFG stage. This results in low divergence of the beam generated at the DFG frequency. We measured a divergence of approximately 3 mrad for the beam at 15 µ m, close to the diffraction limit determined by the gain-limited aperture of 2-mm diameter in the DFG crystal. No damage to the nonlinear crystal was observed in the present alignment conditions.
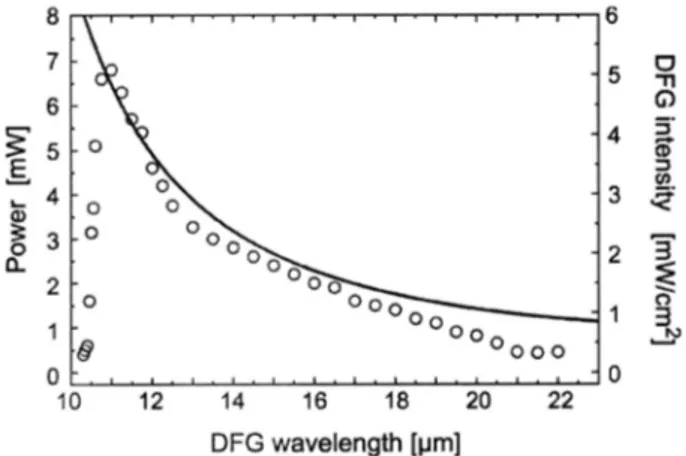
The power spectrum measured at the DFG stage output is presented in Fig. 4. At 15 µ m, the power approaches 2 mW, making the laser system adequate for SFG spectroscopy. In Fig. 4, the output power is also compared with a theoretical evaluation of the DFG process efficiency given by Eq. (1),8
Published in: Optics Letters (2004), vol.29, iss.3, pp.274-276 Status: Postprint (Author’s version)
where the subscripts s, i, and DFG refer to the signal, idler, and DFG beams, respectively. I, λ, and n are the beam peak intensity (MW/cm2), the wavelength (µ m), and the corresponding refractive index, respectively. Crystal length L is ~15 mm. Taking into account that the diameter of the interacting beams on the CdSe crystal surface was ~3.9 mm, we find that the angular dependence of the effective nonlinear coefficient is given by deff
= 18 sin θ pm/V (Ref. 8) and the estimated reflection losses are ~11% and ~17% at the front and rear crystal
surfaces, respectively. The good correspondence between the experimental data and the theoretical prediction enables one to assign the decrease in conversion efficiency at the longest wavelengths to the decrease of the DFG frequency. An observed departure of the experimental power curve from theory at wavelengths below 10 µ m might result from the excessive tilt angle of CdSe. For this reason, we propose to cut the CdSe crystal at an angle of ~76°, which could give better tuning in the region near 9.5 µm without jeopardizing the operation of the KTP-CdSe OPO near 20 µm. The phase-matching curve calculated for that cut angle is presented in Fig. 3.
Fig. 3: DFG wavelength versus tuning angle of the CdSe crystal (external phase-matching angle). The solid
curve shows a theoretical calculation of the rotation angle with respect to the normal of the front surface. The circles represent the experimental data. The dashed curve shows the tuning parameters estimated for a cut angle equal to 76° that provides better operation in the 9-10-µm spectral region.
Fig. 4: Output power measurements of the DFG stage versus wavelength (open circles). The corresponding
intensity is shown on the right-hand axis. The theoretical values are presented as a solid curve.
The present OPO device is computer controlled for performance of nonlinear spectroscopy in the mid-IR. SFG spectroscopy from 9.5 to 20 µm has been performed on monolayers of the thiophenol and naphthalene thiol
self-Published in: Optics Letters (2004), vol.29, iss.3, pp.274-276 Status: Postprint (Author’s version)
assembled on silver. The results are currently under investigation.
In conclusion, we have described an extension of the spectral agility of a SFG spectrometer to detect nonlinear vibrations in the region from 475 to 1000 cm-1. This extension is based on tandem KTP-CdSe synchronously pumped by an all-solid-state picosecond Nd:YAG laser. This setup permits laser operation over the spectral range from 10 to 21 µm with a resolution of ~2 cm-1 and delivers a few milliwatts of power, which is suitable for nonlinear spectroscopic applications.
Acknowledgments
We thank G. Q. Lu for assistance during the SFG experiment. A. Peremans is a research associate and Y. Caudano is a postdoctoral researcher of the Belgium National Fund for Scientific Research (FNRS). This work was supported by the Belgian fund for Joint Basic Research; by the Belgian Interuniveristy Program on "Quantum size effects in nanostructured materials" (grant PAI/IUAP 5/1) initiated by the Belgian Office for Scientific, Technical, and Cultural Affairs; by the Walloon region and by the Division of Materials Sciences of the U.S. Department of Energy under award DEFG02-91ER45439; and through the Frederick Seitz Materials Research Laboratory at the University of Illinois at Urbana-Champaign.
References
1. P. Guyot-Sionnest, R. Superfine, J. H. Hunt, and Y. R. Shen, Chem. Phys. Lett. 144, 1 (1988).
2. A. Peremans, A. Tadjeddine, R. Prazeres, F. Glotin, D. Jaroszynski, and J.-M. Ortega, Nucl. Instrum. Meth. A 341, 146 (1994). 3. A. J. Campillo, R. C. Hyer, and S. L. Shapiro, Opt. Lett. 4, 325 (1979).
4. A. Dhirani and P. Guyot-Sionnest, Opt. Lett. 20, 1104 (1995).
5. A. A. Mani, P. Hollander, P. A. Thiry, and A. Peremans, Appl. Phys. Lett. 75, 3066 (1999).
6. A. A. Mani, L. Dreesen, P. Hollander, C. Humbert, Y. Caudano, A. Thiry, and A. Peremans, Appl. Phys. Lett. 79, 1945 (2001). 7. V. G. Dmitriev, G. G. Gurzadyan, and D. N. Niko-gosyan, in Handbook of Nonlinear Optical Crystals, A. E. Siegman ed., Vol. 64 of Springer-Verlag Series in Optical Science (Springer-Verlag, Berlin, 1991), Chap. 3 pp. 53-127.