Molecules 2021, 26, 846. https://doi.org/10.3390/molecules26040846 www.mdpi.com/journal/molecules Article
Phytochemical Investigation and Biological Activities of
Lantana rhodesiensis
Fatimata Nea 1,2,*, Michel Boni Bitchi 1, Manon Genva 2, Allison Ledoux 3, Alembert Tiabou Tchinda 4, Christian Damblon 5, Michel Frederich 3, Zanahi Félix Tonzibo 1 and Marie-Laure Fauconnier 2
1 Laboratory of Constitution and Reaction of Matter, UFR-SSMT, University Félix Houphouët-Boigny,
01 BP 582 Abidjan 01, Ivory Coast; bbonimichel@yahoo.fr (M.B.B.); tonzibz@yahoo.fr (Z.F.T.)
2 Laboratory of Chemistry of Natural Molecules, Gembloux Agro-Bio Tech, University of Liège, Passage des
Déportés 2, 5030 Gembloux, Belgium; m.genva@uliege (M.G.); marie-laure.fauconnier@uliege.be (M.-L.F.)
3 Laboratory of Pharmacognosy, Center for Interdisciplinary Research on Medicines (CIRM), University of
Liège, Avenue Hippocrate 15, 4000 Liège, Belgium; allison.ledoux@uliege.be (A.L.); m.frederich@uliege.be (M.F.)
4 Laboratory of Phytochemistry, Centre for Research on Medicinal Plants and Traditional Medicine,
Institute of Medical Research and Medicinal Plants Studies, P.O. Box 13033 Yaoundé, Cameroon; talembert@gmail.com
5 MolSys Research Unit, Faculty of Sciences, University of Liège, 4000 Liège, Belgium; c.damblon@uliege.be * Correspondence: Fatimata.Nea@uliege.be; Tel.: +32-(0)4-6521-2551
Abstract: Lantana rhodesiensis Moldenke is a plant widely used to treat diseases, such as rheumatism,
diabetes, and malaria in traditional medicine. To better understand the traditional uses of this plant, a phytochemical study was undertaken, revealing a higher proportion of polyphenols, including flavonoids in L. rhodesiensis leaf extract and moderate proportion in stem and root extracts. The antioxidant activity of the extracts was also determined using three different assays: the radical 2,2-diphenyl-1-picrylhydrazyl (DPPH) scavenging activity, the FRAP method (Ferric-reducing antiox-idant power) and the β-carotene bleaching test. The anti-malarial activity of each extract was also evaluated using asexual erythrocyte stages of Plasmodium falciparum, chloroquine-sensitive strain 3D7. The results showed that the leaf extract exhibited higher antioxidant and anti-malarial activi-ties in comparison with the stem and root extracts, probably due to the presence of higher quantiactivi-ties of polyphenols including flavonoids in the leaves. A positive linear correlation was established be-tween the phenolic compound content (total polyphenols including flavonoids and tannins; and total flavonoids) and the antioxidant activity of all extracts. Furthermore, four flavones were iso-lated from leaf dichloromethane and ethyl acetate fractions: a new flavone named rhodescine (5,6,3’,5’-tetrahydroxy-7,4’-dimethoxyflavone) (1), 5-hydroxy-6,7,3’,4’,5’-pentamethoxyflavone (2), 5-hydroxy-6,7,3′,4′-tetramethoxyflavone (3), and 5,6,3’-trihydroxy-7,4’-dimethoxyflavone (4). Their structures were elucidated by 1H, 13C NMR, COSY, HSQC, HMBC, and MS-EI spectral methods. Aside from compound 2, all other molecules were described for the first time in this plant species.
Keywords: Lantana rhodesiensis; polyphenol content; flavonoid content; antioxidant activity;
anti-malarial activity; flavones
1. Introduction
Lantana rhodesiensis (L. rhodesiensis) is an aromatic plant used in traditional medicine to treat many diseases, such as rheumatism, diabetes mellitus [1], malaria [2], cancer [3], congestive heart failure, and cardiac arrhythmia [4,5]. It is a woody herb or small shrub less than 2 m high, often with several stems, and without thorns, native to subtropical and tropical regions. L. rhodesiensis can be found in many African countries, such as Tanzania,
Citation: Nea, F.; Bitchi, M.B.;
Genva, M.; Ledoux, A.; Tchinda, A.T.; Damblon, C.; Frederich, M.; Tonzibo, Z.F.; Fauconnier, M.-L. Phytochemical Investigation and Biological Activities of Lantana
rhodesiensis. Molecules 2021, 26, 846.
https://doi.org/10.3390/ molecules26040846
Academic Editors: Simona Fabroni, Krystian Marszałek and Aldo Todaro
Received: 8 January 2021 Accepted: 3 February 2021 Published: 5 February 2021
Publisher’s Note: MDPI stays
neu-tral with regard to jurisdictional claims in published maps and insti-tutional affiliations.
Copyright: © 2021 by the authors.
Li-censee MDPI, Basel, Switzerland. This article is an open access article distributed under the terms and con-ditions of the Creative Commons At-tribution (CC BY) license (http://crea-tivecommons.org/licenses/by/4.0/).
Kenya, Rwanda, Ethiopia, Malawi, Cameroon, Sudan, Burkina Faso, and Côte d'Ivoire [1,6].
Several studies have already tried to correlate the traditional uses of this plant with its biological activities and chemical composition. As an example, aqueous extracts of L. rhodesiensis were screened for their hypoglycemic activities in alloxan-induced diabetic rats, with results confirming the antidiabetic activity of L. rhodesiensis when therapeutic doses were administered intra-peritoneally and orally [1]. In order to justify its traditional use for the treatment of cancer, the antiproliferative activity of L. rhodesiensis was evalu-ated. The results showed that L. rhodesiensis is not genotoxic and that this plant induces a strong antiproliferative effect against cancer cells in vitro. The high antioxidant activity of L. rhodesiensis methanol extracts [3] and decoctions [7] was also highlighted using DPPH method. In those studies, the methanol extracts contained high quantities of tannins and flavonoids and the decoctions were characterized by high total phenolic contents with low flavonoid quantities. L. rhodesiensis also showed significant repellency against Anopheles gambiae sensu lato Giles, the main vector of malaria in Africa [8]. Leaf essential oils from L. rhodesiensis have been extensively studied and shown to possess robust anti-inflammatory and antioxidant activity [9], which originates from their high content of phenolic com-pounds [10]. Studies have also shown that L. rhodesiensis contains triterpenes, steroids, phenols, alkaloids, polyphenols including flavonoids, and tannins [1–4,11]. Two polymethoxyflavones, 5,6,7,3’,4’,5’-hexamethoxyflavone and its analogue 5-hydroxy-6,7,3’,4’,5’-pentamethoxyflavone, were isolated from the whole plant of L. rhodesiensis [12].
The main purpose of the present research was to correlate the traditional medicine uses of L. rhodesiensis for treating rheumatism and malaria with the phytochemical com-position of L. rhodesiensis extracts obtained from each plant organ and with their antioxi-dant and anti-malarial activities. The different plant organs were considered separately in order to determine the most active part of the plant. Finally, four major flavonoids were isolated from L. rhodesiensis leaves and their structures were determined, as well as their antioxidant activities.
2. Results and Discussion
2.1. Phytochemical Screening
2.1.1. Determination of Phytochemical Classes
The results of the qualitative phytochemical study of L. rhodesiensis organs (Table 1) showed that the leaf, stem, and root extracts of L. rhodesiensis contained polyphenols in-cluding flavonoids and tannins. Terpenes, sterols, saponins, and alkaloids were also de-tected in all the organs, while leuco-anthocyanins and anthocyanins were too low to be detectable. The results also highlighted considerable differences in the phytochemical classes found in the different plant organs, as the assays indicated higher levels of flavo-noids and polyphenols in leaves than in stems and roots. Moreover, the results also indi-cated higher proportions of saponins in roots than in leaves and stems. The phytochemical classes detected in the leaf extract are in agreement with those already described in an aqueous leaf extract [1]. Moreover, the realized assays indicated a higher proportion of tannins in the methanolic extracts from the aerial parts (stems and leaves) in comparison with sterols/triterpenes, flavonoids, and saponins [3]. This is the first systematic phyto-chemical screening of L. rhodesiensis stems and roots.
Table 1. Phytochemical screening of L. rhodesiensis organs.
Phytochemical Classes Test Performed Leaves Stems Roots
Polyphenols Iron chloride 2% +++ ++ +
Flavonoids Cyanidin +++ + +
Terpenes/sterols Lieberman and Bürchard ++ + ++
Tannins catechin Stiasny ++ + +
gallic Stiasny ++ ++ +
Saponins Foam formation + + ++
Alkaloids Dragendorff + + +
Leuco-anthocyanins Cyanidin - - -
Anthocyanins Cyanidin - - -
Note: (-): not detectable, (+): low amounts, (++): high amounts, and (+++): very high amounts.
2.1.2. Polyphenolic Compound Quantification
Quercetin (coefficient of determination (R²) = 0.9996) and gallic acid (R² = 0.9975) cal-ibration curves were performed in order to determine the phenolic compound concentra-tions in the extracts. Total polyphenol contents (Table 2) ranged from 153.37 ± 0.61 to 273.27 ± 0.48 mg gallic acid equivalents (GAE)/g extract; the highest content was obtained with the leaf extract. For the total flavonoid assay, the contents ranged from 34.87 ± 0.34 to 110.54 ± 0.46 mg quercetin equivalents (QE)/g extract. Similarly, the leaf extract had the highest content, showing that L. rhodesiensis leaves are richer in polyphenols including flavonoids and tannins than the stems and roots. The lowest contents of total polyphenols and total flavonoids were observed in the root extract.
The determination of phenolic compounds in an aqueous extract of L. rhodesiensis leaves had been performed previously. The results obtained in that study showed that the amount of phenols (685.25 ± 30.77 mg GAE/g) was higher than that of tannins (323.61 ± 61.54 mg GAE/g) and flavonoids (187.33 ± 54.97 mg GAE/g) [1]. In addition, another study showed the total phenol (210.55 ± 7.5 mg GAE/g) and flavonoid (50.09 ± 1.9 mg QE/g) composition of the methanolic extract of leafy stems of L. rhodesiensis [11]. These results cannot be directly compared to those of the present study as the extracts, organs used, and the methods applied for the different tests are not the same. However, taking into account data from the literature, it can be said that the aqueous extract of L. rhodesiensis leaves is richer in phenolic compounds than the hydro-methanolic extract. On the other hand, the amount of total phenolic compounds in the methanolic extract of leaves and stems is lower than that of the leaf extract in our study.
A study using the same method to determine the total polyphenol content was car-ried out on leaf methanolic extracts of different Lantana camara varieties. Although it is not the same species, the results of two varieties (225.15 ± 12.52 and 232.99 ± 15.97 mg GAE/g extract) were found to be similar to those of the present study [13], highlighting the con-siderable interest in leaves from plants of the genus Lantana when searching for a source of polyphenolic compounds.
The protective effect of polyphenols has been attributed to their antioxidant proper-ties, which can prevent molecular oxidative damage and cellular disorders leading to var-ious pathologies such as cancer, Alzheimer's disease, type 2 diabetes, and cardiovascular and neurodegenerative diseases. Polyphenols are also capable of reducing other risk fac-tors for cardiovascular disease involved in metabolic syndrome (hyperglycemia, high li-pid levels, insulin resistance, abdominal obesity, and high blood pressure) [14].
Table 2. Polyphenolic compound assay results. GAE: gallic acid equivalents, QE: quercetin
equiv-alents (mean ± standard deviation of three independent tests).
Polyphenolic Compound Contents
Total Polyphenols (mg GAE/g Extract) Total Flavonoids (mg QE/g Extract)
Leaves 273.27 ± 0.48 110.54 ± 0.46
Stems 206.06 ± 0.87 52.95 ± 0.64
Roots 153.37 ± 0.61 34.87 ± 0.34
2.2. Antioxidant Activity
The antioxidant activity of the leaf, stem, and root of L. rhodesiensis extracts was eval-uated using three different methods on methanolic extracts at different concentrations (200-1000 µg/mL). Ascorbic acid was used as a standard and its activity was evaluated under the same conditions as the extracts.
The results of the DPPH radical scavenging test (Figure 1) show that the root extract had the lowest antioxidant activity (50% inhibition concentration, IC50 value: 561.36 ± 3.93
µg/mL), with higher antioxidant properties in the leaf (449.53 ± 0.56 µg/mL) and stem (512.81 ± 1.41 µg/mL) extracts. The ascorbic acid standard had an IC50 value of 122.09 ±
0.56 µg/mL.
The ability of phenolic compounds to reduce Fe3+ ions to Fe2+ was measured using
the FRAP (Ferric-reducing antioxidant power) method. The results show that the leaf and stem extracts had low IC50 values (117.08 ± 1.1 µg/mL and 119.57 ± 2.17 µg/mL,
respec-tively), similar to that of the ascorbic acid standard (108.01 ± 0.01 µg/mL), which confirms the ability of the extracts to reduce Fe3+ ions, to a greater extent than the root extract (130.04
± 2.19 µg/mL). The same trend was highlighted with the β-carotene, test as the leaf and stem extracts had low IC50 values (150.18 ± 1.21 µg/mL and 158.91 ± 2.65 µg/mL,
respec-tively), similar to that of ascorbic acid (IC50 = 137.55 ± 0.75 µg/mL), while the root extract
IC50 was higher (178.92 ± 3.56 µg/mL).
Figure 1. Antioxidant activity values of the methanolic extracts of L. rhodesiensis organs and
ascor-bic acid, (A). DPPH method, (B). FRAP (Ferric-reducing antioxidant power) method and (C). β-carotene method. Each result is the average of three values (n = 3). Histograms that do not share any letters are significantly different (p-value < 0.05).
A B C a b c d a c b b a d c b
Results obtained here are supported by a precedent study, showing that L. rhodesiensis methanolic extract dissolved in DMSO displayed a strong DPPH antioxidant activity, IC50 value of 5.96 ± 0.40 mg/mL [3]. The IC50 values obtained in the present study
are different to that previous assay, but the methods used in those two studies were sen-sibly different (different plant parts, extracts preparation methods, dilution solvent, con-centrations, volumes used, incubation time, etc.). In addition, a study has shown that us-ing the same DPPH method, EtOH extract from the leaves of Lantana montevidensis showed lower antioxidant activity (IC50 = 290.5 ± 1.97 µg/mL) than aqueous extract (IC50 =
108.2 ± 3.4 µg/mL) [15]. Methanol extracts of leaves and flowers from Lantana camara were also already tested for their antioxidant potential, both extracts exhibiting high antioxi-dant and free radical scavenging activities with relatively stronger antioxiantioxi-dant activity in the case of whole flower extracts [16].
These three antioxidant tests show that the leaf and stem extracts of L. rhodesiensis have robust antioxidant activity, with interesting perspectives for their potential valoriza-tion as pharmaceuticals.
The therapeutic effects of medicinal plants are generally attributed to their phyto-chemicals. Specifically, many studies have correlated the antioxidant activity of plant ex-tracts with the presence of phenolic compounds [17–20], as they are one of the main groups of molecules that act as primary antioxidants or free radical terminators [21]. The antioxidant potential of phenols is conferred by their hydroxyl (OH−) group [18], which is
directly linked to an aromatic hydrocarbon ring. This allows them to easily donate elec-trons to free radicals, and thus regulate their threat to living cells [22]. Generally, antioxi-dants (vitamins C, E, carotenoids, polyphenols) are important for good bone health. They neutralize reactive particles called free radicals that are associated with all inflammatory and painful phenomena [23]. The results obtained here show the high antioxidant prop-erties of L. rhodesiensis extracts. More specifically, important quantities of phenols were highlighted in the leaf extract, showing higher antioxidant properties compared to the stem and root extracts. The differences between the values are in order with their phenolic content.
The results of the DPPH test showed a considerable difference between the antioxi-dant activity (IC50) of the standard and each different organ extract studied, greater than
the results of the other tests (FRAP and bleaching of β-carotene), where minor differences were highlighted. This may have been influenced by the method or test used for the eval-uation of antioxidant activity, because each test has its specificities. The DPPH method is based on the measurement of antioxidant scavenging capacity towards the stable radical 2,2-diphenyl-1-picrylhydrazyl (DPPH). This method offers an easy and quick way to eval-uate the anti-radical activities of antioxidants, since the radical compound is stable and does not have to be generated as in other radical scavenging tests [24]. The FRAP method is based on the ability of an antioxidant to transfer an electron to reduce any compound, including metals, carbonyl groups and radicals [25]. As for the β-carotene bleaching method, it is based on the ability of an antioxidant to neutralize free radicals generated by linoleic acid and to prevent the oxidation of β-carotene [26]. Indeed, phenolic compounds exert their antioxidant activity by several mechanisms, including the donation of hydro-gen atoms to free radicals, or the trapping of other reactive species such as OH−, NO2−,
N2O3, ONOOH, and HOCl. Some phenolic compounds, mainly di- and polyphenols, can
react with O2− or bind to transition metal ions (especially iron and copper). This often
re-sults in weakly active forms to promote free radical reactions [27,28].
Phenols play important roles in plants, such as protection against herbivores and in-sect pathogens. They are involved in cementing the material linking phenolic polymers to cell wall polysaccharides [29]. In addition, they play a role in the regulation of cell growth and division [13,30]. Flavonoids are the most common and most important group of nat-urally occurring phenolic compounds, probably because of their wide range of functions. Flavonoids generally act through a scanning or chelation process. Flavonoids act as anti-oxidants by breaking radical chains in more stable products in the membranes of liver
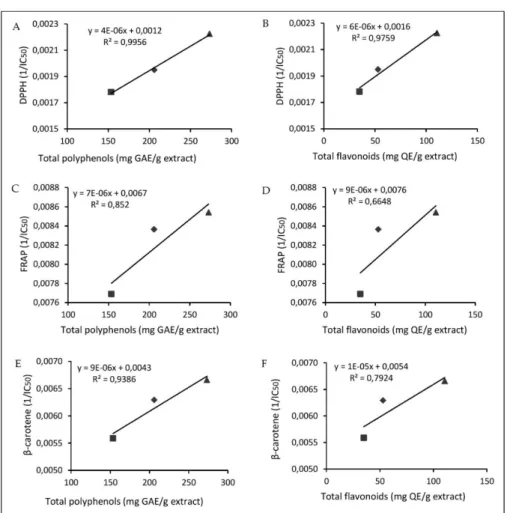
microsomes. They also play an important role in instinctive protection against oxidative stress [21,31–33]. In the present study, a positive linear correlation was established be-tween the content of phenolic compounds (total polyphenols including flavonoids and tannins; and total flavonoids) and the antioxidant activity of all extracts (Figure 2). The Pearson's correlation coefficient (r) and the coefficient of determination (R2) were higher
(r = 0.9978, R2 = 0.9956) between the total polyphenolic content and DPPH activity than
those of the total polyphenolic content and bleaching activity of β-carotene (r = 0.9688, R2
= 0.9386), followed by the total polyphenolic content and FRAP activity (r = 0.9230, R2 =
0.852). The correlation between the total flavonoid content and antioxidant capacity (DPPH test) was even higher (r = 0.9879, R2 = 0.9759). A moderate correlation (r = 0.8902,
R2 = 0.7924) was observed for the total flavonoid content and bleaching activity of
β-caro-tene. For FRAP activity, the correlation was lower (r = 0.8153, R2 = 0.6648).
Figure 2. (A). Correlation between the total polyphenolic content and DPPH activity; (B).
correla-tion between the total flavonoid content and DPPH activity; (C). correlacorrela-tion between the total pol-yphenolic content and FRAP activity; (D). correlation between the total flavonoid content and FRAP activity; (E). correlation between the total polyphenolic content and bleaching activity of β-carotene; (F). correlation between the total flavonoid content and bleaching activity of β-β-carotene; r: correlation coefficient and R2 : determination coefficient; roots ( ), stems ( ), leaves ( ).
The correlation between total polyphenols and antioxidant activity was the strongest, indicating that a high phenolic content correlates with higher antioxidant activity. Phe-nolic compounds are produced differently depending on the plant species [34]. In addi-tion, environmental factors, such as the drying technique, storage conditions, and the
plant organ used as the source and the moisture content are parameters that could influ-ence the phytochemical content of a plant [35,36]. Furthermore, the extraction process ap-pears to affect the total phenolic content and antioxidant activity of the plants [3,37–41]. A positive linear correlation was also established between the three different meth-ods used to evaluate antioxidant activity in this study. The Pearson correlation coefficient (r) for the DPPH and β-carotene assays (0.9558) was higher than that of the DPPH and FRAP assays (0.9140). However, the correlation between the FRAP method and the bleaching of β-carotene had a coefficient of 0.9929. These results indicate that the antioxi-dant activity values tested by the three different methods are highly correlated. Those results were expected as several others studies on plant extracts have confirmed the rela-tionship between antioxidant activities and polyphenolic compounds [42–44].
2.3. Anti-Malarial Activity
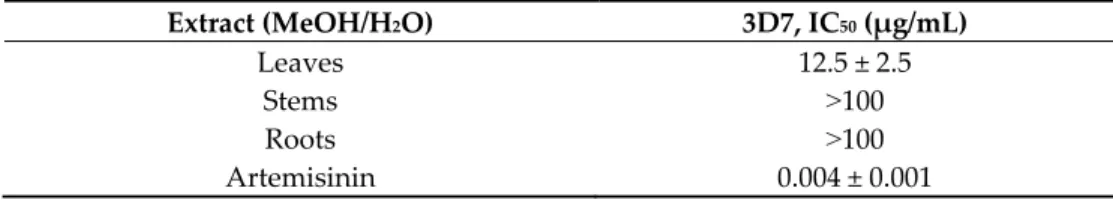
The hydro-methanolic extracts from the different L. rhodesiensis organs were tested on a chloroquino-sensitive strain (3D7) of Plasmodium falciparum in order to evaluate their in vitro anti-malarial activity. Artemisinin was used as a positive control. The concentra-tion that inhibited 50% of the strain (IC50) was determined using sigmoidal curves for each
extract (Table 3). The hydro-methanolic leaf extract was found to be active against Plasmo-dium falciparum strain 3D7, while the stem and root extracts were inactive. These results highlight, for the first time, the possible value of L. rhodesiensis leaves in traditional medi-cine for the treatment of malaria. L. camara leaves, a plant of the same genus, has been shown to have an IC50 value similar to that found in this study [45,46], highlighting the
interest of this plant genus for the treatment of malaria and encouraging further studies. Some studies argue that major phytochemical groups such as flavonoids, tannins, saponins, coumarins, alkaloids, triterpenes, sesquiterpenes and steroids [47–49] may be responsible for the anti-malarial activity observed in some plants. As an example, L. ca-mara aqueous and ethanolic leaf extracts have shown antimalarial activity close to that of the standard drug chloroquine. In that study, alkaloids, cardiac glycosides, saponins, car-bohydrates, flavonoids, steroids, tannins, and terpenoids were present in the different ex-tracts [50]. These phytochemical groups with anti-malarial potential are present in the leaves of L. rhodesiensis, as previously described.
Table 3. Results of the anti-malarial activity of the different extracts obtained by non-sequential
extraction (50% inhibition concentration, IC50).
Extract (MeOH/H2O) 3D7, IC50 (µg/mL)
Leaves 12.5 ± 2.5
Stems ˃100
Roots ˃100
Artemisinin 0.004 ± 0.001
2.4. Determination of the HPLC-PDA (photodiode array detector) Polyphenol Profile Leaf, Stem, and Root Extracts
The L. rhodesiensis leaf, stem, and root extracts were analyzed by HPLC-PDA. The major phenolic compounds were identified in each extract (Figure 3) based on their reten-tion index and their PDA spectrum with comparison to a library. Results showed that all extracts were characterized by high quantities of isomers of acteoside, a phenolic molecule well known for its wide range of biological properties including inflammatory, anti-oxidant and hepatoprotective activities [51–55].
Figure 3. HPLC-PDA (photodiode array detector) chromatograms of the chemical profiles of polyphenols occurring in the
studied extracts of leaves (A), stems (B), and roots (C). For each extract, the insert presents the PDA spectrum of the major peak and the PDA spectrum of the acteoside reference (in red).
2.5. Structural Elucidation
Compound 1 was obtained as yellow needles. The protonated mass, measured by LC/MS in positive mode electrospray ionization, was 346.9 [M+H]+, corresponding to the
formula C17H14O8. The 1H- and 13C-NMR data for compound 1 were quite similar to those
of compound 4. In the 1H NMR spectrum of compound 1 (Table 1), a signal at δH 7.12 (2H,
s) was attributed to two protons (H-2’, H-6’) of the B ring indicating oxygenation at C-3’, C-4’ and C-5’. Two singlets at δH 6.81 (1H) and at δH 6.59, were assigned to the 8 and
H-3 protons, respectively. These data as well as the intense signals at d H-3.99 and H-3.95 (both 3H, s), relative to two OCH3 groups, suggested presence of a tetrahydroxyflavone with
two additional methoxyl group substitutions [56,57]. The 13C NMR spectrum of
com-pound 1 (Table 1) shows values between 130–155 suggesting an oxygenated A-ring. After careful analysis of 2D NMR, the hydrogen group at C-5' in 3 was replaced by a hydroxy group in 1. So, in the HMBC spectrum, cross-peaks disclosing the bonding site of each methoxyl were observed: δH 3.99 correlated with δC 154.4 (C-7), and δH 3.95 correlated with
δC 148.5 (C-4’). Correlations were also observed between 3/C-1’, C-2, C-4 and C-10,
H-8/C-6, C-7, C-9 and C-10, H-2’ and H-6’/ C-2, C-1’, C-2’, C-4’, C-5’, C-6’. Consequently, the structure of compound 1 was determined to be the new 5,6,3’,5’-tétrahydroxy-7,4’-di-methoxyflavone, named rhodescine (Figure 1).
Compound 2, a white amorphous powder, possessed a molecular formula of C20H20O8 based on the protonated ion peak at m/z 388.9 by LC/MS, indicating seven
de-grees of unsaturation. The 1H-NMR (proton nuclear magnetic resonance) (Table 4)
dis-played resonances for three singlets at δH 7.12, 6.64, and 6.61 ppm, suggesting aromatic
ring hydrogens, and five singlets between δH 3.8 and 4.1 ppm, integrating for the three
protons characteristic of a methoxy group. The 13C-NMR (carbon-13 nuclear magnetic
res-onance, J-modulated) data exhibited in total 20 carbon resonances attributed to one ketone carbonyl carbon (δC 182.8), 11 quaternary carbons (singlet, δC 165–106), four carbons
(dou-blets, δC 105–90) suggesting C-H bonds and five carbons (singlet, δC 56–62) characteristic
of carbons linked to a methoxy group. Thus, the structure of compound 1 was established as 5-hydroxy-6,7,3’,4’,5’-pentamethoxyflavone (Figure 4). This result was compared to [58].
Compound 3 was found as colorless needles. Its molecular formula was C19H18O7
ac-cording to the protonated ion peak at m/z 358.1 [M + H]+. The 1H-NMR spectrum exhibited
signals for five aromatic ring hydrogens (δH 6.76 (1H, s), 6.89 (1H, s), 7.14 (1H, d, J = 8.5),
7.55 (1H, d, J = 2.2) and 7.68 (1H, dd, J = 8.5; 2.1)) and four methoxy groups [δH 3.85 (3H,
s), 4.00 (3H, s), 3.93 (3H, s) and 3.96 (3H, s)] (Table 4). The 13C-NMR spectrum of compound 2 exhibited 19 carbon resonances (Table 4). The 13C-NMR data for compound 3 were quite
similar to those of compound 2. However, on the 13C NMR spectrum of compound 3, there
were four signals characteristic of the carbons of the methoxy group. Compound 3 was identified as 5-hydroxy-6,7,3’,4’-tétraméthoxyflavone (Figure 4). The data were compared to [59].
Compound 4 was obtained as yellow needles. The high-resolution mass spectrum of compound 3 in positive mode electrospray ionization generated a protonated ion peak at m/z 331.0862. This is compatible with the elemental composition C17H14O7. The 1H-NMR
spectrum showed signals for five aromatic rings (δH 6.67 (1H, s), 6.85 (1H, s), 6.94 (1H, d,
J = 8.3), 7.54 (1H, dd, J = 8.3-2.13), and 7.52 (1H, d, J = 2.13)) and two methoxy groups (δH
4.00 (3H, s) and 3.97(3H, s)) (Table 4). The 13C-NMR spectrum of compound 3 exhibited in
total 17 carbon resonances (Table 4) attributed to one ketone carbonyl carbon (δC 182.9),
10 quaternary carbons (δC 167-104), five carbons (δC 122-92) suggesting C-H bonds and
two carbons of methoxy groups (δC 58.8 and 57.5). Compound 4 was characterized as
5,6,3’-trihydroxy-7,4’-dimethoxyflavone. The results were compared to [57].
All data of compounds 2, 3, and 4 were in good agreement with the respective liter-ature data.
Compound 2 (5-hydroxy-6,7,3’,4’,5’-pentamethoxyflavone) has been previously re-ported in extracts obtained from the whole L. rhodesiensis plant. This molecule shows in-teresting anti-proliferative and pro-apoptotic properties [12]. Compounds 3 and 4 were already reported in various plant organs from other genera [57,59–65], but were observed here for the first time in L. rhodesiensis (Figure 4).
In order to explain if the high antioxidant properties of L. rhodesiensis leaf extracts originates from the presence of those molecules in high proportions, the antioxidant ac-tivities of purified compounds 1, 2, 3, and 4 were evaluated in the present study. The re-sults showed that at a concentration of 1 mg/mL, compound 1 (97.92 ± 0.20%) inhibited DPPH better than compounds 2 (0.57 ± 0.04%), 3 (1.98 ± 0.64%), and 4 (61.77 ± 3.53%). The inhibition by compound 1 was similar to that of the standard drug used (ascorbic acid; %I = 98.50 ± 0.56).
Table 4. 1H and 13C NMR spectroscopic data for compounds 1-4 (500 MHz, MeOD).
1 2 3 4 δH m (J in Hz) δC δH m (J in Hz) δC δH m (J in Hz) δC δH m (J in Hz) δC 2 165.1 164.1 165.3 165.0 3 6.59, s 102.5 6.64, s 105.3 6.76, s 104.1 6.67, s 102.4 4 182.8 182.8 182.6 182.9 5 150.9 153.4 151.8 150.6 6 130.0 132.7 131.7 130.0 7 154.4 159.1 159.4 154.4 8 6.81, s 90.4 6.61, s 91.0 6.89, s 92.7 6.85, s 90.6 9 150.6 152.7 154.9 150.6 10 105.2 106.2 105.4 105.2 1' 121.4 126.5 122.0 122.4 2' 7.12, s 101.7 7.12, s 103.9 7.14, d (8.5) 111.1 7.52, d (2.13) 109.2 3' 138.5 153.7 152.5 150.7 4' 148.5 141.5 151.0 148.1 5' 145.7 153.7 7.55, d (2.2) 108.8 6.94, d (8.3) 115.4 6' 7.12, s 107.3 7.12, s 103.9 7.68, dd (8.5–2.2) 119.9 7.54, dd (8.3–2.13) 120.4 6-OCH3 4.00, s 61.1 3.85, s 61.1 7-OCH3 3.99, s 55.5 3.93, s 56,5 4.00, s 57.0 4.02, s 55.6 3'-OCH3 3.98, s 56,5 3.93, s 56.8 4'-OCH3 3.95, s 55.5 3.94, s 60.9 3.96, s 56.6 3.99, s 55.3 5'-OCH3 3.98 56,5
Compounds R1 R2 R3 R4
1 H OH OH OH
2 H OCH3 OCH3 OCH3
3 H OCH3 OCH3 H
4 H OH OH H
Figure 4. Molecular structure of purified flavones.
3. Materials and Methods
3.1. Plant Materials
Leaves, stems, and roots of Lantana rhodesiensis (L. rhodesiensis) were collected from the north of Côte d’Ivoire at Kapélé (9°25′60″ N, 5°42′0″ W). Sample collection occurred in the morning, from 9:00 to 12:00 a.m. The plant material was identified by Professor Ake Assi and a voucher specimen (N° UCJ017435) was deposited at the Centre National de Floristique (CNF, Abidjan, Côte d’Ivoire). Each plant organ was dried during one week at room temperature (25°C) and was subsequently ground into a fine powder using me-chanic ball mill, type BB-27 (E2ME). The final particle size was from a few tens to a few hundred micrometers and the moisture content was 8.5 ± 0.18% for leaves; 7.52 ± 0.64% for stems; and 6.01 ± 0.09% for roots. To determine the moisture content, the sample (organ powder) was weighed to the nearest 10 mg and dried in a drying oven at 70 °C. After 48 h, the moisture content was determined as followed:
% 𝑀𝑜𝑖𝑠𝑡𝑢𝑟𝑒 = 𝑚1 − 𝑚2 𝑚1 × 100
where m1 is mass of the organ powder before drying and m2 is mass of the organ powder after drying (n = 3).
3.2. Reagent and Solvents
All reagents and solvents were either HPLC or analytical grade. Moreover, 2,2-di-phenyl-1-picrylhydrazyl (DPPH), gallic acid (98%), quercetin (98%), artemisinin (98%), Folin–Ciocalteu reagent, ascorbic acid, β-carotene, and linoleic acid were purchased from Sigma-Aldrich (St. Louis, MO, USA). Anhydrous sodium sulfate, potassium ferricyanide, trichloroacetic acid (TCA), ferric chloride, sodium chloride, potassium chloride, disodium hydrogen phosphate, potassium dihydrogen phosphate, and hydrochloric acid were bought from VWR Chemicals (Radnor, PA, USA). Hexane, dichloromethane (CHCl3),
ethyl acetate (EtOAc) and methanol (technical and HPLC) were purchased from VWR International (Fontenay-sous-Bois, Val-de-Marne, France).
3.3. Determination of Phytochemical Classes
The different groups of compounds (sterols/terpenes, polyphenols, flavonoids, tan-nins, alkaloids, sapotan-nins, leuco-anthocyatan-nins, and anthocyanins) present in L. rhodesiensis leaf, stem, and root powders or extracts were identified using the methods described by Bekro et al., Bidie et al., and Nineza Claire and Nkengurutse Jacques [61–63].
To highlight sterols and terpenes, the reagent of Liebermann was used. Five mL of each organ extracts were evaporated on a water bath (100 °C). The residue was dissolved in 1 mL of acetic anhydride and 0.5 mL of concentrated sulfuric acid was added. The ap-pearance of a purple and violet ring at the interphase, turning blue and then green, indi-cated a positive reaction. The positive standard used is the cholesterol.
In order to highlight polyphenols, the reaction with ferric chloride (FeCl3) was used.
To 2 mL of each extract, a drop of 2% ferric chloride alcoholic solution was added. In the presence of polyphenol derivatives, ferric chloride causes the appearance of a dark blue-blackish or green coloration. The control is carried out with the alcoholic solution of gallic acid.
To highlight flavonoids, the “cyanidin'' reaction was used. Two mL of each extract were evaporated and the residue was taken up in 5 mL of hydrochloric alcohol diluted twice. Then, three magnesium shavings were added and a pinkish-orange or purplish col-oration was observed. By adding three drops of isoamyl alcohol, the colcol-oration was inten-sified. This confirmed the presence of flavonoids. An alcoholic solution of quercetin was used as a control.
The leuco-anthocyanins were characterized by performing the same reaction as for the identification of flavonoids without the addition of magnesium shavings by heating for 15 min in a water bath. The appearance of a cherry-red or purplish coloration indicates the presence of leuco-anthocyanins.
To characterize anthocyanins, 5 mL of sulfuric acid and then 5 mL of ammonium hydroxide are added to 5 mL of the extracts. If the coloration is accentuated by acidifica-tion and then changes to purplish blue in basic medium, the presence of anthocyanins can be concluded.
Catechic tannins were identified by Stiasny reagent (formol 30%, concentrated HCl: 1/0.5). Five mL of each extract was evaporated. After 15 mL of Stiasny reagent were added to the residue. The mixture was then kept in a water bath at 80 °C for 30 min. The obser-vation of a large flaky precipitate characterized the catechin tannins. The obtained solu-tion was filtered and the collected filtrate was saturated with sodium acetate. The addisolu-tion of three drops of 2% FeCl3 caused the appearance of an intense blue-black coloration,
in-dicating the presence of gallic tannins. An alcoholic solution of gallic acid was used as a control.
In order to highlight alkaloids, the Dragendorff (iodobismuthate) reagent was used. Six mL of each extract were evaporated to dryness. The residue was taken up again in 6 mL of alcohol at 60 °C. The addition of two drops of the Dragendorff reagent to the alcohol solution caused a precipitate or an orange coloration and indicated a positive reaction.
To highlight the saponins we used the method of foam appearance by agitation. A height of persistent foam, higher than 1 cm indicates the presence of saponosides. 3.4. Extract Preparation for the Determination of Total Phenolic and Flavonoid Contents and Tests for Biological Activity
A methanol:water (50:50, v/v) extract was obtained by stirring 100 g of each sample with 1.5 L of the solvent mixture at 25 °C and 150 rpm for 48 h. The extract was then filtered twice through cotton and once through WATTMAN 3 mm filter paper. The sol-vent was then evaporated at 40°C using a rotary evaporator and the residue was subse-quently lyophilized. The obtained powder was used to carry out the biological tests. The extracts were prepared on the basis of the method described by MacDonald et al. [18]. 3.5. Determination of the Total Phenolic Content
The total phenolic content of the extracts was evaluated using the Folin-Ciocalteu method according to the Shahidi and Naczk procedure [66] with MacDonald et al. modi-fications [18]. Briefly, a gallic acid calibration curve was established (0, 50, 100, 150, 200, 250 mg/L) in methanol:water (50:50, v/v). Leaf, stem and root extracts were prepared in methanol:water (50:50, v/v) at a concentration of 3 mg/mL. Then, 0.5 mL of each sample or phenolic standard was mixed with 2.5 mL of Folin–Ciocalteu reagent (diluted 1:10 with distilled water) and 2 mL of aqueous sodium carbonate solution (1 M). The tubes were allowed to stand for 15 min at room temperature before the absorbance of the mixture was measured at 765 nm using a spectrophotometer. All determinations were performed in triplicate.
The total phenolic content was calculated as gallic acid equivalents (GAE) by the fol-lowing:
where T is the total phenolic content in mg/g of the extracts as GAE, C is the concentration of gallic acid established from the calibration curve in mg/mL, V is the volume of the ex-tract solution in mL and M is the weight of the exex-tract in g.
3.6. Determination of the Total Flavonoid Content
The total flavonoid content of the extract was determined as previously described [31,42,67]. Different concentrations (0.01–0.2 mg/mL) of quercetin, the standard molecule, were prepared in methanol. Organ extracts were also diluted in methanol (3 mg/mL). Then, 0.5 mL of methanolic samples and standards was added to 0.5 mL of aluminum chloride 10% (w/v). The same volume of sodium acetate (1 M) was added to the solution, which was then brought up to 3500 µL with distilled water. After incubation at room tem-perature for 30 min, the absorbance was measured at 415 nm. All determinations were carried out in triplicate. The total flavonoid content (TFC) is presented as mg of quercetin equivalents (QE) per gram of the extract.
The total flavonoid content was calculated as quercetin equivalents (QE) by the fol-lowing:
𝑇 = 𝐶 × 𝑀𝑉
where T is the total flavonoid content in mg/g of the extracts as QE, C is the concentration of quercetin established from the calibration curve in mg/mL, V is the volume of the ex-tract solution in mL and M is the weight of the exex-tract in g.
3.7. Antioxidant Activity
3.7.1. DPPH Radical Scavenging Assay
The antioxidant activities were measured in terms of hydrogen-donating or radical-scavenging ability, using the stable radical 2,2-diphenyl-1-picrylhydrazyl (DPPH) as a re-agent [67]. To do so, various concentrations (200, 400, 600, 800, 1000 µg/mL) of each L. rhodesiensis organ extract and ascorbic acid were prepared in methanol. Then, 50 µL of each sample concentration was added to 2 mL of a 0.004% (w/v) DPPH methanolic solu-tion. After 30 min of incubation at room temperature in the dark, absorbance was meas-ured at 517 nm using an Ultrospec UV-visible dual beam spectrophotometer (GE Healthcare, Cambridge, UK). A blank sample containing the same amount of methanol and DPPH solution was used as the negative control. All determinations were performed in triplicate.
The inhibition percentage (%I) of the DPPH radical by the samples was calculated according to the formula [68]:
%𝐼 = 𝐴𝑏 − 𝐴𝑎 𝐴𝑏 × 100
where Ab is the absorbance of the blank sample and Aa is the absorbance of the test sam-ple.
The inhibition percentage was plotted versus the sample concentration to obtain the IC50 index.
3.7.2. Reducing Power
The reducing power of the extracts and a standard (ascorbic acid) was determined by mixing 1 mL of the extract or standard at different concentrations in methanol (200 to 1000 µg/mL) with 1 mL of phosphate buffer (0.2 M, pH 6.6) and 1 mL of potassium ferri-cyanide [K3Fe(CN)6] solution (1%, w/v). The mixture was incubated at 50 °C for 20 min.
After incubation, 1 mL of trichloroacetic acid (TCA) (10% v/v) was added to the solution to stop the reaction. This solution was then centrifuged at 3000 g for 10 min at room tem-perature. The supernatant was recovered and mixed with distilled water (1.0 mL) and 0.1% FeCl3 (150 µL). Then, the absorbance was measured at 700 nm. Higher absorbance of
the reaction mixture (according to the blank) indicates greater reducing power. This de-termination was made according to a published protocol [69] with some modifications. The inhibition percentage (%I) was calculated according to the formula:
%𝐼 = 𝐴𝑏 − 𝐴𝑎𝐴𝑏 × 100
where Ab is the absorbance of the blank sample and Aa is the absorbance of the test sam-ple.
The inhibition percentage was plotted versus the sample concentration to obtain the IC50 index.
3.7.3. β-Carotene Blanching Test
The β-carotene/linoleic acid test evaluates the inhibitory effect of a compound or a mixture on β-carotene oxidation in the presence of molecular oxygen (O2) and gives an
estimation of the antioxidant potential of the sample.
As previously described [70], a mixture of β-carotene and linoleic acid was prepared by adding together 0.5 mg of β-carotene, 25 µL of linoleic acid and 200 mg of Tween-40 in 1 mL of chloroform. The chloroform was then completely evaporated under vacuum and 100 mL of oxygenated water was subsequently added to the residue and mixed to form a clear yellowish emulsion. Then, 350 µL of various sample concentrations (200, 400, 600, 800, 1000 µg/mL) in methanol (extracts and ascorbic acid) was added to 2.5 mL of the above emulsion and mixed. The test tubes were incubated in a water bath at 50 °C for 2 h together with a negative control (blank) containing pure methanol instead of sample. The absorbance values were measured at 470 nm.
The antioxidant activity (percentage inhibition, % I) of the samples was calculated as follows:
%𝐼 = 𝐴 (𝛽 − 𝑐𝑎𝑟𝑜𝑡𝑒𝑛𝑒 𝑎𝑓𝑡𝑒𝑟 2 ℎ 𝑎𝑠𝑠𝑎𝑦)𝐴 (𝑖𝑛𝑖𝑡𝑖𝑎𝑙 𝛽 − 𝑐𝑎𝑟𝑜𝑡𝑒𝑛𝑒) × 100
where A (β-carotene after 2 h assay) is the absorbance value of β-carotene remaining in the samples, after the 2 h assay whereas A (initial carotene) is the absorbance value of β-carotene in the freshly prepared standard solution. The activity was calculated as 50% inhibition concentration (IC50). All experiments were repeated three times on independent
samples and the data are expressed as mean ± standard deviation (SD). 3.8. Anti-Malarial Activity
The anti-malarial activity was determined as previously described [71]. The asexual erythrocyte stages of P. falciparum, chloroquine-sensitive strain 3D7 were maintained in continuous in vitro culture, according the procedure of Trager and Jensen. The host eryth-rocytes were A+ human red blood cells obtained from a patient from Schiphol in the Neth-erlands (BEI Reagent Search) [72]. Crude extract solutions were prepared in DMSO (Sigma-Aldrich, Darmstadt, Germany, D-4540) at 10 mg/mL (or 1 mg extract diluted in 100 µL DMSO). The extract solutions were diluted 10 times in ready-to-use culture me-dium to give a 1 mg/mL solution. In a 96-well plate, each test sample was applied in a series of eight two-fold dilutions and tested in triplicate. Parasitemia was 2% and hema-tocrit was 1%, as described by Murebwayire et al. [73]. Infected red blood cells were used as a positive growth control and unparasitized red blood cells were used as a negative (blank) control. Artemisinin 98% (Sigma-Aldrich, Machelen, Belgium) at an initial concen-tration of 100 ng/mL was used as a positive control in all experiments. The plate was in-cubated for 48 h at 37 °C in a hermetically sealed culture dish impregnated with a GENbox microaer gasbag (bioMerieux, 96125) to generate a microaerobic medium. It was then kept at –20°C for 24 h after the 48-h incubation and thawed at 37 °C for 45 min. Then, 20 µL of each homogenized well was transferred to a new 96-well plate and 100 µL of a solution consisting of 1 mL Triton X-100 (Sigma, X100), 10 mg saponin (Merck, A18820), 1 g lithium
L-lactate (Sigma, L2250), and 200 mg APAD (Sigma, A5251)/100 mL TRIS pH 8 buffer (Sigma, Darmstadt, Germany, T6664) was added. The new 96-well plate was incubated for 15 min at 37 °C, then 20 µL of a solution mixture prepared from 1 mL of a NTB solution (nitro-blue tetrazolium chloride; Sigma, Darmstadt, Germany, N6639) (2 mg/mL) in dis-tilled water and 1 mL of a PES solution (phenazine ethosulfate; Sigma, P4544) (0.1 mg/mL) in TRIS pH 8 buffer were added protected from light and incubated for 30 to 45 min at 37 °C. Parasite growth was estimated by the determination of lactate dehydrogenase (LDH) activity, using the colorimetric method described in 1993 by Makler et al. [74,75]. Absorb-ance was measured with a spectrophotometer (Stat Fax 2100, Fisher, Illkirch, FrAbsorb-ance) at 630 nm. The intensity of coloration is proportional to the amount of enzyme present in the reaction medium and, thus, to the amount of parasites. The IC50 values were calculated
from the graphs.
3.9. Statistical Analysis of Biological Data
Data are expressed as means ± S.D; for the statistical analysis, ANOVA followed by Tukey’s test was used GraphPad Prism. Statistically significant differences were consid-ered for p-values < 0.05. Pearson’s method was used to determine correlations.
3.10. Extraction, Isolation, and Characterization of Compounds
To better understand the origin of the reported biological activities of the leaf hydro-methanolic extract of L. rhodesiensis, the four flavones present in highest concentration in the methanolic extract were isolated and characterized. To do so, 1.0 kg of dry L. rhodesiensis leaves was ground and mixed with 15 L MeOH/H2O (50/50, v/v). The extract
solution was concentrated under vacuum to give a dark-brown residue (122 g). Eighty-five grams of the residue was suspended in MeOH/H2O (850 mL). This solution was
suc-cessively partitioned with solvents of increasing polarity such as hexane, dichloromethane (CHCl3) and ethyl acetate (EtOAc) (1.0 L: 2 × 500 mL each). The EtOAc fraction (22.7 g)
was purified over a silica gel CC with stepwise CHCl3-EtOAc solvents (30:0 to 70:100) and
stepwise EtOAc-MeOH solvents (95:0 to 5:100) to obtain eight subfractions (FAE.1-FAE.8), after combining the eluates on the basis of TLC (Thin-layer chromatography) analysis. Subfraction FAE.2 (2.5 g) was separated using preparative HPLC with an ACN-H2O +
0.1% HFO (20–40% ACN) solvent system for 25 min to afford compound 1 (4.8 mg). In addition, the CHCl3 fraction (10.7 g) was purified on a silica gel chromatographic column
(CC) with a gradient of CHCl3-EtOAc solvents (70:0 to 30:100) and stepwise EtOAc-MeOH
solvents (90:0 to 10:100) to obtain 24 eluates. Deposits were obtained from subfractions FD1p, FD2p, FD3p, FD5p, FD6p, FD7p, FD12p, and FD13p. Other subfractions (FDM.1-FDM.10) were obtained after eluates were combined according to the TLC analysis. The subfractions FD1p, FD2p and FD3p were separated using preparative HPLC with an ACN-H2O + 0.1% H3PO4 (20–100% ACN) solvent system for 25 min to afford compound 2
(16.7 mg) and compound 3 (7.0 mg). Subfraction FDM.5 was also subjected to preparative HPLC with an ACN-H2O + 0.1% H3PO4 (35–45% ACN) solvent system to yield compound 4 (13.0 mg)
The structures of the compounds were established by spectral analysis, mainly HR ESI-MS, Q-TOF, 1H, 13C and 2D-NMR (COSY, HSQC, and HMBC), as well as by
compar-ing their spectroscopic data with those reported in the literature. Compound 1 (yellow needles):
1H-NMR (MeOH-d4, 500 MHz) δ: 7.12 (2H, s, H-2’, H-6’), 6.81(1H, s, H-8), 6.59 (1H,
s, H-3), 3.99, 3.95 (3H each, both s, OMe-7, OMe-4’). 13C-NMR (MeOH-d4, 126 MHz) δ:
182.8 (C-4), 165.1 (C-2), 154.4 (C-7), 150.6 (C-9), 150.9 (C-5), 148.5 (C-4’), 145.7 (C-5’), 138.5 3’), 102.5 3), 130.0 6), 121.4 1’), 107.3 6’), 105.2 10), 101.7 2’), 90.4 (C-8), 55.5, 55.5 (OMe-7, OMe-4’). HR-ESI-MS m/z 346.9 ((M+H)+, 100%).
Compound 2 (white, amorphous powder):
1NMR (MeOd4, 500 MHz) δ: 7.12 (2H, s, 2’, 6’), 6.64*, 6.61* (1H, each, s,
180.8 (C-4), 164.17 (C-2), 159.09 (C-7), 153.69 (C-3’, C-5’), 153.48 (C-5), 152.73 (C-9), 141.53 4’), 132.76 6), 126.58 1’), 106.19 10), 105.38 3), 103.96 2’, C-6’), 91.00 (C-8), 61.15 (OMe-6), 60.98 (OMe-4’), 56,50 (OMe-3’, OMe-5’, OMe-7); HR-ESI-MS m/z: = 388.9 (M + H)+. An asterisk (*) means that the values may be interchanged.
Compound 3 (colorless needles):
1H-NMR (MeOH-d4, 500 MHz, d, ppm, J/Hz): 3.96 (3H, s, 4′), 3.93 (3H, s,
OMe-3′), 3.85 (3H, s, OMe-6), 4.00 (3H, s, OMe-7), 6.76 (1H, s, H-3), 6.89 (1H, s, H-8), 7.55 (1H, d, J = 2.2, H-5′), 7.14 (1H, d, J = 8.5, H-2′), 7.68 (1H, dd, J = 8.5; 2.1, H-6′). 13C-NMR
(MeOH-d4, 126 MHz, d) 56.6 (OMe-4′), 56.8 (OMe-3′), 57.0 (OMe-7), 61.1 (OMe-6), 92.4 (C-8), 104.7 3), 106.8 10), 110.6 5′), 112.8 2′), 124.8 1′), 121.7 6′), 133.8 6), 151.0 (C-4′), 154.1 (C-3′), 151.8 (C-5), 154.9 (C-9), 161.0 (C-7), 166.0 (C-2), 184.2 (C-4). Mass spectrum Q-TOF, C19H18O7 m/z 358.1 (M + H)+, Wiley library score 97.65%.
Compound 4 (yellow needles):
lH-NMR (MeOH-d4, 500 MHz) δ: 7.52 (1H, d, H-2’), 7.54 (1H, dd, H-6’), 6.94 (1H, d,
H-5’), 6.85 (1H, d, H-8), 6.67 (1H, d, H-3), 4.00, 3.97 (3H, s, OMe-7, OMe-4’). 13C-NMR
(MeOH-d4, 126 MHz) δ: 182.9 (C-4), 165.0 (C-2), 154.4 (C7), 150.7 (C-3’), 150.6 (C-5, C-9), 148.1 (C-4’), 130.0 (C-6), 122.4 (C-l’), 120.4 (C-6’), 115.4 (C-5’), 109.2 (C-2’), 105.2 (C-10), 102.4 (C-3), 90.6 (C-8), 55.6 (OMe-7), 55.3 (OMe-4’). HR-ESI-MS m/z 331.0862 ((M+H)+,
100%), Q-TOF C17H14O7.
The antioxidant potential of all purified compounds was determined based on the DPPH method.
3.11. General Procedure for the Determination of Compounds
1H and 13C NMR (proton and carbon nuclear magnetic resonance) spectra were
rec-orded in MeOH-d4 on a Bruker NEO 500 MHz spectrometer equipped with a cryoprobe. 2D experiments were performed using standard Bruker microprograms. The heteronu-clear multiple bond correlation (HMBC) spectrum analysis allowed us to confirm the po-sition of carbonyl, methoxy and C-H correlations. The heteronuclear single quantum co-herence (HSQC) spectrum analysis allowed us to identify C-H correlations. LC/MS was carried out on a Thermo Scientific LTQ orbitrap XL mass spectrometer with an ESI source in positive mode with an RP select B LiChrospher 60 (250 mm × 4.6 mm, 5 µm) column. A chromatography Interchim puriFlash 4250 equipped with a Büchi fraction collector C-660 unit was used to accomplish the preparative isolation. An Agilent Technologies G1311B 1260 quant pump apparatus equipped with a PDA detector and a C18 column (Agilent, Santa Clara, CA, USA, Eclipse XDB-C18; 3.5 µm; 4.6 × 150 mm) were employed for ana-lytical HPLC. HPLC-PDA determination of the chemical profiles of polyphenols in the studied extracts of leaves, stems, and roots were performed using a gradient of methanol and 0.05% trifluoroacetic acid (1 mL/min). Analytical TLC was used during the extraction and purification procedures in order to confirm the presence of polyphenol and flavonoid molecules in the different fractions. TLC was performed on pre-coated Silica gel 60 F254 (Merck, Hohenbrunn, Germany) plates. After development with EtOAc/formic acid/HOAc/H2O (100:11:11:26), the dried plates were sprayed with NP-PEG [natural
prod-uct reagent (1% diphenylboryloxyethylamine in MeOH) and polyethylene glycol 4000 (5% polyethylene glycol 4000 in EtOH)]. The plates were dried again and examined under ul-traviolet light (366 nm).
4. Conclusions
In the present study, different L. rhodesiensis organs were submitted to hydro-meth-anolic extraction and the antioxidant and anti-malarial activities of those extracts were evaluated. The present study showed variable results depending on the plant organ. Leaf and stem extracts showed an interesting phenolic compound content correlated with ro-bust antioxidant and anti-malarial activities, while the root extract displayed lower activ-ities. As antioxidant molecules are able to neutralize reactive particles called free radicals that are associated with inflammatory and painful phenomena, the antioxidant activities
of L. rhodesiensis extracts support the claim regarding the traditional use of this plant for the treatment of various affections, such as rheumatism.
Hence, L. rhodesiensis is a potential source for isolating new exogenous antioxidant and anti-malarial molecules. Moreover, this is the first report on the in vitro anti-malarial activity of L. rhodesiensis. Four compounds were isolated from the L. rhodesiensis leaf ex-tract. Compounds 1, 3, and 4 were reported for the first time in this plant. Compound 1, which displayed the highest number of free hydroxyl groups on the benzene rings among all the purified molecules, had a high antioxidant potential, whereas compound 4 dis-played an average potential. This study reported one new flavone isolated from the leaves of L. rhodesiensis (compound 1). Further anti-malarial tests supported by bioassay-guided isolation of the active compounds in the leaf extract are suggested. Moreover, as the bio-logical activities were highlighted here using in vitro assays, it is necessary to confirm them in vivo. In the next part of our study, we plan to evaluate the antioxidant and anti-malarial activity of the isolated flavonoid compounds
L. rhodesiensis is a plant that is widely present in tropical and sub-tropical regions. However, it should be noted that if the local population uses it extensively for its biologi-cal properties, it would be important to cultivate it in order to avoid its loss. Moreover, it would be interesting to study the variability in extract compositions and in the biological activities of plants grown in different locations and seasons, as it is known that the culture conditions can widely impact the production of secondary metabolites by plants.
Author Contributions: conceptualization, F.N., Z.F.T., and M.-L.F.; data curation, F.N., M.B.B.,
M.G., A.L., A.T.T., C.D., and M.F.; formal analysis, F.N.; funding acquisition, Z.F.T., and M.-L.F.; investigation, F.N., M.B.B., and A.L.; methodology, F.N.; project administration, Z.F.T., and M.-L.F.; resources, F.N., and M.-L.F.; software, F.N., M.B.B., M.G., and A.T.T.; supervision, M.F., Z.F.T., and M.-L.F.; validation, C.D., Z.F.T., and M.-L.F.; visualization, F.N., M.B.B., M.G., and A.T.T.; writing— original draft, F.N., M.B.B., and M.G.; writing—review and editing, M.G., C.D., M.F., Z.F.T., and M.-L.F. All authors have read and agreed to the published version of the manuscript.
Funding: This research was funded by the Education, Audiovisual, and Culture Executive Agency
(EACEA), through EOHUB project 600873EPP-1-2018-1ES-EPPKA2-KA.
Data Availability Statement: Data is contained within the article.
Acknowledgments: The authors wish to thank the members of the Laboratory of Constitution and
Reaction of Matter of the University Felix Houphouet Boigny, Abidjan, Cocody (Côte d’Ivoire), and all of the laboratory staff at the Chemistry of Natural Molecules, University of Liege, Gembloux Agro-Bio Tech (Belgium) for their availability and scientific contribution, particularly Thomas Ber-trand, Danny Trisman, and Franck Michels. This research was supported by the “Fondation Uni-versitaire de Belgique” (Belgian University Foundation).
Conflicts of Interest: The authors declare no conflict of interest.
Sample Availability: Samples of the compounds are available from the authors in very small amount.
References
1. Ngugi, P.M.; Kimuni, N.; Ngeranwa, N.; Orinda, O.; Njagi, M.; Maina, D.; Agyirifo, S.; Gathumbi, K.; King’e, W.; Eliud, E.N. Antidiabetic and Safety of Lantana rhodesiensis in Alloxan Induced Diabetic Rats. J. Dev. Drugs 2015, 4, 1–10.
2. Fratkin, E. Traditional medicine and concepts of healing among Samburu pastoralists of Kenya. J. Ethnobiol. 1996, 16, 63–97. 3. Sawadogo, W.R.; Maciuk, A.; Banzouzi, J.T.; Champy, P.; Figadere, B.; Guissou, I.P.; Nacoulma, O.G. Mutagenic effect,
antioxi-dant and anticancer activities of six medicinal plants from Burkina Faso. Nat. Prod. Res. 2012, 26, 575–579.
4. Jean, B.M.; Nâg-Tiero, M.R.; Martin, K.; Germaine, N.O.; Norma, A.-A. A review on Lantana rhodesiensis Moldenke: Traditional uses, phytochemical constituents and pharmacological activities. Int. J. Phytomed. 2017, 9, 1–9.
5. Edeoga, H.O.; Okwu, D.E.; Mbaebie, B.O. Phytochemical constituents of some Nigerian medicinal plants. Afr. J. Biotechnol. 2005, 4, 685–688.
6. Ruffo, C.K.; Birnie, A.; Tengnäs, B. Edible Wild Plants of Tanzania; 2002; ISBN 0-947643-51-6.
7. Jean, B.M.; Alfonso, R.-M.; Hervé, C.T.; Véronique, M.; Germaine, N.O. Phytochemistry investigation and antioxidant activity of four edible Verbenaceae of Burkina Faso. Int. J. Phytomed. 2017, 9, 655.
8. Seyoum, A.; Killeen, G.F.; Kabiru, E.W.; Knols, B.G.J.; Hassanali, A. Field efficacy of thermally expelled or live potted repellent plants against African malaria vectors in western Kenya. Trop. Med. Int. Health 2003, 8, 1005–1011.
9. Nea, F.; Amenan, E.; Leon, E.; Kenne, T.; Genva, M.; Saive, M.; Felix, Z.; Fauconnier, M. A new chemotype of Lantana rhodesien-sis Moldenke essential oil from Côte d’Ivoire: Chemical composition and biological activities. Ind. Crops Prod. 2019, 141, 111766. 10. Zheng, W.; Wang, S.Y. Antioxidant activity and phenolic compounds in selected herbs. J. Agric. Food Chem. 2001, 49, 5165–5170. 11. Bangou, M.J.; Kiendrebeogo, M.; Compaoré, M.; Coulibaly, A.Y.; Meda, N.-T.R.; Abarca, N.A.; Zeba, B.; Millogo-Rasolodimby, J.; Nacoulma, O.G. Enzyme Inhibition Effect and Polyphenolic Content of Medicinal Plant Extracts from Burkina Faso. J. Biol. Sci. 2011, 31–38.
12. Sawadogo, W.R.; Cerella, C.; Al-mourabit, A.; Moriou, C.; Teiten, M.; Guissou, I.P.; Dicato, M.; Diederich, M. Cytotoxic , Anti-proliferative and Pro-Apoptotic Effects of 5-Hydroxyl-6,7,3’,4’,5’-Pentamethoxyflavone Isolated from Lantana ukambensis. Nu-trients 2015, 7, 10388–10397.
13. Kumar, S.; Sandhir, R.; Ojha, S. Evaluation of antioxidant activity and total phenol in different varieties of Lantana camara leaves. BMC Res. Notes 2014, 7, 1–9.
14. Amiot, M.J.; Riollet, C.; Landrier, J.F. Polyphénols et syndrome métabolique. Med. Mal. Metab. 2009, 3, 476–482.
15. Barros, L.M.; Duarte, A.E.; Waczuk, E.P.; Roversi, K.; Da Cunha, F.A.B.; Rolon, M.; Coronel, C.; Gomez, M.C.V.; De Menezes, I.R.A.; Da Costa, J.G.M.; et al. Safety assessment and antioxidant activity of lantana montevidensis leaves: Contribution to its phytochemical and pharmacological activity. EXCLI J. 2017, 16, 566–582.
16. Mansoori, A.; Singh, N.; Dubey, S.K.; Thakur, T.K.; Alkan, N.; Das, S.N.; Kumar, A. Phytochemical Characterization and As-sessment of Crude Extracts From Lantana camara L. for Antioxidant and Antimicrobial Activity. Front. Agron. 2020, 2, 1–14. 17. Roby, M.H.H.; Sarhan, M.A.; Selim, K.A.-H.; Khalel, K.I. Evaluation of antioxidant activity , total phenols and phenolic
com-pounds in thyme (Thymus vulgaris L.), sage (Salvia officinalis L.), and marjoram (Origanum majorana L.) extracts. Ind. Crops Prod.
2013, 43, 827–831.
18. McDonald, S.; Prenzler, P.D.; Antolovich, M.; Robards, K. Phenolic content and antioxidant activity of olive extracts. Food Chem.
2001, 73, 13–84.
19. Skotti, E.; Anastasaki, E.; Kanellou, G.; Polissiou, M.; Tarantilis, P.A. Total phenolic content, antioxidant activity and toxicity of aqueous extracts from selected Greek medicinal and aromatic plants. Ind. Crops. Prod. 2014, 53, 46–54.
20. Velioglu, Y.S.; Mazza, G.; Gao, L.; Oomah, B.D. Antioxidant Activity and Total Phenolics in Selected Fruits, Vegetables, and Grain Products. J. Agric. Food Chem. 1998, 46, 4113–4117.
21. Oriakhi, K.; Oikeh, E.I.; Ezeugwu, N.; Anoliefo, O.; Aguebor, O. Comparative Antioxidant Activities of Extracts of Vernonia amygdalina and Ocimum gratissimum Leaves. J. Agric. Sci. 2014, 6, 13–20.
22. Uyoh, E.A.; Chukwurah, P.N.; David, I.A.; Bassey, A.C. Evaluation of Antioxidant Capacity of Two Ocimum Species Consumed Locally as Spices in Nigeria as a Justification for Increased Domestication. Am. J. Plant Sci. 2013, 04, 222–230.
23. Arulselvan, P.; Fard, M.T.; Tan, W.S.; Gothai, S.; Fakurazi, S.; Norhaizan, M.E.; Kumar, S.S. Role of Antioxidants and Natural Products in Inflammation. Oxid. Med. Cell. Longev. 2016, 2016, 5276130.
24. Brand-Williams, W.; Cuvelier, M.E.; Berset, C. Use of a Free Radical Method to Evaluate Antioxidant Activity. Leb. Wiss. Technol.
1995, 28, 25–30.
25. Miguel, M.G. Antioxidant activity of medicinal and aromatic plants. A review. Flavour Fragr. J. 2010, 25, 291–312.
26. Kulisic, T.; Radonic, A.; Katalinic, V.; Milos, M. Use of different methods for testing antioxidative activity of oregano essential oil. Food Chem. 2004, 85, 633–640.
27. Taubert, D.; Breitenbach, T.; Lazar, A.; Censarek, P.; Harlfinger, S.; Berkels, R.; Klaus, W.; Roesen, R. Reaction rate constants of superoxide scavenging by plant antioxidants. Free Radic. Biol. Med. 2003, 35, 1599–1607.
28. Zin, Z.M.; Abdul Hamid, A.; Osman, A.; Saari, N. Antioxidative activities of chromatographic fractions obtained from root, fruit and leaf of Mengkudu (Morinda citrifolia L.). Food Chem. 2006, 94, 169–178.
29. Graham Wallace; Fry, S.C. Phenolic components of the primary cell wall. Inter. Rev. Cytol. 1994, 151, 229–267.
30. Binns, A.N.; Chen, R.H.; Wood, H.N.; Lynn, D.G. Cell division promoting activity of naturally occurring dehydrodiconiferyl glucosides: Do cell wall components control cell division? Proc. Natl. Acad. Sci. USA 1987, 84, 980–984.
31. Martial-didier, A.K.; Hubert, K.K.; Eugène, K.; Parfait, J.; Kablan, T. Phytochemical Properties and Proximate Composition of Papaya (Carica papaya L. var solo 8) Peels. Turk. J. Agric. Food Sci. Technol. 2017, 5, 676–680.
32. Arbaayah, H.; Umi Kalsom, Y. Antioxidant properties in the oyster mushrooms (Pleurotus spp.) and split gill mushroom (Schi-zophyllum commune) ethanolic extracts. Mycosphere 2013, 4, 661–673.
33. Gil, M.I.; Tomás-Barberán, F.A.; Hess-Pierce, B.; Kader, A.A. Antioxidant capacities, phenolic compounds, carotenoids, and vitamin C contents of nectarine, peach, and plum cultivars from California. J. Agric. Food Chem. 2002, 50, 4976–4982.
34. Tavassoli, S.; Djomeh, Z.E. Total phenols, antioxidant potential and antimicrobial activity of methanol extract of rosemary (Ros-marinus officinalis L.). Glob. Vet. 2011, 7, 337–341.
35. Bergonzi, M.C.; Bilia, A.R.; Gallori, S.; Guerrini, D.; Vincieri, F.F. Variability in the content of the constituents of Hypericum perforatum L. and some commercial extracts. Drug Dev. Ind. Pharm. 2001, 27, 491–497.
36. Wang, S.Y.; Zheng, W. Effect of plant growth temperature on antioxidant capacity in strawberry. J. Agric. Food Chem. 2001, 49, 4977–4982.
37. Casassa, I.A.F.; Sari, I.A.S.; Avagnina, E.S.; Díaz, T.G.M.; Jofré, L.Q.V.; Fanzone, L.B.M.; Catania, I.A.C. Influence de deux tech-niques de maceration sur la composition phenolique et aromatique et les caractéristiques orgnoleptiques de vins cv. merlot. Rev. Internet Vitic. Oenol. 2007, 25, 1–12.
38. Yang, D.J.; Hwang, L.S.; Lin, J.T. Effects of different steeping methods and storage on caffeine, catechins and gallic acid in bag tea infusions. J. Chromatogr. A 2007, 1156, 312–320.
39. Teixeira, B.; Marques, A.; Ramos, C.; Serrano, C.; Matos, O.; Neng, N.R.; Nogueira, J.M.F.; Saraiva, J.A.; Nunes, M.L. Chemical composition and bioactivity of different oregano (Origanum vulgare) extracts and essential oil. J. Sci. Food Agric. 2013, 93, 2707– 2714.
40. Venditti, E.; Bacchetti, T.; Tiano, L.; Carloni, P.; Greci, L.; Damiani, E. Hot vs. cold water steeping of different teas: Do they affect antioxidant activity? Food Chem. 2010, 119, 1597–1604.
41. Bouyahya, A.; Abrini, J.; Bakri, Y.; Dakka, N. Screening phytochimique et évaluation de l’activité antioxydante et antibacté-rienne des extraits d’Origanum compactum. Phytotherapie 2017, 15, 379–383.
42. Meda, A.; Lamien, C.E.; Marco, R.; Millogo, J.; Nacoulma, O.G. Determination of the total phenolic, flavonoid and proline con-tents in Burkina Fasan Honey, as well as their radical scavenging activity. Food Chem. 2005, 91, 571–577.
43. Gursoy, N.; Sarikurkcu, C.; Cengiz, M.; Solak, M.H. Antioxidant activities, metal contents, total phenolics and flavonoids of seven Morchella species. Food Chem. Toxicol. 2009, 47, 2381–2388.
44. Compaoré, M.; Lamien-Meda, A.; Mogoşan, C.; Lamien, C.E.; Kiendrebeogo, M.; Voştinaru, O.; Vlase, L.; Ionescu, C.; Nacoulma, O.G. Antioxidant, diuretic activities and polyphenol content of Stereospermum kunthianum Cham. (Bignoniaceae). Nat. Prod. Res.
2011, 25, 1777–1788.
45. Jonville, M. Etude de la Composition Chimique et des Potentialités Antipaludiques de Plantes Utilisées en Médecine Traditionnelle au Cambodge et dans L’archipel des Mascareignes; 2011.
46. Clarkson, C.; Maharaj, V.J.; Crouch, N.R.; Grace, O.M.; Pillay, P.; Matsabisa, M.G.; Bhagwandin, N.; Smith, P.J.; Folb, P.I. In vitro antiplasmodial activity of medicinal plants native to or naturalised in South Africa. J. Ethnopharmacol. 2004, 92, 177–191. 47. Bashige-Chiribagula, V.; Bakari-Amuri, S.; Mbuyi-Kalonji, S.; Kahumba-Byanga, J.; Duez, P.; Lumbu-Simbi, J.B. Étude
ethnobo-tanique, phytochimique et évaluation de l’activité antiplasmodiale de 13 plantes réputées antipaludéennes dans la commune du Kenya (Lubumbashi, RDC). Phytotherapie 2017, 1–10, doi:10.1007/s10298-017-1152-x.
48. Esseh, K.; Afanyibo, Y.-G.; Ahama-Esseh, K.Y.S.; Idoh, K.; Koudouvo, K.; Agbonon, A.; Gbeassor, M. Screening Phytochimique, Étude Toxicologique, Évaluation des Activités Antiplasmodiale et Antiradicalaire de la Tige Feuillée de Senna occidentalis Linn (Fabaceae). Eur. Sci. J. ESJ 2019, 15, 411–433.
49. Nassirou, R.; Ibrahim, M.; Ilagouma, A.; Mahamadou, A.; Mamoudou, M.; Abdoulaye, A.; Oukem-Boyer, O.; Ikhiri, K. Évalua-tion in vitro de l’activité antiplasmodiale d’extraits de plantes issues de la pharmacopée tradiÉvalua-tionnelle du Niger. J. Appl. Biosci.
2015, 89, 8291–8300.
50. Baba, G.; Adewumi, A.A.J.; Aina, V.O. Phytochemical Characterization and in-vivo Anti- Malaria Activity of Lantana camara Leaf Extract. Br. J. Pharmacol. Toxicol. 2011, 2, 277–282.
51. Chiou, W.F.; Lin, L.C.; Chen, C.F. Acteoside protects endothelial cells against free radical-induced oxidative stress. J. Pharm. Pharmacol. 2004, 56, 743–748.
52. Chen, C.; Lin, Y.; Chien, M.; Hou, W.; Hu, M. Antioxidant and antihypertensive activities of acteoside and its analogs. Bioche-mistry 2012, 53, 421–429.
53. Lee, H.D.; Kim, J.H.; Pang, Q.Q.; Jung, P.M.; Cho, E.J.; Lee, S. Antioxidant activity and acteoside analysis of abeliophyllum distichum. Antioxidants 2020, 9, 1–10.
54. Jang, T.W.; Choi, J.S.; Park, J.H. Protective and inhibitory effects of acteoside from Abeliophyllum distichum Nakai against oxidative DNA damage. Mol. Med. Rep. 2020, 22, 2076–2084.
55. Lee, K.J.; Woo, E.R.; Choi, C.Y.; Shin, D.W.; Lee, D.G.; You, H.J.; Jeong, H.G. Protective Effect of Acteoside on Carbon Tetrachlo-ride-Induced Hepatotoxicity. Life Sci. 2004, 74, 1051–1064.
56. Nair, A.G.R.; Kotiyal, J.P.; Bhardwaj, D.K. Myricetin 7,4′-dimethyl ether and its 3-galactoside from Rhus lancea. Phytochemistry
1983, 22, 318–319.
57. Nagao, T.; Abe, F.; Kinjo, J.; Okabe, H. Antiproliferative constituents in plants 10. Flavones from the leaves of Lantana monte-vidensis Briq. and consideration of structure-activity relationship. Biol. Pharm. Bull. 2002, 25, 875–879.
58. Rwangabo, P.C.; Claeys, M.; Pieters, L.; Corthout, J.; Vanden Berghe, D.A.; Vlietinck, A.J. Umuhengerin, a new antimicrobially active flavonoid from lantana trifolia. J. Nat. Prod. 1988, 51, 966–968.
59. Akkal, S.; Benayache, F.; Bentamene, A.; Medjroubi, K.; Seguin, E.; Tillequin, F. Flavonoid aglycones from Centaurea napifolia. Chem. Nat. Compd. 2003, 39, 165–166.
60. Servi, H.; Goren, N. Chemistry of endemic Tanacetum mucroniferum Hub.-Mor. & Grierson extracts and three new sesquiter-pene lactones. Turk. J. Chem. 2019, 43, 352–358.
61. Abu-Niaaj, L.; Katampe, I. Isolation and characterization of flavones from Artemisia monosperma. Pharmacogn. J. 2018, 10, 1018– 1023.
62. Itoh, T.; Ohguchi, K.; Iinuma, M.; Nozawa, Y.; Akao, Y. Inhibitory effects of polymethoxy flavones isolated from Citrus reticulate on degranulation in rat basophilic leukemia RBL-2H3 : Enhanced inhibition by their combination. Bioorg. Med. Chem. 2008, 16, 7592–7598.
63. Yang, L.N.; Xing, J.G.; He, C.H.; Wu, T. The phenolic compounds from Dracocephalum moldavica L. Biochem. Syst. Ecol. 2014, 54, 19–22.
64. Belkacem, S.; Belbache, H.; Boubekri, C.; Mosset, P.; Rached-Mosbah, O.; Marchioni, E.; Benayache, S.; Benayache, F. Chemical Constituents from Centaurea parviflora Desf. Res. J. Pharm. Biol. Chem. Sci. 2014, 5, 1275–1279.