ÉTUDE DES FACTEURS PÉDOCLIMATIQUES ET NUTRITIFS RÉGISSANT
LA CROISSANCE DE SALIX MIYABEANA SX67
THÈSE
PRÉSENTÉE
COMME EXIGENCE PARTIELLE
DU DOCTORAT EN SCIENCES DE L'ENVIRONNEMENT
PAR
MARIO JEAN FONTANA
Avertissement
La diffusion de cette thèse se fait dans le respect des droits de son auteur, qui a signé le formulaire Autorisation de reproduire et de diffuser un travail de recherche de cycles supérieurs (SDU-522 - Rév.0?-2011 ). Cette autorisation stipule que «conformément
à
l'article 11 du Règlement no 8 des études de cycles supérieurs, [l'auteur] concèdeà
l'Université du Québecà
Montréal une licence non exclusive d'utilisation et de publication de la totalité ou d'une partie importante de [son] travail de recherche pour des fins pédagogiques et non commerciales. Plus précisément, [l'auteur] autorise l'Université du Québecà
Montréalà
reproduire, diffuser, prêter, distribuer ou vendre des copies de [son] travail de rechercheà
des fins non commerciales sur quelque support que ce soit, y compris l'Internet. Cette licence et cette autorisation n'entraînent pas une renonciation de [la] part [de l'auteur] à [ses] droits moraux ni à [ses] droits de propriété intellectuelle. Sauf entente contraire, [l'auteur] conserve la liberté de diffuser et de commercialiser ou non ce travail dont [il] possède un exemplaire."la liste des personnes à remercier est longue et pas totalement exhaustive.
Tous d'abord, je souhaite remercier très chaleureusement mon directeur Nicolas Bélanger, notamment pour son encadrement, sa disponibilité et les nombreuses heures passées à corriger, bonifier et valider ces chapitres de doctorat. Également je tiens à remercier mon co-directeur Michel Labrecque de rn' avoir encadré, conseillé et même initié au tournage vidéo. Je remercie aussi les membres de mon comité, François Courchesne et Christian Messier, de m'avoir donné de précieux conseils, mis certaines ressources matérielles à disposition et fait bénéficier de leurs contacts.
Merci aux nombreuses personnes qui m'ont prêté main forte sur le terrain comme au laboratoire, avec qui j'ai eu bien du plaisir à travailler et qui m'ont ainsi permis de réaliser un tel travail, merci à Dominic Bélanger, Florence Bélanger, Alexandre Collin, Nicolas Fontana, Alexandre Fouillet, Fanny Gagné, Werther Guidi, Hamida Hafssa, Ahmed Jerbi, Julien Mourali, Jacinthe Ricard-Piché, Gilbert Trembley, Simon Constantineau, Claude Labrecque et Marie-Claude Turmel.
Je souhaite remercier également le personnel du CEF et plus particulièrement à Luc Lauzon, Mélanie Desrochers et Daniel Lessieur pour leur aide, leur disponibilité et leurs conseils.
Je voudrais aussi adresser mes remerciements à mes amis et camarades du doctorat, Alexandre Collin, mon compère de laboratoire, de Go et de badminton, Tiphaine Desprès et Mathieu Latutrie pour les riches échanges et nombreux coups de main ainsi que Jeanne Téwa Togbodouno qui m'a présenté ma compagne.
Merci à tous mes amis outre atlantique qui rn 'ont beaucoup aidé autant sur le plan psychologique que pratique, la liste est trop longue pour être exhaustive. En vrac,
merci à Flo et Seb ainsi qu'à leur petite famille, à la Heumann Family, à Wilou, à Louis, aux soutiens Aubagnais et Cévenol, aux amis du 47, à la banda de la maison des enfants, etc.
Enfin, je souhaite remercier énormément ma famille de rn 'avoir soutenu, épaulé et encouragé. Merci à ma grand-mère Luce Fontana, à ma mère Catherine Fontana, à mon père Michel Kun, à ma belle mère Coralia Rodriguez, à ma sœur par alliance Amanda Cepero, à mes sœurs Sandra Veuthey et Anaïs Bocognano, à mon frère Emil Bocognano, à ma compagne Kadiatou Sylla ainsi qu'à ma fille Inès Salimata Fontana, née au cours de la rédaction de ce doctorat.
présentés sous forme d'articles scientifiques. Comme les articles n'ont pas été formatés pour les mêmes revues, le format du résumé des chapitres 1 et 2 (« Abstract ») diffèrent de celui employé pour les chapitres 3. À ce jour; le premier chapitre a été soumis à la revue BioEnergy Research.
CCR constitue également une alternative à la valorisation des terres marginales au Québec. Le cultivar Salix miyabeana SX67 est reconnu parmi les plus productifs. L'objectif de cette thèse était d'étudier et de quantifier à l'échelle du Québec
mé~idional les impacts du climat et des propriétés physico-chimiques du sol sur la
productivité épigée. Il était aussi souhaité de quantifier ces relations par l'entremise de la nutrition foliaire.
Cette étude a été réalisée en mettant à profit dix CCR établies dans le sud du Québec, soumises à des conditions pédoclimatiques hétérogènes. Des analyses physico-chimiques ont été effectuées sur les sols de chaque site. Les teneurs des éléments dans les feuilles ainsi que la masse foliaire ont été mesurées à différents sites au cours des saisons de croissance de 2011 à 2013. Le 813
C foliaire a aussi été évalué au cours de l'année 2011. Enfm, les climats annuels ont été modélisés pour chaque site à l'aide du modèle BioSIM.
La croissance de SX67 a été quantifiée en tenant compte de l'effet du recépage. De ce projet, il résulte une base de données générée à l'aide de mesures effectuées entre 2001 et 2013 sur plus de 1100 arbres ayant des âges d'appareils racinaires et de tiges compris entre 1 et 15 ans et 1 et 7 ans, respectivement. Des analyses dendrochronologiques ont également permis d'effectuer un suivi de la productivité annuelle durant minimalement le dernier cycle de chaque CCR. Ainsi, il a été mis en évidence qu'après un laps de temps nécessaire à l'établissement de l'arbuste (compris entre un minimum de deux ans sur sol sableux et un maximum de quatre ans sur sol argileux et compacté), Je potentiel de productivité maximal était atteint et a pu être estimé. Le gain de productivité entre les deux premiers cycles était relatif à la durée de ce délai et donc aux propriétés du sol.
Certaines propriétés du sol telles que les teneurs en limon et en magnestum échangeable ont expliqué significativement 72% et 25% des variations entre les sites, respectivement. Uniquement sur sol minéral, le limon, le calcium échangeable et le carbone organique ont expliqué 72%, 54% et 41% des variations. Au sein de chaque site, les facteurs limitants ont différé relativement aux statuts nutritionnels des sols et à leurs propriétés physiques. Sur un site, l'historique agricole a engendré des conditions pédologiques qui confment les racines proches de la surface du sol. Ceci a engendré un stress hydrique accru, ce qui a été mis en évidence par les valeurs foliaires de 813C. Également, les variations inter-annuelles de sécheresse estivales étaient négativement liées à la productivité, sauf pour un site où il n'a pas semblé y avoir eu de limitation en eau. Exceptionnellement, à cette CCR, la relation entre la précipitation et la productivité était négative. Globalement, la sécheresse a expliqué
significativement 10 à 20% de la productivité entre les sites, alors que les propriétés du sol ont expliqué environ 70%.
Bien qu'une signature nutritionnelle foliaire spécifique à chaque site ait été mise en évidence, les fluctuations climatiques inter-annuelles ont eu des répercussions importantes sur la nutrition foliaire. Les variations de nutrition inter-annuelles ont été observées et, en partie, expliquées par certaines variables climatiques. De ce fait, les nutriments foliaires linéairement liés à la productivité variaients selon les années. Dans l'ensemble, l'azote, le calcium et dans une moindre mesure le manganèse foliaires étaient les plus fortement liés au rendement. Toutefois, l'utilisation d'arbres de régressions multivariés a permis d'expliquer la productivité annuelle par des seuils nutritionnels et ainsi de passer outre les limitations spécifiques aux années.
Cette étude suggère de modifier certaines pratiques telles que le recépage initial ou le labour avant l'établissement d'une CCR. Bien que la productivité de chaque CCR soit limitée par des facteurs leur étant spécifiques, la sécheresse et l'acidité des sols sont les principaux facteurs limitants dans le sud du Québec.
MOTS CLÉS : Saule, nutrition foliaire, nutriments du sol, biomasse, culture à courte révolution, fluctuation climatiques annuelles
AVANT-PROPOS ... v
RÉStJMÉ ... vi
LISTE DES FIGURES ... xii
LISTE DES TABLEAUX ... xvi
LISTE DES ABRÉVIATIONS ... xx
INTRODUCTION GÉNÉRALE ... 1
1.1 Le saule ... 1
0.2 Les cultures à courtes révolutions et le recépage ... 2
0.3 Les conditions de sol régissant la nutrition et la croissance de Salix 3 0.4 Le climat comme facteur limitant la croissance de Salix ... 5
0.5 Objectifs, hypothèses et structure de la thèse ... 6
CHAPITRE I ... 9
EFFECTS OF COPPICING AND STOOL AGE ON ANNUAL YIELDS OF SALIX MIY ABEANA SX67 IN SOUTHERN QUÉBEC ... 9
1.1 Abstract ... 10
1.2 Introduction ... 11
1.3 Mate rial and methods ... 14
1.3.1 Study sites ... 14
1.3.2 Field growth survey ... 19
1.3.3 Soi! sampling and analysis ... 20
1.3.4 Relationship between area of the largest diameter and dry biomass ... 20
1.3.5 Estimation of basal area increment.. ... 21
1.3.6 Estimation of annual aboveground biomass production and maximum potential ... 23
1.3.7 Dataanalysis ... 25
1.4 Results ... 27
1.4.1 Aboveground biomass yields and maximum potential.. ... 27
1.4.2 Partitioning of the variance in aboveground biomass biomass ... 31
1.4.3 Relationships between grow:th variables and stem/root ages ... .32
1.4.4 Growth differences following coppicing ... 33
1.4.5 Growth differences between rotations and stool ages ... 34
1.5 Discussion ... 37 1.5.1 Estimation of aboveground biomass yields ... 37
1.5.2 Effect of coppicing on growth and yield ... .40
1.5.3 Effect of stem age across rotations ... .41
1.5.4 Delays in reaching maximum yields ... .43
1.5.5 Effect of rotation on yields ... 44
1.6 Conclusion ... 45
CHAPITRE II ... 47
QUANTIFYING THE EFFECTS OF SOIL AND CLIMA TE ON ABOVEGROUND BIOMASS PRODUCTION OF SALIX MIYABEANA SX67 IN QUEBEC ... 47
2.1 Abstract ... 48
2.2 Introduction ... 49
2.3 Material and method ... 51
2.3.1 Field sites ... 51
2.3.2 Estimates of annual aboveground biomass ... 55
2.3.3 Soi! sampling and analysis ... 55
2.3.4 Climatic conditions ... , .. 56
2.3.5 Leafsampling and analysis ... 57
2.3.6 Statistical analysis ... 58
2.4.1 Soi! and climate conditions ... 61
2.4.2 Site productivity as related to soi!.. ... 63
2.4.3 Foliar 813C during the 2011 growing season ... 64
2.4.4 Site productivity as related to climate ... 65
2.4.5 Pedoclimatic models ofproductivity ... 66
2.5 Discussion ... 68
2.5 .1 Soi! variables as related to yield ... 68
2.5.2 Factors limiting yield at low productivity sites ... 69
2.5 .3 Water stress ac ross growing seasons and SRCs ... 71
2.5.4 Pedoc1imatic yield models ... 74
2.6 Conclusion ... 75
CHAPITRE III ... 76
LEAF CHEMISTRY AND MASS EXPLAIN INTER-ANNUAL VARIATIONS IN SALIX MIYABEANA SX67 YIELD IN QUEBEC ... 76
3.1 Abstract ... 77
3.2 Introduction ... 78
3.3 Materials and methods ... 80
3.3.1 Fieldsites ... 80
3.3.2 Estimation of annual aboveground biomass yields ... 80
3.3.3 Foliage sampling, leafmass and nutrient analysis ... 81
3.3.4 Soi! sampling and analysis ... 82
3.3.5 Climatic conditions ... 83
3.3.6 Compositional Nutrient Diagnosis ... 83
3.3.7 Data analysis ... 84
3.4 Results ... 88
3.4.1 Variation in soil and climate ... 88
3.4.3 Relationships among foliar nutrients, soil chemical properties
and climatic variables ... 94
3.4.4 Relationships among foliar nutrients, leaf mass and aboveground biomass yields ... 96
3.5 Discussion ... 101
3.5.1 Foliar signatures are controlled more largely by soi) conditions th an climate ... 1 01 3 .5.2 Foliar traits impact annuar aboveground biomass yields ... 1 03 3.5.3 Mode) performance to predict annual aboveground biqmass yields is high ... 1 07 3.6 Conclusion ... 108
CONCLUSIONS GÉNÉRALES ... 1 09 4.1 Potentiel de productivité et effet du recépage ... 109
4.2 Les limitations nutritionnelles inter-sites ... 110
4.3 Les limitations hydriques ... 111
4.4 Les spécificités des sites ... 112
4.5 Variations interannuelles des nutriments foliaires ... 113
4.6 Retombées pratiques ... 114
4.7 Axes de recherche à développer ... 115
ANNEXES ... 118
1.1 Method to estimate the basal area increments (BAI) of ali growing seasons captured within the sampling of a short rotation culture of SX67 ... 22 1.2 Linear regression mode! between the diameter measured on the largest
stem and dry aboveground biomass of shrubs. Each data point refers to an average of 24 to 36 shrubs. A different symbol is attributed for each site. Data labels indicate the number of growing seasons of the stems (S) and roots (R). For example, the label S 1 R5 means a one year-old stem and a five year-old root system .. o o o o o o o o o o o o o o o o o o o o o o o o o o o o o o o o o ooooo . . o o o o 2 8 1.3 Estimated an nuai aboveground biomass yields of the six short rotation
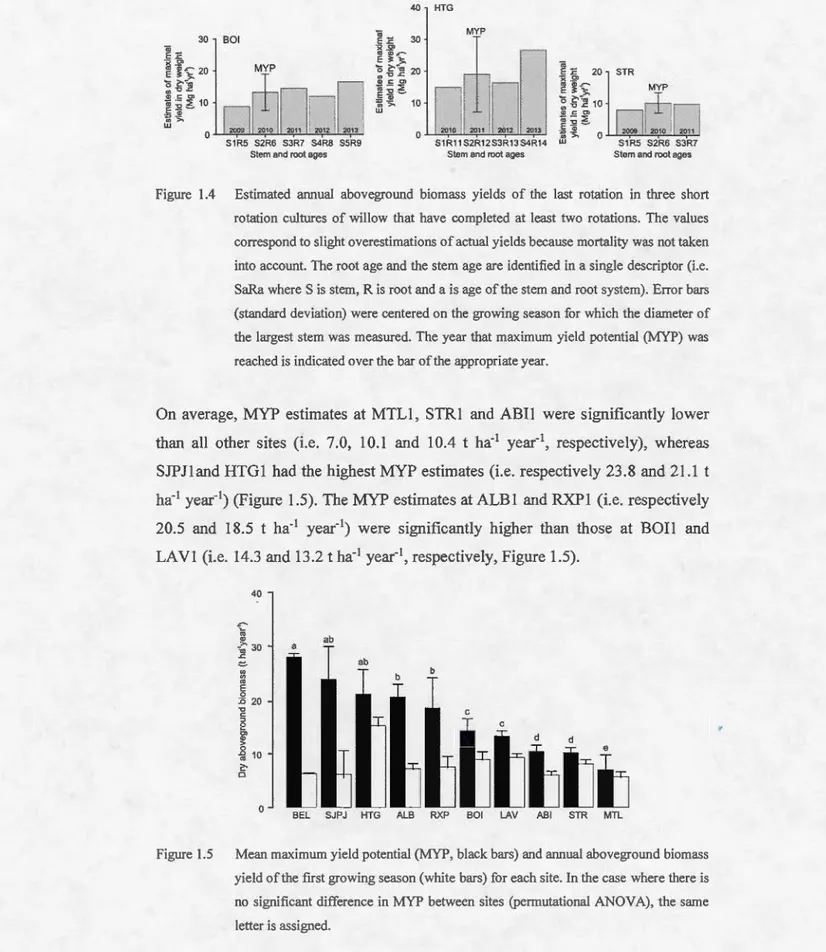
cultures of SX67 that have completed only one rotation (i.e. at !east four years). The values correspond to slight overestimations of actual yields because mortality was not taken into account. The root age and the stem age are identified in a single descriptor (i.e. SaRa where S is stem, R is root and a is age of the stem and root system). Error bars (standard deviation) were centered on the second growing season to illustrate the year that maximum yield potential (MYP) was reached, which is indicated over the bar of the appropriate year. ooo o o o o o o oo o o o o o o o o o o o o oo o o o o o . 2 9 1.4 Estimated annual aboveground biomass yields of the last rotation in
three short rotation cultures ofwillow that have completed at !east two rotations. The values correspond to slight overestimations of actual yields because mortality was not taken into account. The root age and the stem age are identified in a single descriptor (i.e. SaRa where S is stem, R is root and a is age of the stem and root system). Error bars
(standard deviation) were centered on the growing season for which the diameter of the largest stem was measured. The year that maximum yield potential (MYP) was reached is indicated over the bar of the appropriate year. ... 30
1.5 Mean maximum yield potential (MYP, black bars) and annual aboveground biomass yield of the fust growing season (white bars) for each site. ln the case where there is no significant difference in MYP between sites (permutational ANOV A), the same letter is assigned ... 30
2.1 Location of the ten short rotation intensive willow cultures in southern Que bec and mean annual degree-days above
soc in the
study area ... 52 2.2 Principal component analysis of soi! organic matter, exchangeablecalcium and magnesium (Caexch and Mgexch) and pH. Circle size is proportional to the maximum yield potential. ... 62
2.3 Mean foliar 813C (boxes) and summer precipitation (bars) measured for the 2011 growing season at each SRC studied (a) and linear regression between foliar 813C and summer precipitation without considering the data from ABI and LA V sites (b). In panel (a), different letters were assigned when a significant mean difference (p<0.05) was found between SRCs ... 64
2.4 Partitioning of the variance of maximum yield potential (MYP) with silt content and spring drought (i.e. the highest number of consecutive days without precipitation between April and June) as explanatory variables with (a) and without (b) the data from the ABI site. The rectangles represent the variance of maximum yield potential (MYP), circles represent the variance explained by the two explanatory variables and the overlapping area between circles shows the variance concomitantly explained by both variables ... 66
2.5 Linear regression between the MYP:silt ratio and consecutive days of spring drought is shawn without considering the ABI data point. The relationship between MYP and silt and spring drought is fully detailed ... 67
2.6 Variance of annual aboveground biomass yields explained by soi! and climate variables through a multivariate regression tree. The additional contributions to the mode! R2 (i.e. 1 - residual error) are presented for each node. The number following the site name (e.g. ABI2011) refers to the growing season for which annual yield is considered. For each cluster, the mean annual yield is reported in bold. O.M. is soi! organic matter, P20s is soi! total P, and Spring Temp. is spring temperature averages computed from April to June ... 67
2.7 Typical soi! profile at the ABI site where the dominant upward development of willow roots is due to the presence of a plough-pan at
.a depth of 20 cm. The embedded picture of willow roots was taken while assessing biomass of the who le rooting system in the laboratory for six ofthe SRCs studied (Tremblay 2014) ... 71
3.1 Principal component analysis ofannual CND scores ofC, N, P, K, Ca, Mg, Mn, Fe and Zn measured in 2011 (blue), 2012 (red) and 2013 (green) at the ni ne SRCs (i.e. ABI, BEL, BOl, HTG, LA V, MTL, RXP, SJPJ and STR). A fuzzy clustering is superimposed. For each abject, the two clusters (i.e. red and green) equal 100% and describe the proportional similarities between two groups. The stars indicate the measurements performed on the reduced dataset (n = 15) instead of the extended dataset (n = 21) ... 90
3.2 Linear discriminant analysis of CND scores of C, N, P, K, Ca, Mg, Mn, Fe and Zn by SRC (reduced dataset, n = 15). The ellipse surrounds 95% of the theoretical inner group dispersion ... 91
3.3 Variance of annual aboveground biomass yields explained by leaf traits through MRT using the CFN values (a) and CND scores (b) from the 2011 growing season only (plot-scale, n = 35) as weil as the CFN values (c) and CND scores (d) from the 2011, 2012 and 2013 growing seasons (extended, n = 21). The R2 (i.e. 1 - residual error) and levels of significance are presented for each node of the MRTs. For the MRTs shown in panels (a) and (b), the number following the site name (e.g. ABil) refers to the plot number. For each cluster, the mean of annual aboveground biomass yields is reported in parentheses ... 0 00 0.0 0 0 0 0 0 0 0 • • • • 0 0 •• 0 00 0 0 0 •• 0 0 . oo· 0 0 0 0 ••• 0 0 0 0.0 00 0.0 00 0 0 • • • 0 0 •• 0 00 • • 0 00 0 0 00 • ••• • • ••• 0 00 0 •• • • 0 01 00
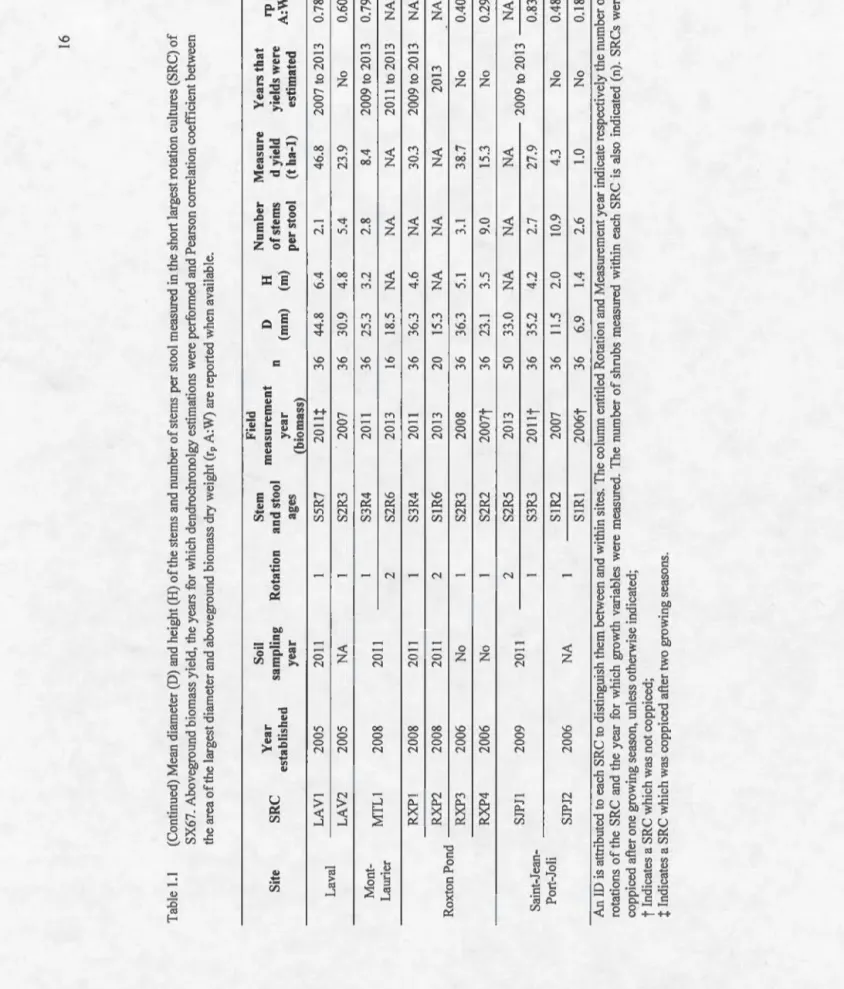
1.1 Mean d iameter (D) and height (H) of the stems and number of stems
per stool measured in the short largest rotation cultures (SRC) of
SX67. Aboveground biomass yield, the years for which
dendrochronolgy estimations were performed and Pearson correlation
coefficient between the area of the largest diameter and aboveground
biomass dry weight (rp A: W) are reported wh en available ... 15
1.2 Previous land use and general climatic and soi! properties of the short
rotation cultures of SX67 for which maximum yield potential was
estimated ... , ... 16
1.3 Results of statistical differences in basal area increment between
growing seasons (GS) ... 31
1.4 Partitioning of the variance of dry aboveground biomass between the
area of the largest diameter and a second explanatory growth variable
(i.e. height, root age, stem age, rotation number or number of stems
per stool) ... 32
1.5 Results of mixed mode! analysis of the area of the largest diameter-to-height ratios as the response variable, site effect as the random factor and stem age as the fixed variable. Mode! 1 uses stem age as a
continuous variable, whereas mode] 2 uses it as a binary variable
(mode! 2). Mode! 3 is a linear regression with the number of stems per
stool as the response variable and the age of the root system as the
explanatory variable ... 33
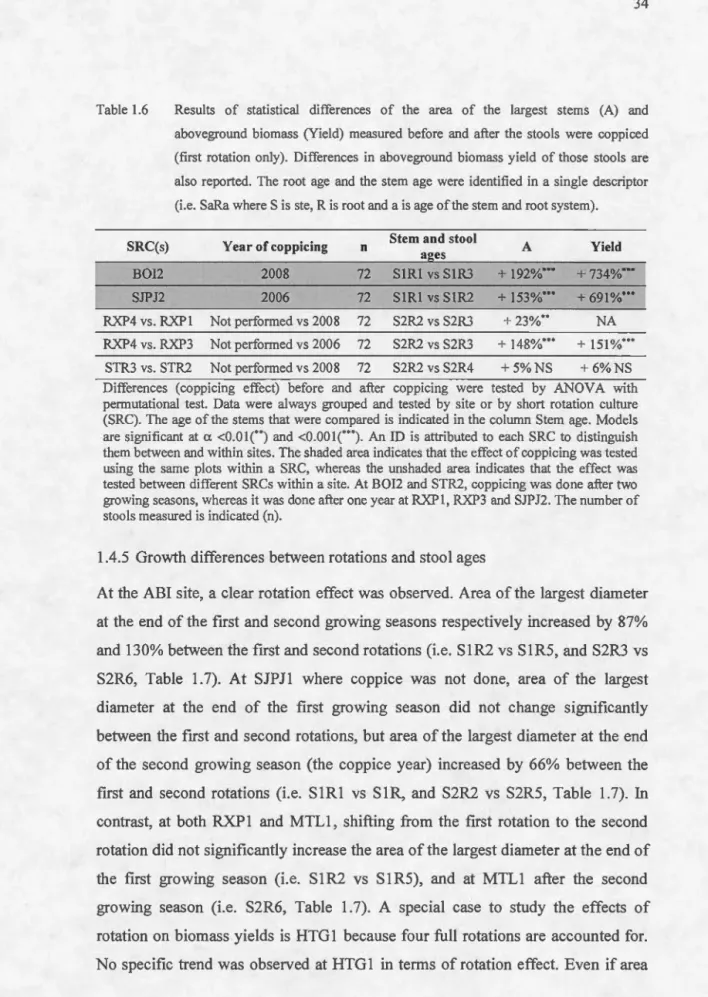
1.6 Results of statistical differences of the area of the Jargest stems (A)
were coppiced (first rotation only). Differences in aboveground biomass yield of those stools are also reported. The root age and the stem age were identified in a single descriptor (i.e. SaRa where S is ste, Ris root and ais age of the stem and root system) ... 34
1.7 Results of statistical differences of the area of the largest stems (A) measured from stools of the same ages but of different rotations (i.e. different stool ages). Differences in aboveground biomass yie1d of those stools are also reported. The root age and the stem age were identified in a single descriptor (i.e. SaRa where S is stem, R is root and ais age of the stem and root system) ... 36
2.1 Soil particle size distribution and chemical properties at a depth of 0-25 cm and dry density at depths of 0-5, 20-25 and 40-45cm at each of the ten SRCs studied ... , ... 53
2.2 Climate variables for each of the ten SRCs studied. Means are computed from the 2010, 2011, 2012 and 2013 growing seasons. The coefficients of variation are indicated in parentheses ... 54
2.3 Climate variables for individual growing seasons. Means are computed from the ten SR Cs studied. The coefficients of variation are indicated in parentheses ... 62
2.4 Significant linear regressions between soil properties and maximum yield potential across the ten SRCs studied. Adjusted R2 are presented and positive (+) and negative (-) relationships are indicated in parentheses ... 63
2.5 Mixed model with annual aboveground biomass yield as the response variable, site as a random factor and the mean of the maximum temperature as a fixed variable. The adjusted R2 of the 1inear regression between summer drought and annual aboveground yield at
the LAY site is indicated in the shaded area of the table. Positive(+) and negative (-) relationships are indicated in parentheses. 0 0 0 0 00 000000 0000 0000 0 0 0 00 6 5
2.6 Significant linear regressions between climate variables and maximum yield potential across SRCs. Adjusted R2 are presented and negative( -) relationships are indicated in parentheses. oooo0 0 o o 0 0ooo o o o o o o oooooo o o o o o o oooooooooo o o o o o o o.6 5
3.1 A ver age degree days (base 5°C) and rainfall for the 2011, 2012 and 2013 growing seasons and general soi! properties (0-25 cm) at each of the nine SRCs. The average degree days and rainfall are also reported for each growing season and are calculated with data from ali SRCs. The coefficients of variation across SRCs and growing seasons are reported in parentheses .. o o o o o o .. . . o o · ··· · o o · o o · · · o o• o o• o o o o o o • • oo . .. .. .. .. .. oo •• oo . ... .. . . oooo ••• 89
3.2 Percentage of variation in CFN values and CND scores of C, N, Ca, Mg, K, P, Fe, Mn and Zn and leaf mass (LM) between growing seasons, and coefficients of variation across SRCs and growing seasons. ooooooo •• ••• oo •• oo ... .. ... . oo ••• oo . . . ... . oo .. . . .. ooooooo··· · · o o o o .. .. . . oo.oo . . .. . . .. .. .. ... . .. oo . . 93
3.3 Results of linear models (R2
) between CFN values (i.e. N, Ca, K, Mg,
P, Mn, Fe, Zn) and their associated soil variables (i.e. Ntot, Caexch,
Kexch, Mgexch, PzOs, Mnexch, Feexch and Znexch) (i.e. Soil var. column) or between CFN values and climatic variables (i.e. Clim. var. column) performed across SRCs and growing seasons (i.e. 2011, 2012 and 20 13). The column entitled Site <C Soil var. reports the adjusted R 2 of the site effect not explained by the soi! variables, whereas the column Mix. mod. reports the R2 of mixed models of CFN values using climatic variables with site as a random factor. For climatic variables, positive(+) and negative(-) relationships are indicated in parentheses. The last three columns entitled Soil var. <C Clim. var., Soil var.
n
Clim. var., and Clim. var. <C Soil var. indicate the adjusted R2 of the variance of CFN values explained respectively by the soil variable only, the soil variable and climate variable, and the climate variableonly, the soi! variable and climate variable, and the climate variable only ... 95
3.4 Canonical redundancy analysis results (adjusted R2) of annual
aboveground biomass yields (annual yield) vs. CFN values, CND scores and leaf masses (LM) performed ac ross SR Cs for the 20 11, 2012 and 2013 growing seasons individually. Positive (+) and negative(-) relationships are indicated in parentheses ... 97
3.5 Partitioning of the variance of annual aboveground biomass yields between selected leaf traits (nutrients or leaf mass (LM)) and site effect. Positive ( +) and negative (-) relationships are indicated in
parentbeses. The column entitled Sel. var.
<t
Site indicates the adjusted R2 of the selected leaf traits which does not overlap site effect. The column entitled Sel. var.n
Site indicates the adjusted R2 of the variance explained by selected variables and site effect. The column entitled Site <t Sel. var indicates the adjusted R2 of site effect which does not overlap selected variables. The column entitled R2seL var indicates the R2 of the effect of selected variables as a whole. The models presented in the shaded area are similarly constructed, although they test the effect of LM instead of site effect. These models also did not meet the condition ofindependence ... 985.1 Average CFN values ofN, P, K, Ca, Mg and Mn, leafmass (LM) and mean annual aboveground biomass yield (AABY, both estimates) for the 2011, 2012 and 2013 growing seasons combined. The coefficients of variation ac ross growing seasons are reported in parentheses ... 118
ALB =Albane!
BEL = Beloeil
BOl = Boisbriand
CND = Compositional Nutrient Diagnosis CFN =Concentration ofLeafNutrients
HTG = Huntingdon
LAV=Laval
MRT = Multivariate Regression Tree MTL =Mont-Laurier
MYP =Maximum yield potential
RXP = Roxton Pond
SJPJ =Saint-Jean-Port-Joli
SRC = Short rotation intensive culture
Le saule (Salix spp.) est utilisé à des fins très diverses depuis des millénaires par les Égyptiens, les Romains et les Occidentaux (par ex. usage médicinal,
fabrication de paniers et de flûtes, stabilisation des berges, (Keoleian 2005)).
L'utilisation de Salix en régime de production intensive à des fms bioénergétiques a connu un engouement en Suède dans les années 70 (Christersson et al. 1993). Bien qu'encore en développement, les utilisations sont aujourd'hui également destinées à d'autres usages tels la phytoremédiatibn (Kuzovkina & Volk 2009), la phytoépuration (Mirck & Volk 201 0), la phytoextraction (Meers et al. 2007) ainsi que la revalorisation des boues d'épuration (Labrecque & Teodorescu 2001;
Kuzovkina & Volk 2009) et du lisier de porc (Cavanagh et al. 2011). Avec la contribution d'un amendement adéquat, les cultures de Salix ont l'avantage de pouvoir être élaborées sur des terres marginales (Christersson 1986), tout en améliorant les propriétés du sol (par ex. réduction de l'érosion, amélioration des propriétés de filtration, capacité de décompaction du sol et de stabilisation de la structure du sol (Kuzovkina & Volk 2009)). De plus, il a été démontré que la biodiversité dans les cultures de Salix est accrue comparativement aux cultures agricoles conventionnelles ou aux cultures de conifères monospécifiques (Perttu 1999). Également utilisables à des fins de production de biocarburant de seconde génération (Smaliukas et al. 2007), il est aujourd'hui indéniable que les cultures à courtes rotations (CCR) sont une alternative très prometteuse quant à la production d'énergie (Volk et al. 2004). De surcroît, les CCR permettent d'augmenter sensiblement la teneur en carbone organique séquestré dans le sol (Lockwell et al. 20 12; Routhier et al. 20 14; Lafleur et al. 2015). Salix est un genre de début de succession. Caractérisés par une croissance rapide, plusieurs espèces et cultivars de Salix profitent d'une saison de croissance relativement courte. Ainsi, de nombreux cultivars de Salix peuvent être cultivés sous les conditions
pédoclimatiques du Québec méridional (Labrecque & Teodorescu 2003; Guidi
Nissim et al. 2013).
0.2 Les cultures à courtes révolutions et Je recépage
Pour mettre en place une CCR, des boutures (section de tige d'environ 20-25 cm
généralement prélevée après un an de croissance) sont plantées à une profondeur
d'environ 18 cm (Guidi et al. 2013). Bien que la densité soit variable, les CCR au
Québec comptent en général entre 18 000 et 20 000 boutures par hectare
(Labrecque & Teodorescu 2003; Labrecque & Teodorescu 2005; Guidi Nissirn et
al. 2013). Les tiges qui émergent sont généralement récoltées après 3 à 5 ans
(Mola-Yudego & Aronsson 2008), bien que cela puisse varier de 2 à 8 ans selon
les rendements des sites (Guidi et al. 2013). Les souches restantes produisent alors
de nouvelles tiges qui seront récoltées à nouveau à la fin de cycle suivant et ainsi
de suite. Il est usuellement accepté qu'une CCR peut-être exploitée une trentaine
d'années.
L'effet du recépage sur la croissance de Salix n'est pas anodin. En fin de première
année, un recépage initial est fréquemment effectué dans le but d'augmenter le
nombre de tiges et la biomasse finale de la première révolution (Guidi et al.
2013). Également, il a fréquemment été rapporté que Je rendement de la deuxième
révolution était supérieur à celui de la première (Nordh 2005; Mola-Yudego &
Aronsson 2008; Guidi Nissirn et al. 2013). De plus, les CCR n'ont pas un nombre
maximum de révolution établi. De façon anecdotique, certains auteurs ont même
observé une augmentation de productivité jusqu'à la 4ème révolution (Volk et al.
2011). Avant que la production épigée soit maximale, un laps de temps est
nécessaire pour que l'appareil racinaire soit suffisamment bien établi (Kopp et al.
1993; Mola-Yudego & Aronsson 2008). Kopp et al. (2001) ont observé une
augmentation asymptotique de la productivité au cours des deux à quatre
premières saisons de croissance, selon que Je sol ait été fertilisé ou non. Toutefois,
De la même façon, peu d'études ont porté sur l'effet du recépage sur la productivité en fonction de la variabilité des sols (Abrahamson et al. 2002) et à ma connaissance, aucune recherche n'a porté sur les effets du recépage initial.
0.3 Les conditions de sol régissant la nutrition et la croissance de Salix
Très adaptable, Salix peut croître quelque soit la texture granulométrique du sol (Tahvanainen & Rytkonen 1999; Labrecque & Teodorescu 2001), y compris sur sol compacté (Kuzovkina et al. 2004; Souch et al. 2004). Cependant, la productivité est supérieure sur les sols à textures fines, bien que les sols argileux compactés ne soient pas non plus optimaux (Abrahamson et al. 2002). Sur les sols sableux et caractérisés par de faibles teneurs en azote (N), les rendements sont plus faibles (Labrecque & Teodorescu 2001; Toillon et al. 2013). En culture hydroponique, les rendements augmentent avec la disponibilité en N (Ericsson 198la). Cependant, in situ, les réponses sont très variables selon la nature des sols (Labrecque & Teodorescu 2001; Quaye & Vo1k 2011; Simon et al. 2013). L'effet des autres nutriments n'a été que peu étudié. En culture hydroponique, il a été démontré que le N, le phosphore (P), le potassium (K), le calcium (Ca) et le magnésium (Mg) sont positivement liés à la croissance (Ericsson 198lb). En revanche, in situ, les relations sont beaucoup moins triviales et les conclusions ne sont pas unanimes (Simon et al. 1990; Labrecque et al. 1998). En effet, les facteurs limitants peuvent varier d'un site à l'autre. En sol acide, les métaux sont plus disponibles (Sanders 1983; Martinez & Motto 2000) et sont susceptibles d'être toxiques pour les arbres ainsi que d'induire des effets antagonistes aux prélèvement d'autre nutriments. Par exemple, dans de telles conditions, il a été observé que le manganèse (Mn) limitait la croissance de Populus, de Acer saccharum et de Salix (Kovalchik 1992; Houle et al. 2007; Pinno et al. 2010). De plus, les sols acides sont généralement carencés en Ca, ce qui peut également limiter la croissance de Salix (Hytonen 2005). Pour la majorité des cultivars, il semble qu'une gamme de pH optimale se situe entre 5-5.5 et 7-8 (Mitchell et al.
1999; Abrahamson et al. 2002; Guidi et al. 2013). Cependant, une relation positive a été observée (sans seuil maximal) entre le pH du sol, le Ca total du sol, le K foliaire et la productivité de Salix purpurea sur plusieurs sites ayant des valeurs de pH de sol allant jusqu'à 8 (Ens et al. 2013). Concernant le cultivar Salix miyabeana SX67, sa sensibilité au pH ainsi que les conditions de nutrition optimales restent à définir.
Les teneurs nutritionnelles des sols se reflètent dans les feuilles plus ou moins
linéairement (Bau er et al. 1997) et dépendent du mode d'absorption des
nutriments (Ericsson 1981b). Ainsi, l'augmentation du rendement de Salix après l'ajout de fertilisants à base azotée et de chaux se traduit respectivement par une augmentation du N foliaire (Labrecque et al. 1998; Labrecque & Teodorescu 2001) et du Ca foliaire (Hytonen 2005). Également, les nutriments sont susceptibles de rentrer en interaction. Par exemple, le ratio Ca:Mg influence l'absorption en plomb (Pb) et en cadmium (Cd) qui, en retour, limitent la croissance de Salix (Mleczek et al. 2011; Magdziak et al. 2013). De ce fait, afin
de mieux détecter ce type d'interaction, différentes méthodes de diagnostique
foliaire ont été élaborées pour mieux interpréter les teneurs nutritionnelles brutes obtenues (Ba tes 1971; Beau fils 1973; Parent et al. 1994a; Haase & Rose 1995; Parent 2011). Dans un espace contraint comme celui d'une feuille, la variation de la teneur d'un nutriment a forcément un ou des impact(s) sur la ou les teneur(s) d'un ou des autre(s) nutriment(s). Il y a donc une redondance dans l'information contenue dans les teneurs brutes des nutriments foliaires parce qu'elles ne peuvent pas être considérées comme indépendantes. Afin de surmonter ce biais, la
méthode du « Compositional Nutrient Diagnosis » (CND) permet de calculer,
pour chacun des nutriments, des indices linéairement indépendants qui prennent en considération le bilan nutritionnel total de la feuille ou de l'aiguille (Parent & Dafir 1992). Bien que cette méthode n'ait pas encore été utilisée pour un cultivar de Salix, elle semble tout à fait adaptée au contexte de cette étude.
0.4 Le climat comme facteur limitant la croissance de Salix
Bien que Salix soit très adaptable selon une large gamme de températures et de régimes hydriques (Donovan et al. 1988), les contraintes climatiques sont susceptibles de limiter la croissance dépendamment de l'aire de l'étude. Dans les zones géographiques les plus froides, la température estivale et la longueur de la
saison de croissance sont généralement limitantes (Wijk 1986; Walker 1987;
Schmidt et al. 201 0). Dans les zones pl us tempérées, la température est positivement liée à la croissance des arbres s'il n'y a pas de limitation hydrique,
alors que la relation s'inverse en cas de sécheresses (D'Arrigo et al. 2008). Ces
tendances se vérifient bien sur Salix. Dans la vallée du Po en Italie, où de fortes sécheresses estivales caractérisent le climat (mésogéen), la pluviométrie a été
identifiée comme facteur limitant le rendement de Salix matsudana (Bergante et
al. 2010). En revanche, sous un climat n'imposant aucune limitation hydrique
comme sur l'île de Svalbard (Norvège), par exemple, la pluviométrie est
négativement liée à la croissance de Salix polaris car elle diminue la température
et la radiation (Buchwal et al. 2013). Aussi, au sud du Québec, la productivité maximale de Salix en CCR (au-delà de 20 t ha-1 an-1) est supérieure à celle du sud
de la Scandinavie si les plantations ne sont pas irriguées (Christersson 1987; Tahvanainen & Rytkonen 1999; Labrecque & Teodorescu 2003), alors que le nombre de degrés jours (base 5°c) est environ le double et que la pluviométrie de mai à aout est deux fois moindre (Labrecque & Teodorescu 2003). De ce fait, les
faibles précipitations ont déjà été soupçonnées de limiter la productivité dans Je
sud du Québec, bien qu'à ce jour, aucune étude n'a quantifié l'ampleur de l'effet.
Le ratio 12C:13C dans les tissus de la plante est un indicateur robuste d~ l'efficacité
de l'utilisation de l'eau au cours de la saison de croissance (Farquhar et al. 1982).
Cette information est précieuse parce que les exigences en eau des cultivars de
Salix cultivés en CCR sont très élevées (Weih 2001). Chez Salix viminalis, 6,3 g
de matière sèche par kg d'eau transpirée est, en moyenne, produite (Lindroth 1996). Combinée aux rendements, l'analyse du 813C (signature isotopique du 13C)
limité la productivité et, de manière plus nuancée, de constater si l'efficacité de l'utilisation de l'eau limitait la productivité de diverses CCR de Salix (Moukoumi
et al. 2012; Ens et al. 2013; Toillon et al. 2013).
En même temps que la croissance, les conditions climatiques annuelles modulent
la nutrition des arbres (MacKay & Leefe 1962). Notamment, les teneurs en N
foliaire baissent durant les années de faibles pluviométries et/ou de fortes
températures (Kudo 2003; Vizcayno-Soto & Côté 2004). Toutefois, très peu
d'information est disponible sur le sujet, encore moins sur le Salix. De
nombreuses interrogations demeurent quant aux effets des interactions entre les
propriétés pédologiques et les conditions climatiques sur le statut nutritionnel de
la feuille et sur le potentiel de croissance de Salix.
0.5 Objectifs, hypothèses et structure de la thèse
L'objectif de ce doctorat est de mieux comprendre et de quantifier l'influence des
facteurs pédoclimatiques et nutritifs régissant la production de biomasse épigée de
Salix miyabeana SX67 dans dix CCR dispersées au sein du Québec méridional.
Salix miyabeana est une espèce qui pousse naturellement dans les forêts de
Hokkaido, Japon, (Kudo 2003). Le cultivar Salix miyaneana SX67 a été
sélectionné pour cette étude car son potentiel de productivité est parmi les plus
élevés relativement aux autres cultivars de Salix et il est aussi plus résistant aux
maladies et aux insectes que Salix viminalis, également reconnu pour ses
rendements élevés au Québec et en Amérique du Nord en général (Labrecque &
Teodorescu 2005; Guidi Nissim et al. 2013). De manière à apprécier au mieux
cette question de recherche, trois chapitres comprenant chacun des objectifs et des
hypothèses spécifiques qui traitent de cette question sous différents angles ont été
rédigés.
Les objectifs du premier chapitre étaient (1) de reconstruire la productivité
annuelle de biomasse épigée durant minimalement le dernier cycle de révolution
(2) de comparer le potentiel de productivité des sites et (3) de mettre en évidence l'effet du recépage sur la biomasse sèche, le diamètre basal et la hauteur de la plus grosse tige ainsi que le nombre de tiges en fonction des propriétés du sol de chaque site. Pour ce faire, la signification de la relation linéaire entre la surface basale de la tige de plus gros diamètre et la biomasse sèche a été testée. Ensuite, via des analyses de dendrochronologie, les dynamiques de croissance annuelle ont été étudiées afin de dégager les influences de l'historique de recépage ainsi que celles des conditions de site. Enfm, l'effet de l'âge du système racinaire sur la productivité a été testé à différents sites en comparant la productivité de tiges de mêmes âges récoltées sur des souches d'âges différents.
Les objectifs du deuxième chapitre étaient (1) de comparer et de quantifier les effets intra- et inter-sites des conditions pédoclimatiques sur le rendement et (2) de développer des modèles pédoclimatiques afin de comparer les effets du sol et du climat. Le but ultime était de pouvoir estimer le potentiel de productivité d'un site en fonction de variables simples afin d'éclairer le plus possible les producteurs sur le potentiel de leurs terres en vue de l'établissement éventuel d'une CCR de Salix. En conséquence, toutes les variables pédoclimatiques ont été testées afin de voir si elles étaient en mesure d'expliquer significativement la productivité. Également, l'hypothèse que tous les sites soient limités par les mêmes contraintes climatiques a été testée. Finalement, il a été testé si les rendements annuels pouvaient être expliqués par des seuils de variables pédoclimatiques.
Les objectifs du troisième chapitre étaient (1) de quantifier dans quelle mesure les variations des équilibres nutritionnels foliaires inter-sites et inter-annuels sont imputables aux conditions édaphiques et climatiques et (2) de développer des modèles capables de prédire le rendement annuel à l'aide de variables foliaires. Pour ce faire, il a été testé si une signature nutritionnelle foliaire spécifique au site peut-être mise en évidence, indépendamment des fluctuations nutritionnelles annuelles. Ensuite, il a été testé si les nutriments foliaires étaient linéairement liés aux variables climatiques, pédologiques et à la productivité annuelle. Finalement,
il a été testé si des modèles basés sur des effets seuils étaient capables d'expliquer
Fontana Mario1•2, Benoît Lafleur1, Michel Labrecque2, François Courchesne3,
Nicolas Bélanger1 .4
1Centre d'étude de la forêt, Université du Québec à Montréal, C.P. 8888, Suce. Centre-Ville, Montréal, Québec, H3C 3P8, Canada
2
Institut de recherche en biologie végétale, Jardin botanique de Montréal, 4101 rue Sherbrooke est, Montréal, Québec, H1X 2B2, Canada
3Département de géographie, Université de Montréal, C.P. 6128, Suce.
Centre-Ville, Montréal, Québec, H3C 3J7, Canada
4UER science et technologie, Téluq, Université du Québec, 5800 rue Saint-Denis, bureau 1105, Montréal, Québec H2S 3L5, Canada
1.1 Abstract
Aboveground biomass yields of short rotation cultures (SRC) of willow can vary substantially depending on site quality. Among others, aboveground biomass
yields depend on climatic conditions, soil properties, age of the SRC and number
of harvesting cycles. ln this study, we investigated the effects of coppicing on growth variables (i.e. largest basal stem, height and aboveground biomass) at ten SRC of Salix miyabeana SX67 established on various soils in southem Quebec. More than 1100 shrubs with stool ages varying between one and fifteen years
were measured. Strain analysis was carried out to calculate past annual
aboveground productivities, and maximum annual yield potential was quantified
at each site. Annual growth rates were highly variable and depended on site and
coppicing history. To achieve optimal stool development and aboveground yields, two to three growing seasons following coppicing are necessary for sandy and clayey sites, respectively. The delays for reaching maximum yields were
shortened when soi! cation exchange capacity was dramatically low and were
prolonged when soi] was physically restricting stool development. This lag influenced the total yield of the first rotation and also modulated the magnitude of the increase of aboveground biomass that is generally observed in the second rotation. To increase yields in southern Quebec, our results suggest that it is preferable to extend the length of the first rotation instead of coppicing at the end of the first growing season after establishment.
Keywords: Willow; short rotation culture, annual yield, soi] texture, coppicing, root system age
1
-1.2 Introduction
The use of willows (Salix spp.) is considered for various ecological applications such as bioenergy (Volk et al. 2004; Karp & Shield 2008; Guidi Nissim et al. 2013), phytoremediation (Weih & Nordh 2002) and waste water and sludge filtration (Labrecque et al. 1998; Dimitriou et al. 2006; Cavanagh et al. 2011). Willows can colonize and perform relatively weil on various soi! types, which makes them an interesting option for landowners with unused marginal land (Christersson 1986; Karp & Shield 2008). Short rotation culture (SRC) of willow has recently grown in interest in Quebec as yields of Salix viminalis planted at a density of 18 000 stools ha·1 in the warm southem region were reported to be as high as 70 Mg ha·1 of dry weight (DW) after a second rotation of three years (Labrecque & Teodorescu 2003). This cultivar is also known for its high potential productivity in other regions with similar temperate climates [ e.g., Verwijst (1996), Bergkvist and Ledin (1998) in Sweden, and Stolarski (2008) in northern Poland], although yields in southern Quebec appear to be in the upper tier of ali yields reported for such climates. Cultivars of S. miyabeana also seem to be very weil suited for SRC in the southern region because it has a greater resistance to insect and disease than S. viminalis and tbus, shows more consistent yields (Labrecque & Teodorescu 2005).
The productivity of willows can nevertheless be negatively impacted by climate (e.g. short growing season degree days, and low precipitation and soi! moisture) and soi! (e.g. low nutrient availability or contarninants) (Tahvanainen & Rytkonen 1999; Trapp et al. 2000; Teillon et al. 2013). Onder certain conditions, the productivity of SRC of various willow cultivars has been reported to be qui te low, i.e. 1 to 5 Mg DW ha year·1 (e.g. Heinsoo et al. (2009) in Estonia, Tahvanainen and Rytkonen (1999) in Finland, and (Ens et al. 2013) and Moukoumi et al. (20 12) in different locations in Canada, including the dry Prairie provinces with relatively short summers). In particular, climate was shawn to severely impact willow biomass production. A meta-analysis conducted in Sweden on SRC of willow with high soi! nitrogen (N) contents (75-165 KgN ha-1) showed that yields
-could be modeled at the landscape scale with radiation use efficiency as the main independent variable (Sannervik et al. 2006), whereas Priee and Clancy (1986)
and Guidi and Labrecque (20 1 0) demonstrated the importance of having sufficient
precipitation for optimum willow productivity. Soi! nutrient availability was also
shown to impact willow biomass production. Increased soi! N availability following fertilization generally leads to greater willow yields, especially for soils
with initially low nutrient availability (Labrecque & Teodorescu 2003). Soi! pH and total calcium (CaO) were also shown to control S. purpurea yields of nine SRCs established from southem Ontario to central Alberta (Ens et al. 2013).
Willow aboveground biomass production is normally lower during the first
growing season compared to subsequent years within the same rotation, whether
the SRC has just been established (first rotation) or is in its second or third rotation (Verwijst 1996; Labrecque & Teodorescu 2005). However, a meta-analysis from data of 2082 willow SR Cs in Sweden showed that yields increased by 60% from the ftrst to second rotation (Mola-Yudego & Aronsson 2008). Similarly, Volk et al. (2011) observed an asymptotic increase of aboveground
biomass from the first to the fourth rotation. This is likely explained by a delay of
the rooting system to fully establish and acquire soi! resources (i.e. water and
nutrients). Moreover, coppicing is often done in the first stage of growth. Despite few studies on its effects on willow productivity, coppicing is reported to
stimulate the production of fine roots (Berhongaray et al. 2015). In tum, it decreases competition by weeds and leads to resprouting of multiple and vigo rous
stems (Guidi et al. 2013). Coppicing of willow at initial stages tends to increase
stem growth and maximum root diameter (Crow & Houston 2004). In this respect, producers will generally coppice after one full growing season of the first rotation to increase the number of stems per stool and to promote aboveground biomass production for following years. The benefits of coppicing on growth were
reported to be small on sandy soils, probably because nutrient and water availability are intrinsically low. Positive coppicing effects were more frequently observed for clayey soils (Abrahamson et al. 2002). The gains on basal main stem
diameter, height and weight induced by coppicing also varied among species and clones (Guidi Nissim et al. 2013). As a whole, however, studies on the effects of coppicing on willow growth remain relatively anecdotic and more robust scientific studies are required to identify the conditions (and timing) under which it should be conducted.
Measuring stem diameter and height as weil as total aboveground biomass after a rotation of a few years is an integrative measure of site productivity (Brown 1976; Labrecque & Teodorescu 2001). Telenius and Verwijst (1995) showed that the strong relationships between stem diameter, height and aboveground biomass allow for the development of allometric equations for the non-destructive (i.e. mostly stem diameter measurements) but diligent estimation of biomass yields of specifie cultivars with satisfactory precision. This method could be used to decide whether the stands have reached financial maturity and should be harvested. Such integrative growth data, however, does not provide the detailed information needed to fully elucidate seasonal (climate, water and nutrients), coppicing and stool age (rotation associated to harvest) effects on willow growth and biomass production. For example, Mola-Yudego and Aronsson (2008) suggested that higher annualized yields from the fust rotation were achieved with four growing seasons instead of five. Annual yield data could be of significant value to assess whether coppicing and number of rotations have a measurable impact on willow productivity. In this context, the objective of this study was to reconstruct an nuai aboveground biomass production (using a combination of stem diameters and dendrochronological measurements) in a series of willow SRCs in southern Quebec at various sites and covering different root system ages as a means to determine the impact that coppicing and rotation have had on yields.
1.3 Material and methods
1.3.1 Study sites
This study used a network of eighteen SR Cs of S. miyabeana SX67 established at nine different sites in southern Quebec on various soi! types (Tables 1 and 2). In
ali SRCs, SX67 cuttings of 20 to 25 cm in length were inserted in the soi! to a depth of about 15-20 cm at an interval of 30 cm along a single row design with a spacing of 1.8 rn between the rows (approximate density of 18,500 stools ha-l) using a planting machine. The cuttings were from one-year-old stems of about 3 rn long and 1-2 cm in diameter that showed no symptom of disease on bark or wood. For the ABI, ALB, BOl, LA V, MTL, RXP, SJPJ and STR sites, row lengths of SX67 were over 100 meters at a typical monoculture site, whereas SX67 was distributed in randomized split-blocks at the HTG site (1 0 x 12 rn),
which consists of a clonai trial. Coppicing was generally done in the fall of the first growing season. However, sorne SRCs were either not coppiced or coppiced after the second growing season only (see Tables 1 and 2 for details). Harvesting was generally done three to five years after coppicing. Before SRC establishment, weeds were controlled using mechanical soi! preparation (i.e. where stoniness was low, ploughing in the fall of the previous year was followed by cross-disking just before spring planting). Herbicides (i.e. normally glyphosate 2 to 4 L/ha) were applied before soil ploughing in the fall (Guidi et al. 2013). The fact that the measurements were performed in SRCs with different numbers of coppicing and rotations allowed to specifically test their effects on aboveground yields (see further details in this section).
The SRCs established at the ABI, ALB, HTG, LAY, RXP and STR sites were on former agricultural soils of varying textures, whereas MTL was planted on a sandy (loamy sand) forest soi! after a mixedwood stand was harvested and the soi! surface had been cleared from ali residues (Table 1.2). Most sites were characterized by slightly acidic soils (pH from 5.2 to 5.6), except for soils at the BOl and HTG sites which were near neutra( (pH from 7.3 to 7.5). Also, the RXP site was the only one where SRCs were established on an organic soil (Table 1.2).
Table 1 . 1 Mean diameter (D) and height (H) of t h e stems and number of s t ems per stoo l measured in the short l argest rotation cu l tures (SRC) of Aboveground biomass yie l d, the years fo r which de n drochrono l gy estimations were perfo r med and Pea r so n cor r e l at i o n coefficient between a r ea ofthe la r gest diamete r and abovegrou n d b i omass d r y weight ( r p A:W) are r eported w h e n availa bl e . S oit Stem Field Nu rn b e r M e a s ure Year S it e S RC Ye ar s ampling Rotation and stool mea s ur e ment D H of s tem s d y ield y ield e s tabli s hed n (mm) (rn ) year per stool ( tha-l ) estimated y ear age s bioma ss ) AB 11 2008 20 11 S3R4 20 11 36 23.2 2.9 1 0 . 8 1 4.0 2009 A bi tib i AB12 2008 20 11 2 S2R6 20 1 3 36 23 . 9 NA NA NA 20 11 A l ba n e ! ALB I 2009 20 1 3 S4R5 20 1 3 50 46.5 5.2 2.5 NA 20 1 0 BOi l 2005 20 11 2 S3 R 7 20 11 36 34.8 5.4 2.6 38.5 2009 S3R5 20 11 t 36 40.8 5.3 5 .1 44.7 Boisbriand S2R4 20 1 0t 36 32.4 4.9 5.5 3 1. 8 BOI2 2007 NA S I R3 2009t 36 20.4 3.5 8.5 1 9. 1 S IR I 2007 36 11. 6 1.9 3 2.9 4 S3R I 3 2012 36 43.7 5.5 NA NA 20 1 0 S4R I1 2009 24 50.0 6.8 5.2 NA 3 S2R9 2007 24 27.8 4.8 4.6 1 9.9 S3R7 2005 24 34.0 4.5 6.5 NA Hunt i ngdon HTG 1 2000 20 1 2 2 S2 R 6 2004 24 27.5 4.0 1 2.1 NA S 1 R5 2003 24 1 6.5 2.9 1 1.3 1 5.3 S3R4 2002 24 38.9 4.4 3 34.9 S2R3 200 1 24 32.4 3.7 3 2 1. 5 S 1 R2 2000 32 20.2 2.4 4.2 6.5 A n ID is a t tr i b u te d to eac h SRC to disti n g ui s h t h em betwee n a nd w ithin s it es. T h e co l u mn e nti t l e d Ro t atio n a n d Meas ur e m e n t yea r i n d i cate r espect i ve r ota ti ons of t h e SRC a nd t h e yea r fo r w h ic h g r owt h varia bl es were meas u red. T h e n u mbe r of s h r u bs m eas ur e d w ithin each S R C is a l so indi ca t ed cop pi ce d after o n e grow in g seaso n , u n l ess ot h erw i se indi cated ; t In d i ca t es a S R C wh i c h was n o t coppiced; t l ndicates a S R C wh i c h was coppiced after two growing seaso n s.
Table 1 . 1 (Continued) Mean diameter (D) a nd he i g h t (H) of t h e ste m s a n d numbe r of ste ms per stoo l measured i n t he s h ort l a r gest rotation cu l tu r es SX67. Aboveground bioma ss yie l d, the yea r s for which d e ndrochro n o l gy estimations we r e performed and Pear so n corre l ation coeffic i ent t h e area of th e l a r ges! diameter and aboveground biomass dry weight (rp A:W) a re r eported w h en avai l ab l e . S oil S tem F i e ld N u rn b e r Me asure Yea S ite S R C Y ear s amplin g Rotation and stool mea s ur e ment D H of s tem s d y ield y ield e s tabli s h e d n (mm ) ( rn ) yea r p e r s tool ( tha-l ) e s timated y ear a g e s { bioma ss ) LAV 1 2005 20 11 S5R7 20 11 t 36 44.8 6.4 2.1 46 . 8 2007 Lava l LAV2 2005 NA S2R3 2007 36 30.9 4 .8 5.4 23.9 Mont -S3R4 20 11 36 25 .3 3.2 2.8 8.4 2009 Laur i er MTL l 2008 20 11 2 S2R6 20 1 3 1 6 1 8.5 NA NA NA 20 11 RXP I 2008 20 11 S3R4 20 Il 36 36.3 4 . 6 NA 30.3 2009 RXP2 2008 20 11 2 S I R6 20 1 3 20 1 5.3 NA NA NA Roxton Pond RXP3 2006 No S2R3 2008 36 36.3 5. 1 3.1 38.7 RXP4 2006 No S2R2 2007t 36 23. 1 3.5 9.0 1 5.3 2 S2RS 2013 50 33 . 0 N A NA NA SJP JI 2009 2011 2009 Saint -Jea n-S3R3 20 1 1 t 36 35.2 4.2 2.7 27 . 9 Port -Jo l i S I R2 2007 36 1 1.5 2.0 1 0.9 4.3 SJPJ2 2006 NA S I R I 2006t 36 6.9 1 .4 2.6 1. 0 An ID i s att r ibu t ed to each SRC to distinguis h t h em between and within si te s. The column entit l ed R otation a n d Measureme nt year indicate r espectively ro t a ti ons of t h e SRC and the year for w hich growth va riables were me asured. T h e numb e r of sh r ubs me as u r ed w i th in each SRC i s a l so ind i cate coppiced afte r o n e growi n g season, unle ss otherwise indicated; t Indicat es a SRC w h ich was not coppiced; t I n dicate s a SRC which was coppiced after two growing seasons.
Table 1.1 Site Saint -R oc h -(Continued) Mean diamet er (D) a nd height (H) ofthe stems and number of s tem s per s tool mea s ur e d in the s hort largest rotation cultures SX67 . Aboveground biomass yie ld , th e yea r s for which dendrochronolgy estimations were performed a nd Pearson correlation coefficient the area of the l argest diam ete r an d a boveground biomass dry weight (rp A:W) are reported w h e n avai l a ble. So il Ste m F i e l d N umb e r Meas ur e Yea S R C Year sampl in g R otatio n and stoo l m eas u reme n t D H of ste m s d yie ld y i e ld estab li s h ed n ( mm ) ( rn ) year per s t oo l (t h a -l) est im yea r ages (biomass) STRI 2005 20 1 1 2 S3R7 2011 36 29.7 4.2 7.6 26.9 2009 S3R5 201It 36 32.6 4.4 3.5 41.4 de -l' Achigan STR2 2007 NA S2R4 2010t 36 23.6 3.7 5.3 22.4 STR3 2006 NA S2R2 2007t 36 23.0 3.0 7.8 21.2 Mont-NA S3R3 2008 36 20.7 3 . 2 3.4 13.0 Laurier MTL2 2006 NA S2R2 2007t 36 16.1 2 . 5 3.1 5.4 Normandin NOR ! 2007 NA SIRI 200 7 t 36 4.6 0.7 3 . 6 0.9 An lD is attributed to each SRC to di st ingui s h them between and within s ite s. The column entitled Rotation and Measurement year indicate respectivel rot a tions of the SRC and the year for which growth variab l es were measured. The number of shrubs measured within each SRC i s also indicated coppiced afte r one growing season, un l ess otherwise indicated ;
t
lndicate s a SRC which was not coppiced; t Indicate s a SRC which was coppiced after two growing seaso n s. The shaded area indicate s SRCs that were on l y u se d to build the mode ! pre se nted i n Figure 2.18 Tab l e 1.2 Previous land use and genera l climat i c a n d soil properties of the s h ort rotation cultures ofSX67 for w hi ch maximum y i e l d potent i a l was esti m ated. So il A n nuai A n nuai S and C la y O. M . S i te Latitude Lon g itud e ty pe / Pr ev iou s S oil F ir s t growing r a infall d e gr e e-da ys pH l a nd u s e pr e paration se a s on t ( mm ) (S oC) --(% ma ss) --Ab i tibi C l ay 1 (AB TI a n d 48.65852 -77.6358 1 2 Ti ll age 2009,20 1 2 1 718 1 609 20 . 6 43. 1 7 . 9 5.6 ABI2) agriculture Albane] 48.87 1 624 -72.425 1 07 Si l t loam 1 Ti ll age 20 1 0 664 1 676 32.2 9.6 1 0.2 6.2 (ALBI) agriculture Boisbriand Loam/ (BOil) 45.629525 -73.89309 hard wood No till 2006,2009 762 2368 34.9 18.9 9 . 2 7.5 forest Huntingdon 45. 1 44667 -74. 1 42097 Silty clay loam Ti l lage 2001 , 2003, 765 24 1 4 18.9 27.6 11. 2 7.3 (HTG 1 ) 1 agricu l ture 2006 , 20 1 0 Laval 45.553382 -73.833063 (Sandy) loam 1 T i llage 2007 7 1 7 2488 49 . 6 1 1.3 5.4 5 (LAV l ) agricu l ture Mont Laurier 46.455658 -75.498268 Loamy sand 1 T i llage 2009 , 20 1 2 699 2027 74. 1 3 . 7 6 . 9 5.2 (MTL 1 ) mixed forest Roxto n Pond Orga n ic 1 (RXP I a n d 45.558663 -72.6764 1 2 T ill age 2009 864 2333 46 . 2 5.7 67 . 6 5 RXP2) agricu l ture Saint - Jean-Port -Jo l i 47.246 11 9 -70.227056 Loam 1 fo r age No ti ll 2009,2012 748 1 867 30.7 22.9 9. 1 5.3 (SJPJ 1 ) Saint -Roch de Sandy loam 1 l ' Achigan 45.844108 -73 . 6320 1 4 Ti ll age 2006 , 2009 83 1 2288 59.2 8 . 7 4.6 5.6 (STRl) agriculture t Multip l e yea r s indicate mult i ple rotations; tCEC is effective cation exchange capacity; fOn l y fo r ABI2. O.M . refers to organic matter content measured by Joss on i gnition using a muffle furnace
1.3 .2 Field growth survey
The SRCs were monitored non-systematically at the end of the growing season
between 2000 and 2013 (Table 1.1). Each measurement was performed on sixteen
to fifty shrubs in four to nine plots (5 x 5 rn). Plots were selected along one or two
randomly selected rows, depending on the number of plots measured. Each plot
was separated by at )east 20 m. The sampling in each plot consisted of four to ten
healthy/vigorous successive stools along the row and on which height of the
largest stem, the basal diameter at about 5 cm above the collar (later referred as
largest diameter) and the number of stems per stool were measured. For each
stool, ali stems were then harvested for biomass measurement. Fresh weights (including the leaves) were obtained in the field using an electronic scale. Subsamples of 3 to 6 kg (integrating whole stems) were then collected, brought
back to the laboratory and dried to constant weight at 70°C in an oven and
reweighted to convert fresh weight to dry weight. It should be noted that sampling
the stem with the largest diameter from healthy/vigorous stools was systematically applied as a means to provide a proxy for the maximum yield potential (MYP) of a site. This method was used because we were interested in reconstructing annual yields and that dendrochronological work could only be conducted on a limited
number of stems per SRC. It can be considered for SX67 because studies of SX67
generally show that it produces less stems than other productive clones. For example, Guidi Nissim et al. (2013) reported that the number of stems per stool of SX67 did not increase significantly between the first and the third rotations,
unlike Salix eriocephala Mu hl which also has a higher number of stems per stool
compared to SX67. To sorne extent, our approach is inspired from the
methodology used in forestry to estimate site quality index for which only
dominant trees (i.e. the larger stems) are selected for measurement (Carrnean
1975; Perron et al. 2009). Using our approach could, however, be problematic for
Salix clones that produce more stems and distribute much of the biomass in the
1.3.3 Soil sampling and analysis
SRC in each of the nine sites for which the field growth survey had been
conducted (see Table 1.2 for specifie SRCs). The samples were first air-dried in
the laboratory and then sieved to pass through a 2 mm mesh. Soil pH of mineral
samples were measured using a soil:water ratio of 1:2, whereas a ratio 1:10 was
used for organic soil samples (i.e. RXP). Using a muffle fumace, organic C was
measured by 1oss of ignition after 15 minutes at 575°C and then inorganic C
(CaC03) after 10 minutes at 1000°C (Rabenhorst 1988). Soi! parti cie size
distribution was analyzed using the Horiba Partica LA-950v2 Laser Particle
Analyzer (Horiba Instruments, Irvine, CA, USA). Samples from BOl, MTL and
SJPJ were first pre-treated to destroy sesquioxides. In this respect, samples had to
be bleached twice with NaOCI and thoroughly washed with distilled water.
Samples from RXP contained more than 60% of organic matter and only small amounts of mineral particles. Th us, the bulk of organic matter was first destroyed
by loss on ignition and then treated with NaOCl before yielding enough particles
for size analysis. Soil exchangeable cations were measured by atomic absorption (Varian AA-1475, Palo Alto, US) after they were extracted using an unbuferred 0.1 M BaCb solution (Hendershort et al. 2007a). Cation exchange capacity (CEC)
was defined as the sum of exchangeables cations (Ca, Mg, K, Na, Mn, Al and Fe).
1.3 .4 Relationship between area of the largest diameter and dry biomass
Stem and root system ages ofthese SRCs ranged from 1 to 7 years and from 1 to 9 years, respectively (Table 1.1 ). He nee, we identified the root age and the stem age
in a single descriptor (i.e. SaRa where S is stem, Ris root and ais age of the stem and root system). A linear relationship between the area of the largest diameter
and aboveground biomass was tested for ail available measurements. Between
2000 and 2013, aboveground biomass was measured twenty-four times at seventeen SRCs of the main eight sites. Two additional sites for which three more