HAL Id: pastel-00004154
https://pastel.archives-ouvertes.fr/pastel-00004154
Submitted on 12 Feb 2009HAL is a multi-disciplinary open access
archive for the deposit and dissemination of sci-entific research documents, whether they are pub-lished or not. The documents may come from teaching and research institutions in France or abroad, or from public or private research centers.
L’archive ouverte pluridisciplinaire HAL, est destinée au dépôt et à la diffusion de documents scientifiques de niveau recherche, publiés ou non, émanant des établissements d’enseignement et de recherche français ou étrangers, des laboratoires publics ou privés.
metabolic utilization of dietary amino acids in
simple-stomached animals and humans
Amélie Deglaire
To cite this version:
Amélie Deglaire. Gut endogenous protein flows and postprandial metabolic utilization of dietary amino acids in simple-stomached animals and humans. Life Sciences [q-bio]. AgroParisTech, 2008. English. �NNT : 2008AGPT0049�. �pastel-00004154�
L’Institut des Sciences et Industries du Vivant et de l’Environnement (Agro Paris Tech) est un Grand Etablissement dépendant du Ministère de l’Agriculture et de la Pêche, composé de l’INA PG, de l’ENGREF et de l’ENSIA
(décret n° 2006-1592 du 13 décembre 2006)
N° /__/__/__/__/__/__/__/__/__/__/
T H È S E
pour obtenir le grade de
Docteur
de
l’Institut des Sciences et Industries du Vivant et de l’Environnement
(Agro Paris Tech)
Spécialité : Nutrition Humaine
présentée et soutenue publiquement par
Amélie DEGLAIRE
le 13 août 2008
FLUX DE PROTÉINES ENDOGÈNES DANS L'INTESTIN ET
MÉTABOLISME POSTPRANDIAL DES ACIDES AMINÉS ALIMENTAIRES
CHEZ LES MAMMIFÈRES MONOGASTRIQUES ET CHEZ L'HOMME
Directeur de thèse : Pr. Daniel TOMÉ Codirecteur de thèse : Pr. Paul J. MOUGHAN
Travail réalisé en co-tutelle:
INRA/AgroParisTech, UMR 914, Laboratoire de Physiologie de la Nutrition et du Comportement Alimentaire, 75005 Paris, France
Massey University, Riddet Institute/Institute of Food, Nutrition and Human Health, Palmerston North, Nouvelle-Zélande
Devant le jury :
M. Cynthia WHITE, Professeur, MASSEY UNIVERSITY, Palmerston North ………..……….. Présidente M. Malcolm FULLER, Professeur, STONY BROOK UNIVERSITY, New York ………. Rapporteur Mme Alison DARRAGH, Docteur, FONTERRA LTD., Palmerston North……… Rapporteur M. Ravi RAVINDRAN, Professeur, MASSEY UNIVERSITY, Palmerston North ……… Rapporteur
RESUMÉ
La qualité nutritionnelle des protéines alimentaires dépend de deux paramètres clés : la digestibilité iléale vraie et l’utilisation métabolique des acides aminés (AA) absorbés. Les objectifs de cette étude étaient de déterminer l’influence de deux facteurs alimentaires (facteurs antinutritionnels et peptides) sur les flux iléaux de protéines endogènes; de valider la technique d’intubation utilisée chez l’homme pour prélever des effluents iléaux; de comparer le métabolisme postprandial d’AA alimentaires suivant leur forme d’ingestion; d’évaluer la validité du modèle porc pour prédire la digestibilité protéique chez l’homme. Les investigations se sont déroulées chez le rat, le porc et l’homme. Les effluents iléaux étaient collectés chez le rat après euthanasie, chez le porc vivant équipé d’une canule en aval de la valve iléo-caecal et chez l’homme conscient équipé d’une sonde naso-iléale. L’azote (N) et les AA endogènes iléaux étaient déterminés suite à un repas protéiprive (PP), un repas contenant de la caséine, intacte (C) ou hydrolysée (HC), marquée avec l’isotope stable 15N ou un repas à base d’AA libres (A) mimant la composition de la caséine et privé de certains AA non essentiels afin de mesurer directement leur flux endogènes. De plus, la centrifugation et ultrafiltration des effluents HC permettaient de déterminer les protéines endogènes iléales et le recyclage d’N alimentaire (15N). Les facteurs antinutritionnels issus d’un extrait brut de haricots (Phaseolus vulgaris), ingérés au niveau habituel de consommation chez l’homme, augmentaient les flux iléaux de protéines endogènes (rat, repas PP). Après adaptation au repas, le bilan azoté corporel per se n’avait pas d’influence sur les flux iléaux de protéines endogènes (rat, repas PF et A) mais les peptides alimentaires (repas HC) augmentaient les flux iléaux d’AA et N endogènes par rapport au repas PP. Les peptides alimentaires (HC), comparés aux peptides libérés naturellement dans l’intestin au cours de la digestion (C), n’augmentaient pas les flux iléaux de protéines endogènes (rat, porc, homme). Le recyclage d’N alimentaire dans les protéines endogènes était maximal chez le rat nourri en continu, plus faible chez le porc nourri en aigu et minimum chez l’homme nourri en aigu (respectivement : 65, 21 et 11%). Par ailleurs, ces recherches ont montré que l’intubation naso-iléale utilisée pour prélever des effluents iléaux chez l’homme était une méthode juste et que le porc était un modèle valide pour prédire la digestibilité iléale vraie chez l’homme. Enfin, la forme d’ingestion des AA alimentaires (HC ou C) influençaient le devenir métabolique des AA alimentaires, en particulier par rapport aux cinétiques de catabolisme des AA. Cependant, la valeur nutritionnelle était, au final, similaire pour HC et C.
ABSTRACT
Dietary protein quality depends on two key measures: true ileal protein digestibility and the metabolic utilization of absorbed amino acids (AA). The objectives of this study were to determine the influence of two dietary factors (antinutritional factors and peptides) on ileal endogenous protein flows; to validate the intubation technique used in humans for ileal digesta sampling; to determine the postprandial metabolic utilization of dietary AA depending on their delivery form and to assess the validity of the growing pig for predicting true ileal protein digestibility in the adult human. Investigations were undertaken in the growing rat, growing pig and adult human. Ileal digesta were collected from euthanised rats, post valve T-caecum cannulated pigs, and naso-ileal intubated conscious adult humans. Ileal endogenous nitrogen (N) and AA were measured using a protein-free (PF) diet, diets containing 15N-labelled casein in the intact (C) or hydrolysed (HC) form, or a diet based on free AA (diet A), for which some dispensable AA were omitted to allow a direct determination of their endogenous flows. Digesta centrifugation and ultrafiltration (diet HC) allowed for the determination of ileal endogenous protein flows and the extent of tracer (15N) recycling.
Antinutritional factors from a crude extract of kidney beans (Phaseolus vulgaris), when given at amounts commonly ingested in practice, enhanced ileal endogenous protein flows (rats, PF diet). After adaptation to the diet, body N balance per se did not influence ileal endogenous protein flows (rats, diets PF and A) but dietary peptides led to greater ileal endogenous AA and N flows compared with a protein-free diet. Dietary peptides (HC), compared with peptides naturally released in the gut during protein digestion (C), did not enhance ileal endogenous protein flows (rats, pigs, and humans). The extent of tracer recycling, however, was maximal in frequently-fed rats, lower in meal-fed pigs and minimal in meal-fed humans (65, 21, and 11% of 15N-labelled ileal endogenous proteins, respectively). Naso-ileal intubation for ileal digesta sampling in humans was shown to be an accurate method and evidence was obtained supporting the growing pig as a valid model for predicting true ileal protein digestibility in the adult human. Finally, the form of delivery of dietary AA (from HC or C) influenced the postprandial metabolic fate of dietary AA, especially in terms of AA catabolism kinetics. However, the overall nutritional value of C and HC were similar.
ACKNOWLEDGMENTS
The work reported in this thesis was undertaken in collaboration between the Riddet Institute (Massey University, Palmerston North, New Zealand) and the UMR914 Nutrition Physiology and Ingestion Behaviour (INRA/AgroParisTech, Paris, France) under the co-supervision of Distinguished Pr Paul Moughan and Pr Daniel Tomé.
I would like to express my sincere gratitude to Pr Moughan, my chief supervisor, for his continued guidance and encouragement. The time and energy he has spent on this work is much appreciated. I would also like to sincerely thank Pr Tomé for initiating this collaborative work and allowing me to work in his laboratory. I sincerely thank Dr Cécile Bos (INRA/AgroParisTech, France) for her support and guidance throughout the entire period of my doctoral study and for her assistance with the human study.
I would like to thank Dr Gordon Reynolds (IFNHH, New Zealand) for performing the surgical preparations of the pigs. My grateful thanks to Mr Shane Rutherfurd (Riddet Institute, New Zealand) for all his assistance during the animal experiments and for many helpful discussions. Thanks to Dr Claire Gaudichon (INRA/AgroParisTech, France) for having me in her research team. Thanks to Dr Robert Benamouzig (CRNH-IdF, France) for allowing the completion of the human study in his hospital service. A special thanks to Dr George Arinei (CRNH-IdF, France) for all the time and energy he spent on the human study. Thanks also to Mrs Catherine Luengo (INRA/AgroParisTech, France) for her help during mass spectrometry analysis and to Dr Francois Mariotti (INRA/AgroParisTech, France) for his helpful suggestions for the validation of the intubation method. Thanks also to Dr Klaus Petzke (DIfe, Germany), to the staff of the nutrition laboratory (IFNHH, NZ), in particular Mrs Fliss Jackson and Ms Leiza Turnbull, for sample analysis. Thanks to the staff of the feed processing unit (IFNHH, massey University, New Zealand), especially Mr Don Thomas and Mr Kaliwyn Pereka, for helping with feed preparation. Thanks to Dr Nicole Roy (AgResearch, New Zealand) for her assistance with setting the pig experiments. Thanks also to Mrs Anne Singh (Fonterra Ltd., New Zealand) for helping with determination of the casein hydrolysate molecular weight profile.
We gratefully acknowledge Mr Jacques Fauquant (INRA, France) for providing 15 N-labelled casein. Thanks to Sanitarium (New Zealand) for providing some cooked wheat for the pig study. Thanks also to Ajinomoto Co. (France) for providing crystalline amino acids for the human study.
I would like to thank AgroParisTech, the Riddet Institute and the “fondation de France” for a grant towards my research.
I would like to acknowledge Zhengrong Yu (INRA/AgroParisTech, France) who assisted in pig care during her internship and Claire Boutry (INRA/AgroParisTech, France) who helped during the human study.
Last but not least, I would like to thank all of my friends who have given me so much support and made these four years enjoyable. A special thanks to my dear Jennie Jean, my
little pidgin friend. Thanks to my office mates, Cheryl for always listening to me, Daniel
for keeping me company during the late evenings at work. I sincerely thank my “proof-readers”: Aurélie, Liat, Estelle and Karine. Thanks to Romaric, Nicolas, David, Thibaud, Laureline and Mick for keeping alive the “French connection” in New Zealand. Thanks to my flatmates, Cam, Saija and Dan for enduring my early or late noise. Thanks to Laure for always being here while I was in Paris. Thanks also to Clémence and Barbara, for their encouragement. I would also like to thank my dear Cha for always being present, in person or virtually. I also thank my parents, all my family members, and Xavier for always supporting me through the good and difficult stages of this PhD and overseas experience.
TABLE OF CONTENTS
Abstract……… i
Acknowledgements……….. ii
List of Tables………vi
List of Figures………..… x
List of abbreviations...………...………..… xii
PREFACE…………...1
CHAPTER I REVIEW OF THE LITERATURE…………....3
Introduction……………4
I. Evaluation of dietary protein quality in adult humans.…………..5
1. Dietary protein and amino acid requirements 5 2. In vivo protein quality index 9 3. Digestibility 13 II. Nitrogen flows along the digestive tract…………. 19
1. Endogenous nitrogen flows 19 2. Protein digestion and absorption 27 3. Ileal nitrogen losses 30 III. Determination of ileal nitrogen flows………..………. 33
1. Ileal digesta collection 33 2. Measurement of endogenous nitrogen and amino acid losses 41 IV. Dietary modulation of ileal endogenous nitrogen losses………...... 50
1. Dry matter intake 50 2. Dietary protein 51 3. Antinutritional factors 53 4. Dietary fibre 56 5. Dietary electrolyte balance 57 V. Postprandial metabolic fate of dietary nitrogen……….…….. 58
1. Regional metabolism and availability of dietary amino acids 59 2. Dietary modulation of postprandial metabolism of dietary nitrogen 65 Conclusions and justification of the experimental work………..72
CHAPTER II COMMERCIAL PHASEOLUS VULGARIS EXTRACT (STARCH
STOPPER) INCREASES ILEAL ENDOGENOUS AMINO ACID AND CRUDE PROTEIN LOSSES
IN THE GROWING RAT……….. 115
CHAPTER III FEEDING DIETARY PEPTIDES TO GROWING RATS ENHANCES GUT
ENDOGENOUS PROTEIN FLOWS COMPARED WITH FEEDING PROTEIN-FREE OR FREE
AMINO ACID-BASED DIETS………... 135
CHAPTER IV A CASEIN HYDROLYSATE DOES NOT ENHANCE GUT ENDOGENOUS PROTEIN FLOWS COMPARED WITH INTACT CASEIN WHEN FED TO
GROWING RATS………... 155
CHAPTER V A CASEIN HYDROLYSATE DOES NOT ENHANCE GUT ENDOGENOUS PROTEIN FLOWS COMPARED WITH INTACT CASEIN WHEN FED TO
GROWING PIGS………... 177
CHAPTER VI VALIDATION OF THE INTUBATION METHOD FOR INTESTINAL
DIGESTA SAMPLING IN CONSCIOUS ADULT HUMANS…...…… 202
CHAPTER VII INTACT AND HYDROLYSED CASEIN LEAD TO SIMILAR ILEAL ENDOGENOUS PROTEIN FLOWS AND SIMILAR POSTPRANDIAL RETENTION OF DIETARY
NITROGEN DESPITE DIFFERENT METABOLIC EFFECTS IN ADULT HUMANS………. 221
CHAPTER VIII ILEAL DIGESTIBILITY OF DIETARY PROTEIN IN THE GROWING
PIG AND ADULT HUMAN……….. 253
LIST OF TABLES
CHAPTER ITable 1. Amino acid classification. From Reeds et al. (2000b)………... 8 Table 2. Estimates of dietary amino acid requirements………... 9 Table 3. Amino acid scoring pattern across species………... 10 Table 4. Apparent and true faecal digestibility of nitrogen as estimated in adult humans and growing rats within controlled studies..………... 15 Table 5. Ileal endogenous nitrogen flow and its amino acid composition (mean ± SD) as determined in the rat, pig and human fed a protein-free diet………... 17 Table 6. Daily contributions of endogenous nitrogen secretions to total endogenous nitrogen entering the lumen of the digestive tract in growing pigs. Quoted in Sève et
al. (1997); data from Leterme (1995)……….. 19
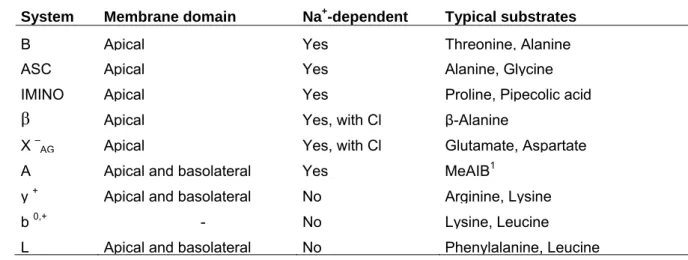
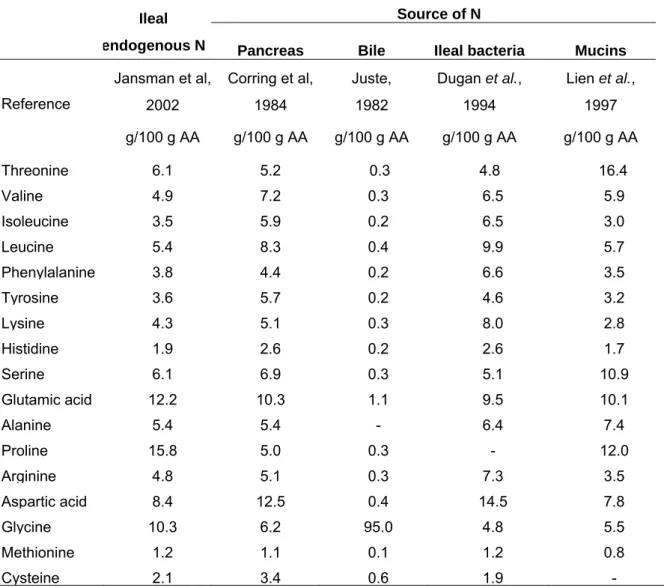
Table 7. Intestinal proteolytic enzymes. From Le Floch & Sève (2000)………. 28 Table 8. Amino acid transport systems of the intestine. Adapted from Kilberg et al. (1993)………... 29 Table 9. Comparison of the amino acid (AA) composition of ileal endogenous nitrogen (N) with endogenous nitrogenous secretions in the small intestine of pigs. 32 Table 10.a. Basal ileal endogenous nitrogen and lysine flows as determined in growing pigs using different methods. ……… 42 Table 10.b. Comparison of overall mean (± SD) of published basal ileal endogenous nitrogen and lysine flows determined in pigs using different methods………... 43 Table 11. Mean ileal endogenous nitrogen flow as determined in adult humans using different methods………. 43 Table 12. Estimates of portal amino acid balance in young pigs fed liquid-milk replacer. ………... 61 Table 13. Effect of the molecular form of dietary amino acids [intact protein (IP), hydrolysed protein (HP), corresponding free mixture (AA)] on the total nitrogen (N) balance. ………... 69
CHAPTER II
Table 1. Ingredient compositions of the preliminary and experimental diets……… 120 Table 2. Determined amino acid and total nitrogen contents of the essentially protein-free diet (PF1) and of the crude Phaseolus vulgaris extract (PVE) and autoclaved Phaseolus vulgaris extract (aPVE)……… 121
Table 3. Amylase inhibitor activity, trypsin inhibitor activity and lectin (PHA) content in the commercial Phaseolus vulgaris extract (PVE) before and after autoclaving.………. 124 Table 4. Mean ileal endogenous amino acid flows (n = 8) at the terminal ileum of
growing rats fed diets PF1, PF2, PF3, or PF4……….. 126 Table 5. Mean endogenous amino acid and total nitrogen flows (mg/100 mg dry matter intake, n = 8) in the faeces of growing rats fed diets PF1, PF2, PF3, and PF4… 127
CHAPTER III
Table 1. Ingredient compositions of the diets given to growing rats…………...…… 139 Table 2. Nutrient and selected mineral contents of the experimental diets given to the growing rats. ……….. 140 Table 3. Endogenous amino acid flows along the digestive tract of growing rats fed diets PF, A1, A2 and HC. ……….. 144 Table 4. Apparent and standardized ileal amino acid digestibility for growing rats fed the synthetic amino acid-based diets A1 and A2………... 145 Table 5. Endogenous ileal amino acid flows determined in rats fed diets PF, A1, A2 and HC. ………... 146 Table 6. Endogenous flows and digestibility of nitrogen at the terminal ileum of rats fed diets PF, A1, A2 and HC………. 146 CHAPTER IV
Table 1. Ingredient compositions of the diets given to growing rats. ………. 159 Table 2. Amino acid composition of casein and 15N-enrichment of individual amino acids.. ………... 160 Table 3. Endogenous nitrogen (isotope dilution) expressed as a percentage of total nitrogen along the digestive tract of rats fed diets C and HC………....……… 164 Table 4. Ileal total amino acid and nitrogen flows determined in rats fed diets C and
HC. ……….. 165 Table 5. Ileal endogenous amino acid and nitrogen flows determined using the isotope dilution method in rats fed diets C and HC. ………... 166 Table 6. Ileal endogenous amino acid flows determined using the isotope dilution or ultrafiltration methods in rats fed diet HC………... 167 Table 7. Apparent and standardized ileal digestibility of nitrogen in diets C and HC fed to growing rats. ………. 168
CHAPTER V
Table 1. Ingredient compositions of the diets fed to growing pigs……….. 182 Table 2. Amino acid and nitrogen contents of the test dietsomitted from diet A…... 183 Table 3. Total ileal amino acid and nitrogen flows in growing pigs fed diets C or HC after 5-day adaptation to the diets………. 188 Table 4. Ileal endogenous flows of aspartic acid and serine in pigs fed diets C, HC and A after 5-day adaptation to the test diets ………. 189 Table 5. Apparent ileal amino acid digestibility for growing pigs fed diet A after
5-day adaptation to the diet……… 189 Table 6. Ileal endogenous amino acid and nitrogen flows in pigs fed diets C, HC or
A after 5-day adaptation to the test diets……… 190 Table 7. Ileal endogenous amino acid and nitrogen flows determined using the isotope dilution or ultrafiltration method in pigs fed diet HC after 5-day dietary adaptation ………... 191 Table 8. Ileal endogenous amino acid and nitrogen flows in growing pigs fed diets
C, HC or A without prior adaptation to the test diets (acute feeding)……… 192
CHAPTER VI
Table 1. Characteristics of the subjects included in the different intubation studies... 206 Table 2. Composition of the meals tested in the different intubation studies………. 207 Table 3. Polyethylene glycol (PEG)-4000 recovery and integrated PEG flows in ileal digesta for adult humans 8 h postprandially……… 212
CHAPTER VII
Table 1. Subject characteristics………... 224 Table 2. Ileal endogenous amino acid and nitrogen flows in adult humans fed a
single mixed meal containing intact casein (C, n = 6), hydrolysed casein (HC, n = 5) or free L-amino acids (A, n =5 ). ……… 233 Table 3. Estimate of dietary 15N recycled within gut endogenous protein (R, %, molecular weight >10 kDa) determined in ileal digesta after ingestion of a single mixed meal containing hydrolysed casein (HC, n = 5) in adult humans………. 234 Table 4. Postprandial metabolic utilization of dietary nitrogen (N) 8 h after ingestion of a single mixed meal containing intact casein (C, n = 6) or hydrolysed casein (CH, n = 5) in adult humans………. 239
CHAPTER VIII
Table 1. Ingredient compositions of the test meals fed to growing pigs and adult
humans ……… 256 Table 2. Ingredient composition of the basal meal fed to growing pigs between
meals of the test meal. ……… 259 Table 3. Apparent and true ileal nitrogen (N) digestibility (%) in adult humans and growing pigs for three dietary protein sources [casein (C), hydrolysed casein (HC) and rapeseed protein isolate (R)]. ……….. 263 Table 4. Apparent ileal amino acid digestibility in growing pigs and adult humans for two dietary protein sources [casein (C) and hydrolysed casein (HC)] ………. 264 Table 5. True ileal amino acid digestibility in growing pigs and adult humans for two dietary protein sources [casein (C) and hydrolysed casein (HC)] and corrected for endogenous amino acid flows determined using the isotope dilution method. ……….. 265
LIST OF FIGURES
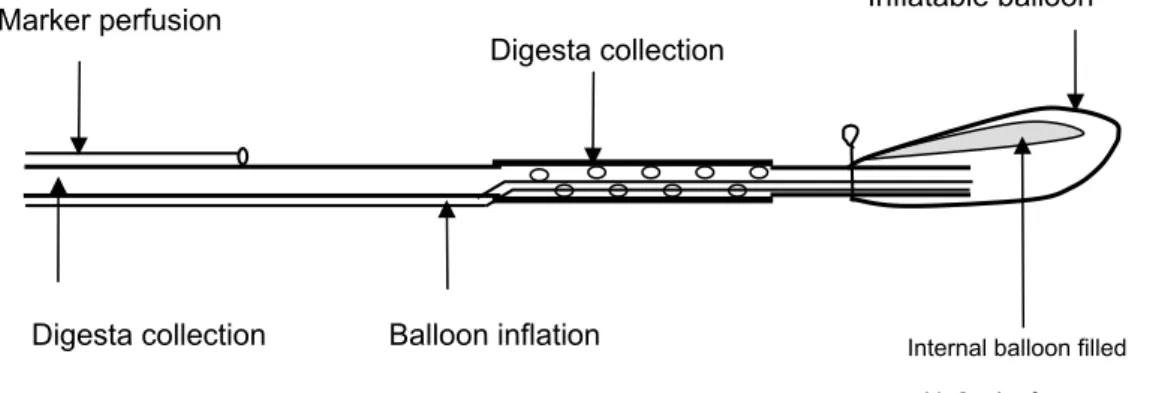
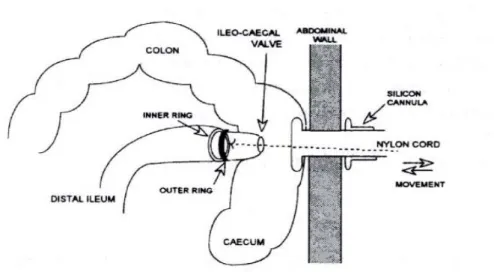
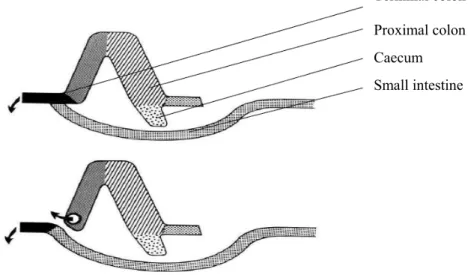
CHAPTER IFigure 1. Naso-intestinal tube used for ileal digesta collection in humans………. 35 Figure 2. T-cannula used in pigs for ileal digesta collection...……… 37 Figure 3. Re-entrant cannula used in pigs for ileal digesta collection..………….. 37 Figure 4. Post-valve T-caecum (PVTC) cannula used in pigs for ileal digesta
collection. Adapted from van Leeuwen et al. (1991). ……… 38 Figure 5. Steered ileal-caecal valve cannula used in pigs for ileal digesta
collection. From Mroz et al. (1996). ………...……… 39 Figure 6. Ileo-rectal anastomosis without exteriorization of the large intestine
(top figure) or with exteriorization of the large intestine by a T-cannula (bottom
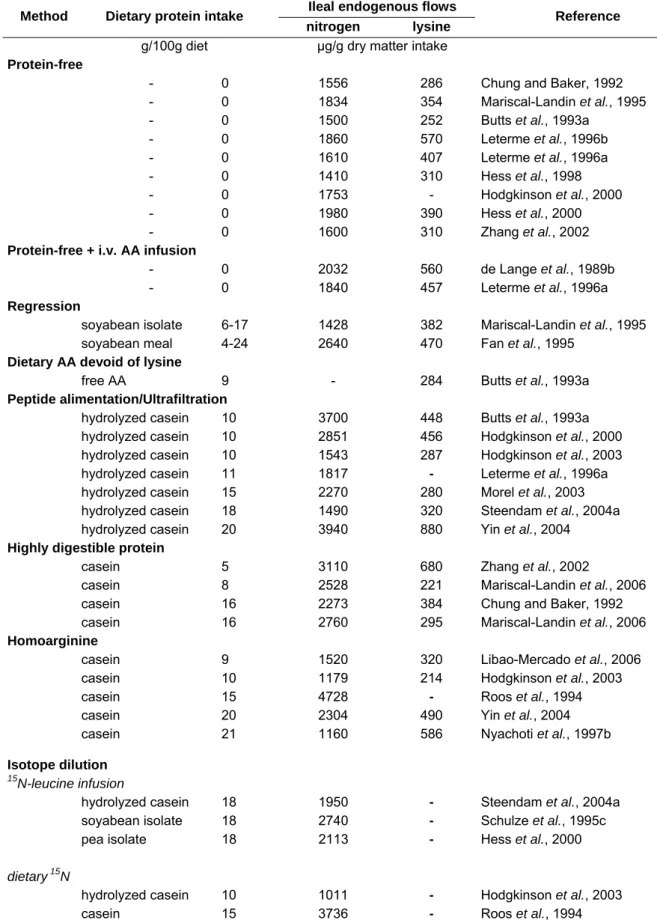
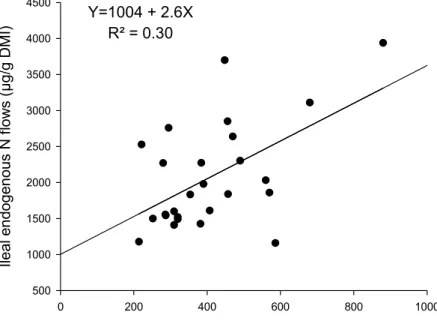
figure). From Sauer et al. (1989). ………... 40 Figure 7. Relationship between ileal endogenous lysine and nitrogen flows in
growing pigs. Data from 26 studies quoted in Table 10.a. ……… 47
CHAPTER II
Figure 1. Protein profile of extracts from a crude commercial Phaseolus vulgaris extract (PVE) and an autoclaved PVE (aPVE)……… 124
CHAPTER IV
Figure 1. Dietary (A) and endogenous (B) nitrogen flows (isotope dilution, μg/g dry matter intake) along the digestive tract of rats fed diets C and HC. ……… 163
CHAPTER VI
Figure 1. Schematic drawing of the triple-lumen tube used to sample intestinal digesta in conscious humans. ……….. 208 Figure 2. Rationale for the intrinsic validation of the intubation method…………... 210 Figure 3. Estimated ileal flows of total fluid (A), PEG (B), endogenous N (C) and dietary N (D) as determined across different intubation studies in adult humans……... 213 Figure 4. Ratio of unabsorbed dietary nitrogen (Nexo, % of the total amount recovered over 8 h) to polyethylene-glycol (PEG)-4000 (% of the total amount recovered over 8 h) as recovered in ileal digesta collected across different intubation studies in humans……… 216
CHAPTER VII
Figure 1. Postprandial kinetics of actual intestinal fluid flow rate (X) and dietary (Y) and endogenous (Z) nitrogen flows in the jejunum (C, n = 4; HC, n = 4) and ileum (C, n = 6; HC, n = 5) after ingestion by adult humans of a single mixed meal containing intact casein (C) or hydrolysed casein (HC)... 232 Figure 2. Postprandial kinetics of digesta total N flows in the ileum of subjects equipped with intestinal tubes after the ingestion of a mixed meal containing intact casein (C, n=6), hydrolysed casein (HC, n=5) or free amino acids (A, n=5)………… 234 Figure 3. Plasma concentrations of glucose (X), insulin (Y) and glucagon (Z) after the ingestion of a mixed meal containing intact casein (C, n = 6), hydrolysed casein (HC, n = 5) or free amino acids (A, n = 5) in adult humans……… 236 Figure 4. Plasma concentrations of total (TAA), dispensable (DAA), indispensable (IAA) and branched-chain (BCAA) amino acids after ingestion of a mixed meal containing intact casein (C, n=6), hydrolysed casein (HC, n=5) or free amino acids (A, n=5) in adult humans. ………... 237 Figure 5. Incorporation of dietary nitrogen into plasma free amino acids (X) and proteins (Y) after ingestion of a mixed meal containing intact casein (C, n=6) or hydrolysed casein (HC, n=5) in adult humans. ………... 238 Figure 6. Dietary nitrogen incorporation into body urea (X), cumulative excretion of urinary urea (Y) and cumulative excretion of urinary ammonia (Z) after the ingestion of a mixed meal containing intact casein (C, n=6) or hydrolysed casein (HC, n=5) in humans. ………. 240 Figure 7. Rates of production of total urea after ingestion of a mixed meal containing intact casein (C, n=6), hydrolysed casein (HC, n=5) or free amino acids (A, n=5) in adult humans…...……….. 241 Figure 8. Rates of production of dietary-derived (X) and endogenous-derived (Y) urea after ingestion of a mixed meal containing intact casein (C, n = 6) or hydrolysed casein (HC, n = 5) in adult humans... ………. 242
CHAPTER VIII
Figure 1. Linear regression relationship between mean values of pig and human true ileal digestibilities (TID) of nitrogen (A) and amino acids (B) for meals based on casein (C), hydrolysed casein (HC), rapeseed protein isolate (R) and a mixture of vegetable-animal proteins (VAP, Rowan et al., 1994). ……… 269
Preface
P
roteins are essential components of the body where they play both functional and structural roles, being major cellular structural elements, biochemical catalysts and also important regulators of gene expression. Discussion of protein and amino acid nutrition thus involves virtually every element of mammalian biochemistry and physiology (Reeds & Beckett, 1997). Proteins were first described in 1838 by the Swedish chemist Jöns Jakob Berzelius who named them from the Greek word πρώτα or "prota", meaning of primary importance. The central role of proteins in living organisms was appreciated only one century later, in 1926, with James B. Sumner showing that the enzyme urease was a protein (Sumner, 1926). Proteins are macromolecules composed of a linear chain of amino acids (AA) that folds in a variety of ways to form a unique 3-dimensional structure as first observed in the 1960s (Kendrew et al., 1958; Muirhead & Perutz, 1963). Twenty amino acids are involved in protein synthesis. Some of these AA (dispensable AA) can be synthesized by the body from other free AA (by transamination or reductive amination), glucose or ammonia (using the Krebs cycle) whereas others (indispensable AA) have to be imported from an exogenous (dietary) source (Eastwood, 2003a). Body proteins are continually broken down and replaced, with an approximate rate of 3−6 g of protein/kg body weight/day for an adult human, resulting in no apparent change in total body protein content (Bender & Millward, 2005). This is a dynamic equilibrium that can be maintained by replacing losses of body protein by an intake of dietary protein. Not only the quantity but also the quality of dietary proteins matter, hence the importance of dietary protein quality evaluation.The nutritional quality of dietary protein depends on protein bioavailability and metabolic utilization. Protein bioavailibility can be estimated in most cases by true protein digestibility determined after correction for intestinal endogenous protein losses, which are more accurate when measured at the ileal level, i.e. before being subjected to the prolific microbial metabolism occurring in the colon. Dietary factors can modulate ileal endogenous protein losses; and this has implications for the methodology used for the measurement of ileal endogenous protein losses. It is thus important to gain further knowledge in this area, as this was the overall objective of the work presented here Dietary factors can also influence protein metabolic utilization, which, in turn, may modulate the overall nutritional value of dietary protein. Further investigations in this direction are urgently required.
CHAPTER I
R
eview of the literature
Introduction
N
utrition research has focused on the capacity of food to meet the metabolic demand for nitrogen (N) and indispensable amino acids (IAA) (FAO/WHO/UNU, 2007). The evaluation of protein quality aims to determine how well dietary protein is digested and absorbed and how well absorbed amino acids (AA) are utilized by the body. The protein digestibility-corrected AA score (PDCAAS) is the current recommended protein quality index (FAO/WHO/UNU, 2007) despite some important limitations. This index takes into account the digestibility of dietary protein and its AA content relative to the requirement pattern (FAO/WHO/UNU, 2007). To date, a level of consensus within the scientific community has been reached for the protein and IAA requirements of man (FAO/WHO/UNU, 2007), although further re-evaluation can still be expected. In addition, whereas the measurement of AA content in dietary protein has significantly improved over the last decades, the accurate determination of digestibility is still critical. Protein digestibility is a determining factor for protein bioavailability (Fuller & Tomé, 2005; FAO/WHO/UNU, 2007), as it indicates the extent of intestinal digestion and absorption of food protein as AA that can subsequently be utilized by the body. Protein digestibility has been reported to differ substantially among diets, in particular between those from developing and developed countries (Gilani et al., 2005). Protein digestibility is indirectly determined from the amount of N flowing at the end of the digestive tract. Gut N flows arise both from undigested dietary N and from non-dietary (endogenous) nitrogenous compounds that have escaped digestion and/or (re)absorption, and are referred to as N losses when determined at the end of the digestive tract. Endogenous N losses account for a substantial proportion of total N losses and thus need to be distinguished from undigested dietary N to correct apparent digestibility coefficients (derived from total N losses) to true digestibility coefficients. True digestibility represents the specific fate of dietary N in the digestive tract (Fuller & Tomé, 2005). Measurement of digestibility at the ileal level is now recognized as being more accurate than measurement of digestibility at the faecal level (Darragh & Hodgkinson, 2000; Moughan, 2003; Fuller & Tomé, 2005), especially for individual AA for which the profile can be modified by the prolific microbial metabolism in the hindgut. In addition, most dietary AA are absorbed in the small intestine (Krawielitzki et al., 1990; Fuller & Reeds, 1998). It remains unclear if the colon can absorb AA to a nutritionally significant extent (Blachier et al., 2007).After their intestinal absorption, dietary AA are involved in biosynthetic reactions including synthesis of protein or of other nitrogenous compounds or are subject to oxidative deamination. The balance between catabolic and anabolic pathways determines the overall dietary N retention, which can be modulated by dietary factors, especially dietary protein quality. It is thus important to improve our understanding of the dietary modulations of postprandial protein metabolism, which in turn influence net body N retention.
In this review, firstly, the concept of protein quality evaluation is discussed. The different sources of N flowing along the gastrointestinal tract are then examined, the methods available to distinguish endogenous N and dietary N in ileal digesta are discussed and the dietary factors influencing ileal endogenous N losses are addressed. Finally, the postprandial metabolic fate of dietary N and its modulation by dietary factors are explored.
I. Evaluation of dietary protein quality in adult humans
Evaluation of protein quality aims to assess the contribution of dietary protein in satisfying the metabolic requirement for N and AA (FAO/WHO/UNU, 2007). Both the estimation of protein requirements and aspects of quality evaluation still include unresolved issues, which are raised in this section.
1. Dietary protein and amino acid requirements
1.1. Concept of requirement
Protein requirement has historically been difficult to estimate, thus generating wide debate (Young et al., 1989; Fuller & Garlick, 1994; Millward, 2001; Reeds, 2001; Millward & Jackson, 2004). The word requirement, may, in itself, be confusing as it can refer to: (1) metabolic requirement, i.e. biological demand for the quantity of N and IAA consumed in various metabolic pathways; (2) dietary requirement (or estimated average requirement) for the minimum amount of dietary N and IAA that satisfies the biological demand for N and IAA at the individual level; (3) safe level of intake at the population level (recommended daily allowance or dietary allowance), which takes into account individual variations in requirement [dietary requirement + 2 standard deviations (SD) of
intake] and represents the upper range (97.5th centile) of distribution of the requirements (Reeds & Beckett, 1997; FAO/WHO/UNU, 2007). Metabolic requirement includes needs for maintenance of body protein equilibrium, which represent the largest part of the requirement in the adult human, and needs for growth (protein deposition), plus extra needs for reproduction or lactation. Whereas the growth requirement can be defined from the AA composition of newly deposited proteins and the efficiency with which bioavailable AA support protein deposition (Reeds & Garlick, 2003), the maintenance requirement is more complex to assess. The N balance approach, which is the historically used, but not completely satisfactory, method to determine protein requirement, is now complemented by isotopic techniques that provide new insights to the determination of IAA requirement.
The difficulty in determining protein and AA requirements lies in the numerous influencing factors arising from the individual’s biology (genotype, reproductive/development stage), his environment (e.g. injury, infection), his lifestyle (especially level of physical activity) and his nutrition (especially energy intake).
An unresolved and dividing issue is the adaptation mechanisms of body protein metabolism to low protein intake (Nicol & Phillips, 1976; Waterlow, 1990; Hegsted, 2000; Millward, 2003). Authors such as Millward (2003) and Millward & Jackson (2004) strongly argue that there is a long-term and slow adaptive behaviour of AA oxidation, such as illustrated by previous studies in which from 7 to 40 days are required to achieve N balance after variations in the protein intake level. Thus, the adaptation factor should be included in the definition of protein and AA requirements (Millward & Jackson, 2004). Conversely, authors such as Young & Borgonha (2000) and Rand et al. (2003) consider that metabolic adaptation is not an important issue, as studies have reported that an adaptation period of 4−5 days (usually used in N balance studies) is sufficient for the body to reach a relatively steady-state of N balance (Rand et al., 1976; Young & Borgonha, 2000). This is the current position of the international authorities (FAO/WHO/UNU, 2007). Additionally, there are scarce data regarding the influence of high-protein diets, which might modulate the body’s ability to recycle endogenous AA, thus modifying the pattern of AA required (Bos et al., 2002). All these factors contribute to the complexity of protein and AA requirement evaluation, as emphasized by the long time period (22 years) required to update the earlier international protein and AA requirements (FAO/WHO/UNU, 1985), which, in turn, were based on studies undertaken in the 1960s.
1.2. Dietary protein requirement
Although the N balance approach includes a number of shortcomings, especially a lack of precision and accuracy (Young et al., 1989), this approach is still the only valid method available for N requirement evaluation (FAO/WHO/UNU, 2007). The meta-analysis performed by Rand et al. (2003) on 19 N balance studies served for the current protein requirement estimate (FAO/WHO/UNU, 2007). Briefly, an N balance study consists in regressing the body N balance on intake to predict the protein intake (dietary requirement) that would produce a zero N balance. This is derived from the intercept (obligatory N losses, 48 mg/kg/d) and the slope (efficiency of dietary protein utilization, 0.47) of the linear regression obtained (Rand et al., 2003). The determination of the total obligatory N losses, determined after feeding the subjects with a low-protein diet for approximately 5−6 days, is critical. Whereas urinary and faecal losses can be directly measured, dermal and miscellaneous losses (saliva, hair, nails, breath, nasal mucous, semen) are usually estimated and might vary among studies. Rand et al. (2003) estimated that the dermal and miscellaneous losses were 4.8 and 11 mg N/kg/d for temperate and tropical regions, respectively. As a result, the current dietary protein requirement and allowance have been established at 0.66 and 0.83 g good-quality protein/kg/d, respectively, for healthy adult humans. These values are 10% higher than those determined earlier (FAO/WHO/UNU, 1985). It should be noted that these values are also valid for the elderly, as no consensus has yet been reached regarding the possible need for a higher intake (FAO/WHO/UNU, 2007), despite several reviews indicating the necessity to define higher safe protein intakes for elderly subjects (Campbell & Evans, 1996; Kurpad & Vaz, 2000). Children, as well as lactating or pregnant women, have a higher requirement on a body weight (BW) basis, but this is not discussed here.
The criterion on which the N requirement definition is based (achievement of N equilibrium or zero balance) has been questioned, as, although it is assumed to reflect health maintenance, it might not necessarily reflect the optimal conditions of specific physiological functions such as immune function, bone health or muscle mass (Millward, 1999; Wolfe, 2002; Millward, 2003; New & Millward, 2003). However, to date, there is no quantifiable indicator of the dietary N requirement for achieving such goals (FAO/WHO/UNU, 2007).
In summary, the current dietary protein requirement has to be considered within the limited context of the N balance approach and has thus been defined recently as “the
lowest level of dietary protein intake that will balance the losses of N from the body, and thus maintain the body protein mass, in persons at energy balance with modest levels of physical activity, plus, in children or in pregnant or lactating women, the needs associated with the deposition of tissues or the secretion of milk at rates consistent with good health” (FAO/WHO/UNU, 2007).
1.3. Indispensable amino acid requirements
There is an absolute metabolic need for every AA, with the difference that some can be synthesized by the body (dispensable AA), whereas others cannot (indispensable AA). The AA categorization is complex as some dispensable AA can become conditionally indispensable under specific pathological or physiological conditions (Table 1). Also, the rate of formation of dispensable AA in the body appears to be determined by the total intake of N. Thus, the requirement for IAA is not an absolute value, but should be expressed in relation to the total N intake (FAO/WHO/UNU, 2007).
Table 1. Amino acid classification. From Reeds et al. (2000b). Indispensable amino acids
(nutritionally indispensable under all conditions)
Histidine, Isoleucine, Leucine, Lysine, Methionine, Phenylalanine, Threonine, Tryptophan, Valine
Conditionally indispensable amino acids
(indispensable under specific pathological or physiological conditions) Cystine, Tyrosine, Taurine, Glycine, Arginine, Glutamine, Proline Dispensable amino acids
Aspartic acid, Asparagine, Glutamic acid, Alanine, Serine
Stable isotopic methods have enabled a dynamic approach to the estimation of IAA requirements. Two main approaches have been developed. Firstly, the “indicator AA balance”, or “carbon balance” method, consists of feeding a subject graded levels of the AA of interest (13C-labelled) over a 6-day adaptation period and determining dietary requirement of the AA of interest in terms of the intake allowing for a zero carbon balance (intake - oxidation) of this 13C-amino acid (Young et al., 1989). Secondly, the “indicator AA oxidation” consists in feeding a subject with graded levels of the AA tested without adaptation and determining the dietary requirement of this AA from the minimum level of oxidation (“breakpoint”) reached by an indicator AA, usually 13
C-phenylalanine or 13C-lysine (Brunton et al., 1998). Both methods present shortcomings, as reviewed elsewhere (Bos et al., 2002). To limit methodological shortcomings, the “24-h indicator AA oxidation” approac“24-h “24-has emerged (Kurpad et al., 1998), based on 13 C-leucine as the indicator AA. Subjects are adapted to increased levels of the AA tested for 6 days and its dietary requirement is determined from the zero leucine balance, determined over the entire day, rather than from the minimum leucine oxidation rate. Although the 1985 IAA requirement values, based on N balance studies, were clearly underestimated (Young et al., 1989; Fuller & Garlick, 1994; Millward et al., 2000a), isotope studies need to be considered with caution as they rely on many assumptions (FAO/WHO/UNU, 2007). The 24 h-indicator AA oxidation approach appears to give the most reliable values for most AA (FAO/WHO/UNU, 2007). The current recommended dietary IAA requirements, which are two or three times higher than the 1985 IAA requirement values, are reported in Table 2.
Table 2. Estimates of dietary amino acid requirements for adult humans.
FAO/WHO/UNU (1985)
FAO/WHO/UNU (2007)
Indispensable amino acids mg/kg/d
Threonine 7 15 Valine 10 26 Isoleucine 10 20 Leucine 14 39 Phenylalanine + tyrosine 14 25 Lysine 12 30 Histidine 8−12 10 Methionine + cysteine 13 15 Tryptophan 3.5 4
Total indispensable amino acids 93.5 184
2. In vivo protein quality index
A protein quality index has to be representative and needs to be determined routinely. Although protein efficiency ratio and net protein ratio were previously determined in young rats, these criteria have been criticized because of discrepancies between the human and the rat for their AA requirements, in particular for sulphur-containing AA (National Research Council, 1978) (Table 3), and their growth rates. In addition, these criteria were not additive between protein sources, making their use difficult for assessing
the quality of mixed protein sources. As a result, other approaches have been proposed.
Table 3. Amino acid scoring pattern across species.
Amino acid Adult human1 Laboratory rat2 Growing pig3
mg/g protein Threonine 23 41 34 Valine 39 49 36 Isoleucine 30 41 28 Leucine 59 71 50 Phenylalanine + tyrosine 38 68 48 Lysine 45 61 52 Methionine + cysteine 22 65 30 Tryptophan 6 13 10 1 (FAO/WHO/UNU, 2007). 2 (National Research Council, 1995). 3 (National Research Council, 1998).
2.1. Protein digestibility-corrected amino acid score
The PDCAAS, based on human IAA requirements, is recognized as the most suitable method for the routine determination of protein quality for humans (FAO/WHO, 1991; FAO/WHO/UNU, 2007). The PDCAAS takes into account protein digestibility and the AA score based on the following equation (Schaafsma, 2000):
pattern t requiremen in AA same the of mg protein test of g 1 in AA limiting first of mg ity x digestibil PDCAAS=
where digestiblity refers to true faecal N digestibility as assessed in the growing rat. There have been criticisms of this method (Darragh et al., 1998; Reeds et al., 2000b; Hegsted, 2000; Tomé et al., 2002; Bos et al., 2002; Millward, 2003; Schaafsma, 2005). An important concern relates to the digestibility factor. Firstly, the PDCAAS refers to overall protein digestibility, which might not reflect digestibility of individual AA (Hess
et al., 1998; Hess et al., 2000). Thus, it would be more appropriate to use individual AA
digestibilities for the PDCAAS (Darragh & Hodgkinson, 2000; Tomé et al., 2002). Secondly, ileal digestibility rather than faecal digestibility should be included in the PDCAAS (Darragh & Hodgkinson, 2000; Tomé et al., 2002) because it is known to be more representative of dietary protein digestibility (see Section I.3.1.1). Thirdly, estimation of digestibility in pigs rather than rats might be considered (Rowan et al., 1994; Darragh & Hodgkinson, 2000), as pigs might be a better model for humans than rats (see Section I.3.2.2). Alternatively, an in vitro ileal AA digestibility assay, based on a
computer-controlled gastrointestinal model, to replace the rat assay has been proposed (Schaafsma, 2005), but would need further experimental validation before being widely accepted.
Another controversial matter relates to the assumption on which the PDCAAS is based,
i.e. that the AA score determines the biological value. This implies that biological value
(proportion of digestible N that has been utilized in the body) is driven only by the AA profile of the dietary protein, an assumption that has been disputed (Hegsted, 2000; Millward, 2003).
Finally, because the PDCAAS was proposed as an index to evaluate the protein quality of diets and not of a specific dietary protein, it was first decided that PDCAAS values above 1 were of no special interest. However, because the PDCAAS is widely used to evaluate individual dietary protein sources, the truncation of high PDCAAS to 1 is now seen as a limitation. Indeed, the complementary values of high-quality proteins in mixed diets, such as meat, egg, and milk, are ignored (Schaafsma, 2005), which assumes that there is no need to consider protein quality beyond the point of sufficiency (Darragh & Moughan, 1998). As argued by the 2007 FAO/WHO/UNU expert consultation, the PDCAAS must be truncated for its practical use to adjust dietary protein requirement. However, a “protein source quality index” for individual proteins with a PDCAAS higher than 1 could be established (FAO/WHO/UNU, 2007).
Additionally, the PDCAAS does not take into account the potential adverse effect of antinutritional factors sometimes present in proteins, and thus probably overestimates the nutritional quality of such proteins, as shown by comparison with the protein efficiency ratio (Sarwar, 1997; Gilani et al., 2005). Conversely, the PDCAAS of proteins deficient in IAA have been reported to underestimate their nutritional value. Pea and wheat proteins amounted to 91 and 85% of the milk nutritional value based on their net postprandial utilization and to only 61 and 30% of the milk nutritional value based on their PDCAAS (Mariotti et al., 2001; Bos et al., 2005a). Also, other additional intrinsic values, such as the presence of conditionally indispensable AA, other AA included in alternative (non-nutritional) pathways or even bioactive peptides (Darragh et al., 1998), are not included in the PDCAAS.
In summary, although the PDCAAS method is a useful method for routine determination of protein quality, revisions are still required. In particular, it does not consider the subsequent metabolism of absorbed AA and thus seems unlikely to predict with accuracy the biological value of dietary protein (Gaudichon et al., 1999; Hegsted, 2000; Tomé &
Bos, 2000; Lacroix et al., 2006b; Bos et al., 2007; Humayun et al., 2007). Net postprandial protein utilization has been proposed as a better indicator of protein quality. This method has been fully developed and applied over recent years, as discussed below. Recently, Humayun et al. (2007) proposed an approach based on the “indicator AA oxidation” method as a potentially useful tool for the determination of the metabolic availability of AA in human foodstuffs. However, this method needs substantial refinement before being widely applied.
2.2. Net postprandial protein utilization
Net protein utilization can be directly determined using the classical N balance method; however, its major limitation is in the estimation of the net protein retention as a daily gain. Protein metabolism is subject to a diurnal cycle (fed and fasting states), resulting in alternate periods of postprandial accretion and postabsorptive losses of body proteins (Tomé & Bos, 2000). Acute N deposition during the postprandial phase is critical for the deposition of dietary N in tissues (Millward & Pacy, 1995; Tomé & Bos, 2000). Dietary N utilization directly for protein synthesis can be estimated when determined in the postprandial period, and is assumed to be a good indicator of the dietary protein nutritional value (Mariotti et al., 1999; Tomé & Bos, 2000). Net postprandial protein utilization was thus proposed as a more sensitive approach for assessing dietary protein quality (Gaudichon et al., 1999; Tomé & Bos, 2000; Reeds et al., 2000b). It can be assessed by measuring total dietary N losses usually for 8 h following ingestion of a test meal containing 15N-labelled dietary protein (Tomé & Bos, 2000) and using the following equation:
Net postprandial protein utilization = [15Nintake − ( N15 ileal + 15Nbody urea + 15Nurine)]/ N15 intake. When combined with true ileal digestibility, the net postprandial protein utilization allows for the measure of postprandial biological value, i.e. the proportion of absorbed N effectively used in the anabolic pathway (Mariotti et al., 1999).
Unlike the net protein utilization index, which requires long-term studies due to the adaptation period (Millward & Pacy, 1995), the net postprandial protein utilization can be determined acutely because postabsorptive losses, depending on the previous level of protein intake, are not taken into account. The net postprandial protein utilization has thus been suggested as a better criterion for protein quality evaluation (Gaudichon et al., 1999; Bos et al., 2002; Bos et al., 2005a). In particular, it penalizes protein sources deficient in
AA, such as wheat and pea, to a lesser extent than the PDCAAS as discussed above. Additionally, it allows for a better discrimination between proteins that have undergone technological processing like spray-drying: whereas the PDCAAS differed by only 2% between spray-dried milk and microfiltered milk, the net postprandial protein utilization was 10% lower for spray-dried milk than for microfiltered milk (Lacroix et al., 2006b). This suggests that the metabolic fate of dietary proteins must be taken into account when assessing nutritional quality.
3. Digestibility
Protein digestibility is a key component in dietary protein quality evaluation, as it indicates the extent to which dietary protein has been digested and absorbed as AA by the gastrointestinal tract, and thus provides a measure of bioavailability, i.e. the proportion of dietary AA that are absorbed in a chemical form that renders them potentially suitable for protein metabolism (Moughan, 2003; Fuller & Tomé, 2005; Stein et al., 2007). Protein digestibility is indirectly measured from the difference between intake and gut losses. The overall protein digestibility is determined from the measure of N digestibility. Additionally, digestibility of individual AA, not always equal to N digestibility, can be determined.
3.1. Terminology
3.1.1. Faecal versus ileal
Digestibility has been determined in the past at the faecal level; however, because of a prolific microbial N metabolism within the hindgut (Low, 1980) and because AA are absorbed mainly in the small intestine (Krawielitzki et al., 1990), this approach is usually recognized as being inaccurate in estimating the amount of absorbed dietary AA (Sauer & Ozimek, 1986; Darragh & Hodgkinson, 2000; Mosenthin, 2002; Moughan, 2003; Fuller & Tomé, 2005). Colonic (and caecal) microbial metabolism includes degradation of undigested AA or peptides and de novo synthesis of microbial AA, thus yielding a faecal AA profile that is quantitatively and qualitatively different from the pattern of undigested AA (Fuller & Tomé, 2005). Faecal digestibility coefficients are therefore likely to differ from ileal coefficients, especially for individual AA, and have been reported, in most cases, to be overestimated in pigs (Mosenthin, 2002; Moughan, 2003).
In humans, ileal digestibility and faecal digestibility have been compared in few controlled studies. N digestibility was reported to be slightly lower (1−3%) at the ileal level than at the faecal level (Rowan et al., 1994; Bos et al., 1999). Greater differences were observed for AA digestibilities, which were mostly lower at the ileal level than at the faecal level, with differences ranging from 2 to 17%. In summary, ileal AA and N digestibility values, especially when corrected for endogenous losses (see next section), appear to be more representative than faecal values of dietary AA/N absorbed from the intestine.
3.1.2. Apparent versus true
Apparent N digestibility is determined as the difference between the quantity of ingested N and the total N losses from the gut. A major disadvantage of apparent digestibility is the non-linear correlation between apparent N digestibility and dietary protein level, which results in non-additivity of apparent N digestibility in mixtures of protein sources (Stein et al., 2007). This is due to the relative contribution of gut endogenous N to total N losses (Fan et al., 1994). Endogenous N losses are composed of two components: basal or minimal losses that are inevitably lost by the body and that are independent of dietary factors, and specific losses that are influenced by dietary factors (Nyachoti et al., 1997a; Darragh & Hodgkinson, 2000; Stein et al., 2007). When apparent N digestibility is corrected for total (basal and specific) endogenous N losses, true digestibility, also occasionally referred to as real digestibility (de Lange et al., 1990; Mariotti et al., 2001), is determined. True digestibility reflects the specific fate of dietary N within the gut and corrects for any variation of the endogenous fraction related to dietary factors. It is thus a fundamental property of the protein source itself (Mosenthin, 2002) and allows the metabolic costs associated with synthesis and recycling of gut endogenous AA losses to be represented explicitly (Stein et al., 2007). Unlike apparent digestibility, true digestibility gives rise to a system in which the digestible N concentrations in food are additive (Fuller & Tomé, 2005). According to Stein et al. (2007), a distinction should be made between “standardized digestibility” and “true digestibility”, with standardized digestibility referring to apparent digestibility corrected for basal endogenous losses only (Fuller & Tomé, 2005; Stein et al., 2007).
However, in some cases, the distinction between true digestibility and standardized digestibility can be difficult to establish.
endogenous losses appears to be a better predictor of dietary AA bioavailability than faecal digestibility and/or apparent digestibility (Hodgkinson et al., 2003; Fuller & Tomé, 2005). In some cases, digestibility might not reflect accurately bioavailability. For instance, heat treatment of protein ingredients can result in chemical modification of AA, such as lysine, which is absorbed through the intestinal membrane but cannot be utilized for protein synthesis (Moughan & Rutherfurd, 1996). Also, the recycling of intestinal dietary N, possibly in microbial AA, might contribute to differences between digestibility and bioavailability (Fuller & Reeds, 1998; Fuller & Tomé, 2005; Metges et al., 2006).
3.2. Animal models
3.2.1. The growing rat
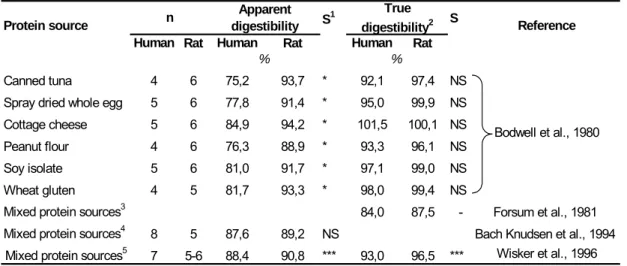
The growing rat has been recommended and generally accepted as a valid animal model for predicting protein digestibility in humans (FAO/WHO, 1991). Whereas the rat coefficients of apparent faecal digestibility overestimated by 14% (Bodwell et al., 1980) or were poorly correlated (r = 0.17) (Ritchey & Taper, 1981) with human coefficients, the values for true faecal digestibility were in better agreement between the species, with rat values being on average 3% higher (Table 4).
Table 4. Apparent and true faecal digestibility of nitrogen as estimated in adult humans and growing rats within controlled studies.
S1 S
Human Rat Human Rat Human Rat
Canned tuna 4 6 75,2 93,7 * 92,1 97,4 NS Spray dried whole egg 5 6 77,8 91,4 * 95,0 99,9 NS Cottage cheese 5 6 84,9 94,2 * 101,5 100,1 NS Peanut flour 4 6 76,3 88,9 * 93,3 96,1 NS Soy isolate 5 6 81,0 91,7 * 97,1 99,0 NS Wheat gluten 4 5 81,7 93,3 * 98,0 99,4 NS
Mixed protein sources3 84,0 87,5 - Forsum et al., 1981 Mixed protein sources4 8 5 87,6 89,2 NS Bach Knudsen et al., 1994
Mixed protein sources5 7 5-6 88,4 90,8 *** 93,0 96,5 *** Wisker et al., 1996
Protein source n Apparent digestibility True digestibility2 Reference % % Bodwell et al., 1980
1 Statistical significance: *, P < 0.05; ***, P < 0.001; NS, non significant. 2 Corrected for a constant estimate of faecal endogenous nitrogen losses.
3 Average digestibility over 2 mixed diets based on vegetable or vegetable/animal proteins.
4 Vegetable and animal proteins. Average digestibility over 4 diets with similar protein content but different fibre content. For each diet, there was no significant difference between species.
5 Vegetable and animal proteins. Average over 3 diets with similar protein content but different fibre content. For each diet, there was a significant difference (P < 0.05) between species.
To our knowledge, controlled studies comparing human and rat ileal digestibilities have not been undertaken. Data from independent studies suggest good agreement between the species for ileal AA digestibility coefficients (Fuller & Tomé, 2005), except for glycine digestibility, which was lower by 10% in rats fed casein or soya protein isolate (Fuller & Tomé, 2005), probably due to an underestimation of the endogenous glycine flow (Skilton et al., 1988; Moughan et al., 1992c; Hendriks et al., 2002; Rutherfurd & Moughan, 2003). However, recent data suggest that rats might be able to digest normally dietary proteins that are poorly digestible in humans, such as rapeseed protein, for which the true ileal digestibility was 84−87% in humans versus 95% in rats (Boutry et al., 2008; Bos et al., 2007).
The greater difference between rats and humans for apparent digestibility than for true digestibility may result from a higher contribution of endogenous N losses to total N losses in humans than in rats, although the AA compositions of their endogenous protein losses seem to be similar (Table 5).
The nutritional significance of rat data must be interpreted with caution when extrapolated to humans, due to nutritional, physiological and anatomical inter-species differences. A major discrepancy is the different AA requirements, as shown by the resulting AA scoring pattern (AA requirements expressed relative to the recommended protein intake, Table 3). The difference is dramatic for sulphur-containing AA, for which the rat AA score is more than twice the human AA score. In addition, adult humans have a higher maintenance requirement than growing rats (Ritchey & Taper, 1981). Nevertheless, Mitchell (1954), who compared biological values of proteins, reported a better correlation between the growing rat and adult man (r = 0.92) than between the adult rat and adult man (r = 0.67). There are also differences in digestive tract anatomies, especially with respect to the large caecum size relative to the overall size of the rat digestive tract (Ritchey & Taper, 1981). Furthermore, coprophagy occurring in rats might impair protein quality assessment if not prevented. Small gut mucosa protein synthesis appears to be higher in rats than in humans. The average fractional protein synthesis rate (g protein synthesized/100 g protein in the tissues) was 143% per day for rats and ranged from 22 to 50% in humans, as reviewed by Waterlow (2006a). This suggests a higher mucosal protein renewal, possibly leading to a higher degree of dietary N recycling within endogenous mucosal protein. However, when taking into consideration potential differences between the rat and the human, the rat is still a useful model for fundamental and theoretical research (Bergen, 2007).
Table 5. Ileal endogenous nitrogen flow and its amino acid composition (mean ± SD) as determined in the rat, pig and human fed a protein-free diet.
Rat1 Pig2 Human3
Number of studies 6 9 3
Nitrogen flow, µg/g dry matter intake 1346 ± 436 1678 ± 188 1952 ± 172
Number of studies 3 9 3
Amino acid composition
g/16gendogenous N Threonine 5.9 ± 1.2 5.0 ± 0.9 6.1 ± 0.6 Valine 3.8 ± 0.3 3.9 ± 1.2 4.6 ± 0.2 Isoleucine 2.4 ± 0.1 2.9 ± 0.7 2.6 ± 0.3 Leucine 4.1 ± 0.4 4.4 ± 0.6 5.0 ± 0.5 Phenylalanine 2.7 ± 0.4 2.5 ± 0.4 3.0 ± 0.5 Tyrosine 2.5 ± 0.2 2.6 ± 1.1 2.9 ± 0.4 Lysine 3.1 ± 0.5 3.3 ± 1.0 4.8 ± 1.7 Histidine 2.2 ± 0.2 1.5 ± 0.2 2.7 ± 0.5 Serine 7.3 ± 3.2 4.5 ± 0.7 4.7 ± 0.5 Glutamic acid 13.5 ± 5.5 7.6 ± 1.8 4.5 ± 1.2 Alanine 3.4 ± 0.2 4.6 ± 1.4 3.4 ± 0.3 Proline 7.5 ± 0.3 14.4 ± 6.4 5.4 ± 1.0 Arginine 3.6 ± 0.2 3.6 ± 0.6 4.2 ± 1.5 Aspartic acid 10.4 ± 1.1 6.5 ± 0.9 7.1 ± 0.6 Glycine 8.7 ± 2.5 8.4 ± 2.3 7.6 Methionine - 1.1 ± 0.8 0.8 ± 0.2 Cysteine 0.8 1.2 ± 0.6 2.6 ± 1.2 Tryptophan - 0.9 ± 0.5 1.8
1 Nitrogen flow (Butts et al., 1992a, 1992b; Moughan et al., 1992b; Donkoh et al., 1995; Hendriks et al., 2002; James et al., 2002a). Amino acid composition (Butts et al., 1992a, 1992b; Donkoh et al., 1995). 2 (Chung & Baker, 1992; Butts et al., 1993a; Mariscal-Landin et al., 1995; Leterme et al., 1996a; Leterme
et al., 1996b; Hess et al., 1998; Hess et al., 2000; Hodgkinson et al., 2000; Zhang et al., 2002).
3 (Fuller et al., 1994; Rowan et al., 1994; Moughan et al., 2005). The values determined in Fuller et al. (1994) and Rowan et al. (1994) were calculated for an average daily dry matter intake of 410 g determined according to the data from Department for Environment (2003) and Marriott (2003).
3.2.2. The growing pig
With a physiology and a metabolism that are closer to those of the human, the growing pig has been extensively used for studying human protein metabolism (Bergen, 2007) and has been proposed as a better model for protein digestion studies (Moughan et al., 1992a; Moughan et al., 1994; Darragh & Hodgkinson, 2000; Moughan, 2005). Also, the pig offers the advantage of allowing continuous in vivo ileal collection after surgical preparations, unlike the rat, from which digesta are collected after euthanasia at a certain time post meal (Moughan et al., 1994).
At the faecal level, Darragh & Moughan (1995) reported good agreement for apparent N and AA digestibility between piglets and infants fed milk formula, with N digestibility values of 97.5 and 94.5%, respectively. A similar observation was made by Forsum et al. (1981). To our knowledge, few studies have compared the true ileal digestibility of protein between pigs and humans. Rowan et al. (1994) reported true digestibility coefficients that were similar between ileostomized subjects and ileostomized pigs, except for threonine, phenylalanine, methionine and cysteine which were significantly higher (3−8% units) in humans. This is in line with data across independent studies (although not direct evidence), showing good agreement between pig and human true ileal N and AA digestibility values (for soya protein or casein), as reviewed previously (Fuller & Tomé, 2005). As reported for the growing rat, AA compositions of endogenous ileal protein losses were similar between the growing pig and the adult human (Table 5), except for proline for which the contribution was three times higher in pigs.
Although the pig is also a fast-growing animal, the AA scoring pattern is closer between the growing pig and the adult human than between the growing rat and the adult human (Table 3). Gut fractional protein synthesis rates were reported to be in the same range, with pig values of 43 to 51% per day (Simon et al., 1978; Simon et al., 1982) and human values of 22 to 50% per day (Waterlow, 2006a).
Overall, direct evidence to support the growing pig as an animal model for predicting ileal protein digestibility in humans is scarce.
II. Nitrogen flows along the digestive tract
After a protein meal, N of dietary origin mixes with N present in the intestinal lumen, considered to be endogenous N as opposed to dietary N. Considerable exchange of N occurs between the intestinal lumen and the systemic pools, mainly in terms of proteins, AA and urea. Unlike dietary N, endogenous N exhibits a rather complicated pattern along the intestinal lumen as it enters at various stages, thus making it difficult to assess the contribution of each endogenous N source (Fuller & Reeds, 1998).
1. Endogenous nitrogen flows
1.1. Oral cavity
N in the mouth originates mainly from saliva, which contains digestive enzymes (α-amylase), glycoproteins (mucins), free AA, urea, uric acid and creatinine (Buraczewski, 1986). Various amounts of N secreted within saliva have been reported, with values ranging from 0.2 up to 2 g N/d(Juste, 1982; Alpers, 1987; Brunser et al., 1991; Sève & Leterme, 1997). Compared with the total gut N secretion, the saliva N is relatively small (Table 6).
Table 6. Daily contributions of endogenous nitrogen secretions to total endogenous nitrogen entering the lumen of the digestive tract in growing pigs. Quoted in Sève & Leterme (1997); data from Leterme (1995).
Sources g/day % of total
Saliva 0.2 – 0.6 1 – 2.2 Gastric juice 2 – 3.3 10.5 – 12.3 Bile 1.7 – 1.9 8.9 – 7.1 Pancreas 1 – 4.6 5.2 – 17.2 Urea 6.4 33.5 – 23.9 Mucus 2 10.5 – 7.5 Epithelial enzymes + sloughed cells 5.8 – 8 30.4 – 29.8 Total 19.1 – 26.8 100 – 100
1.2. Stomach
N in gastric juice originates from digestive enzymes (pepsins), mucins, desquamated cells and, to a lesser extent, urea and ammonia (Juste, 1982; Buraczewski, 1986). Gastric juice has usually been studied together with saliva collected from pigs equipped with duodenal cannulae. The minimal quantity of endogenous N produced by saliva and gastric secretions was estimated to be 0.3−0.6 g/d in 35-kg pigs (Zebrowska et al., 1983). Secretions were increased to 3.1 g N/d when 40-kg pigs received 1.7 kg/d of barley−fishmeal or barley−soya diet (Low, 1985).
1.3. Bile
Bile is secreted by the polygonal cells in the liver and is stored in the gall bladder, where the bile is concentrated by absorption of water and electrolytes (Na+, Cl− and HCO3−). Bile, flowing into the duodenum through the sphincter of Oddi (Sanford, 1982), acts as a powerful emulsifying agent that helps in the digestion and absorption of fat. Neural (sympathetic and parasympathetic) and hormonal [cholecystokinin (CCK)] systems regulate the contraction of the gall bladder and thus the flow of bile into the small intestine (Sanford, 1982). Organic compounds of bile are mainly bile acids, phospholipids, cholesterol, bilirubin and mucus (Davenport, 1982). Of the N in bile, 75% comes from α-amino N (95% of this originates from glycine in conjugated bile acids) and 25% comes from ammonium sulphate. Approximately one-quarter of the bile acids escape absorption in the small intestine (Davenport, 1982). The secretion of bile was reported to be 1.7−1.9 g N/d in pigs (Table 6). The amount of endogenous N from saliva, gastric juice and bile, as collected from a duodenal cannula, was reported to be 5.1−5.3 g/d in 30−35-kg pigs (Zebrowska et al., 1982; Krawielitzki et al., 1990), which is in line with the values reported in Table 6.
1.4. Pancreas
The pancreas, a gland located between the stomach and the duodenum, produces both endocrine and exocrine secretions, with the exocrine part representing, by weight, the most important part (84%) of the pancreas (Low & Zebrowska, 1989). Exocrine secretions, released into the duodenum via the sphincter of Oddi, are composed of digestive enzymes (trypsin, chymotrypsin, elastase, carboxypeptidase, amylase, lipase, phospholipase and ribonuclease), secreted as inactive precursors, and of an alkaline fluid