Estimation of apparent ileal digestibility of amino acids in ingredients
used in broiler diets and basal endogenous losses through
meta-analysis approach
Mémoire
Héctor Hernando Salgado Romero
Maîtrise en sciences animales
Maître ès sciences (M. Sc.)
Québec, Canada
Estimation of apparent ileal digestibility of amino acids in ingredients
used in broiler diets and basal endogenous losses through
meta-analysis approach
Mémoire
Héctor Hernando Salgado Romero
Sous la direction de:
iii
Résumé
Si l’objectif est d’optimiser l’utilisation des protéines par les volailles, l'utilisation d’un système d’acides aminés digestibles est probablement supérieure à la quantité totale d’acide aminé (tAA) présente dans le régime. Avec la quantité considérable d’informations présentes sur les valeurs nutritives d’acides aminés (AA) utilisées dans les régimes alimentaires de volailles, l’objectif de cette étude est de prédire la digestibilité d’AA basée sur une analyse proximale via une méta-analyse. Deux modèles ont été testés : 1) Y = digestibilité apparente des AA (AAdig, % diet) ; X = protéine brute (CP) (%) et 2) Y = AAdig (g/kg de DM) ; X = AA totaux analysés (tAA, g/kg de DM) dans lequel l’ordonnée à l’origine du graphique est la perte d’endogène (EL). Une base de données de 49 publications a été divisée en 5 sous-sections 1) céréales (orge, sorgho, blé et maïs), 2) tourteau de soja (SBM), 3) farines de viande et d’os (MBM) 4) La sous-section 1) ainsi que des fèves de faba et de pois pour étudier EL et 5) seulement des fèves de faba et des pois. L’étude et les ingrédients ont été inclus dans le modèle comme effets fixes. Pour les céréales, la prédiction des AAdig par CP est précise (R2 de 0.68 pour Thr et de 0.92 pour Ala). La pente est différente selon le type de céréales (céréale x CP ; P < 0.05) pour la majorité des AA sauf pour le maïs qui n’a pas eu de relation significative avec CP (P > 0.05). Dans le SBM et MBM, l’effet étude améliore la précision des modèles. Des ordonnées à l’origine négatives, et significativement différent de 0 (P<0.002), sont obtenus systématiquement avec les fèves de faba, les pois ainsi que l’orge. Ces derniers ont une haute EL probablement due à son contenu élevé en fibres ainsi qu’en facteurs antinutritionnels. Parmi les AA, les ordonnées à l’origine étaient plus élevées pour Glu, Leu, Ser, Thr, qui sont prédominants dans les digesta iléaux. En conclusion, la CP peut être un indicateur pour les AA digestibles dans la plupart des AA présents dans les céréales, mais pas pour les SBM et MBM. La perte endogène basale semble être influencée par les fibres brutes ainsi que les facteurs antinutritionnels.
iv
Abstract
The use of digestible amino acid system is certainly superior to total amino acids (tAA) in feed formulation, if the objective is optimizing protein use by birds. With considerable information reporting AA digestible values of ingredients used in broiler diets, the objective of this study was to predict amino acid (AA) digestibility based on proximal analysis of ingredient using a meta-analysis approach. Two models were performed: 1) Y = apparent digestible AA (AAdig, % diet); X = dietary CP (%) and 2) Y = AAdig (g/kg of DM); X = total analyzed AA (tAA, g/kg of DM) in which the intercept is the endogenous losses (EL). A database of 49 publications was divided in 5 sub-databases: 1) cereals (barley, sorghum, wheat and corn), 2) soybean meal (SBM), 3) meat and bone meal (MBM), 4) database 1 plus faba beans and peas to study El and 5) only peas and faba beans. The study and ingredient were included as fixed effects. In cereals, prediction of AAdig by CP was accurate (R2 from 0.68 for Thr to 0.92 for Ala). The slope was different between cereals (cereal x CP; P < 0.05) for most AA, where corn did not respond to CP (P > 0.05). In SBM and MBM, the study effect improved the precision of the models. More negative intercepts, and significantly different from 0 (P<0.002), were systematically obtained for faba beans, peas and barley indicating higher EL probably due to its high content of fiber and anti-nutritional factors. Among AA, intercepts were higher for Glu, Leu, Ser and Thr, which are predominant in the ileal digesta. In conclusion, CP can be a predictor of digestible AA of most AA for cereals, but not for SBM and MBM. Basal EL seems to be influenced by crude fiber and anti-nutritional factors.
v
Table of contents
Résumé ... iii
Abstract ... iv
Table of contents ... v
List of tables ... vii
List of figures ... viii
List of abbreviations ... ix
Acknowledgements ... xi
Preface ... xii
Introduction ... 1
1 Chapter 1 Literature review ... 3
1.1 Amino acids in broiler diets ... 4 1.2 Fate of dietary amino acids ... 5 1.2.1 Role ... 5 1.2.2 Digestive fate of amino acid ... 6 1.2.3 Metabolic fate of amino acid ... 8 1.2.4 Estimation of amino acids value of feedstuffs used in broiler diet ... 10 1.2.5 Factors modulating amino acid digestibility in broilers ... 18 1.3 Analysis of data from different studies: Meta-analysis ... 23 1.3.1 Basic concepts of simple and multiple regression analysis ... 23 1.3.2 Definition and applications of meta-analysis in animal nutrition ... 27 1.3.3 Steps followed in the current meta-analysis process ... 28 1.4 Hypothesis and objectives of this research ... 32
vi
References ... 33
2 Chapter 2 Estimation of apparent ileal digestibility of amino acids in ingredient used in broiler diets and basal endogenous losses through meta-analysis approach ... 40
Abstract ... 41 2.1 Introduction ... 42 2.2 Materials and methods ... 43 2.3 Results ... 46 2.4 Discussion ... 58 2.5 Conclusion ... 65 References ... 66
vii
List of tables
Table 1-1 Nutritional classification of amino acids in broilers. ... 5 Table 2-1 Descriptive statistics of the ingredients used in the models. ... 48 Table 2-2 Estimation of digestible apparent ileal content (g/100 g as feed basis) from CP content (%
as feed basis) in cereals database1. ... 50 Table 2-3 Estimation of AID content (g/100g) from CP (%) in SBM and MBM databases1. ... 51 Table 2-4 Table 1. Estimation of AID content (g/100g) from CP (%) in faba beans and peas
databases1 ... 52 Table 2-5 Estimation of digestible apparent ileal content (g/kg of DM) from total amino acid content
(tAA; g/kg of DM) in cereals database1. ... 54 Table 2-6 Estimation of digestible apparent ileal content (g/kg of DM) from total amino acid content
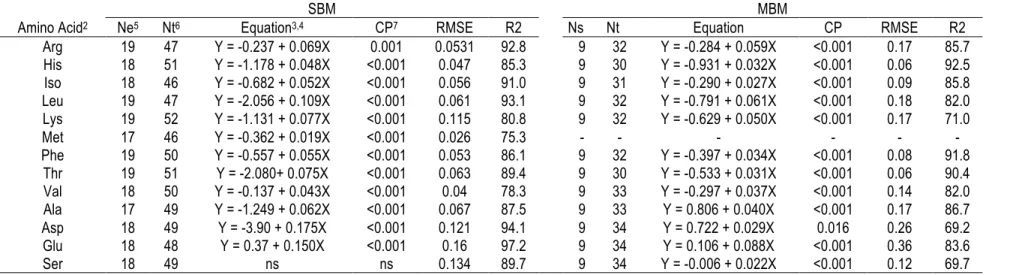
(tAA; g/kg of DM) in SBM and MBM databases1. ... 56 Table 2-7 Estimation of digestible apparent ileal content (g/kg of DM) from total amino acid content
viii
List of figures
Figure 1-1 Digestion and absorption of proteins and amino acids ... 7 Figure 1-2 . Overview of pathways in amino acid metabolism in animals (taken from D’Mello, 2003) . 9 Figure 1-4 Influenced of dietary AA content on the partitioning of AA in ileal digesta from pigs (taken
from Stein et al., 2007) ... 12 Figure 1-3 Influence of the dietary AA content on the measured values of apparent, standardized
and true ileal AA digestibility (taken from Stein et al., 2007). ... 13 Figure 1-5 Schematic representation of regression approach to study inevitable ileal endogenous
flow and standardized ileal digestibility by regression (Taken from Akinde, 2016). ... 17 Figure 1-6 Hypothetical effects of dietary fiber on the balance between mucus erosion releasing
mucin into the gut lumen and synthesis and secretion of mucin from the goblet cells. SCFA _ short-chain fatty acids (taken from Montagne et al., 2004). ... 21 Figure 1-7 Schematic representation of a meta-analytic process (adapted from Sauvant et al., 2008)
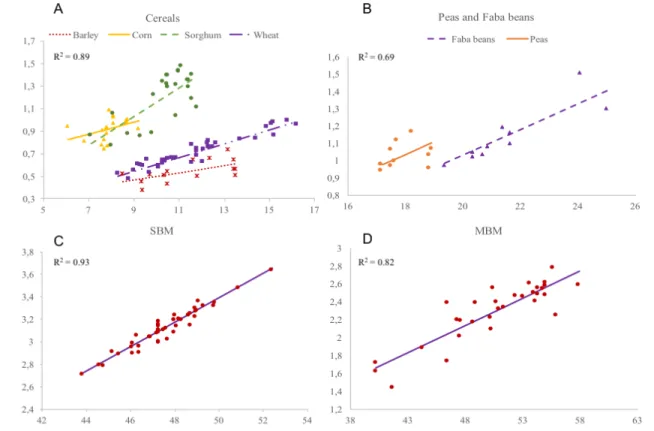
... 29 Figure 2-1. Relationship between apparent digestible content of leucine (g/100g as feed basis) and
CP content (%) for cereals (A), peas and faba beans (B), SBM (C) and MBM (D). Digestible content values were adjusted for study effect in SBM and MBM. ... 49 Figure 2-2 Relationship between apparent digestible content of leucine (g /kg of DM) and total
leucine content (g/kg of DM) for cereals database. ... 55 Figure 2-3 Contribution of amino acids in the endogenous losses (g/kg DM) estimated with the
intercept by regressing the apparent digestible content of AA with total amino acid content in the different cereals evaluated. ... 55 Figure 2-4 Relationship between AID coefficient (%) of lysine and CP (%) content in the ingredients
for cereals database. ... 59 Figure 2-5 Comparison of the Relationship between digestible content of lysine (g/100g as feed
basis) adjusted by study effect (A and C), not adjusted (B and D) and CP content (% as feed basis) in SBM and MBM. ... 61
ix
List of abbreviations
Ala Alanine
AA Amino acid
ANFS Anti-nutritional factors AID Apparent ileal digestibility
Arg Arginine
Asp Aspartate
BBI Bowman-Birk trypsin inhibitor
BCAA Branched-chain of amino acids
BCKA Branched-chain of keto acids
Cr2O3 Chromium oxide
CV Coefficient of variation
CP Crude protein
AAdig Digestible amino acid
DM Dry mater
DMI Dry mater intake
EL Endogenous losses
EHC Enzymatically hydrolyzed casein
SE Error of determination
EAA Essential amino acids
GIT Gastrointestinal tract
Glu Glutamine
Gly Glycine
His Histidine
HCl Hydrochloric acid
IAAend Ileal endogenous amino acid losses
Iso Isoleucine
Leu Leucine
Lys Lysine
MBM Meat and bone meal
Met Methionine
N Nitrogen
N Nitrogen
Phe Phenylalanine
PFD Protein free diet
MSE Residual mean square
RMSE Root mean square error
Ser Serine
STI Soya trypsin inhibitor
SBM Soybean meal
SID Standardized ileal digestibility
SS Sum of squares
x
TiO2 Titanium dioxide
Taa Total amino acid
TIs Trypsin inhibitors
Val Valine
xi
Acknowledgements
I would like to thank my advisor, Dr. Marie-Peirre Letourneau. Thank you for giving me an opportunity to start my graduate studies, your dedication and hard work will be always an inspiration for me. I also would like to thank Dr. Stein and Gloria Casas because you were the beginning of this dream. Thanks to the département des sciences animales at Laval University.
To all those people who are especial on my life: Lucie Galiot, Jimmy R., Maroua Zouaoui, Pauline Herst. Thank you for all your support and aide over all this time.
A mi familia quienes fueron una gran motivación y soporte en este proceso, a mi mamá quien siempre ha sido mi ejemplo y a mi papá por su arduo trabajo. De igual manera quiero dedicar este trabajo a mis hermanos quienes me han apoyado siempre.
A mis más cercanos amigos quienes han hecho de este proceso una de las mejores experiencias: Caroline Gonzales, Jasson Piña, Daniel Rico, Sara Peña, Jair Parales, muchas gracias por sus consejos y los buenos momentos compartidos.
xii
Preface
This work includes a project of scientific article, and consists in two chapters. The first chapter correspond to the literature review, which presents basic concepts related to protein and amino acid digestion and metabolism, technics of measuring digestibility of amino acids in ingredients used in broiler diets, and a short description of a meta-analysis approach.
The second chapter is a project of scientific article not yet submitted. This paper was done using a meta-analysis tool to predict amino acid digestibility based in chemical composition of feedstuffs used in broiler nutrition, a second objective of this paper was to study endogenous losses and their modulating factors. This work was done under supervision of Marie-Pierre Letourneau-Montminy and in collaboration with Frederic Guay, researcher professors at the University Laval.
1
Introduction
Modern broilers are reaching market age sooner each year to cope with market demand for protein (Beski, et al., 2015). Advances in nutrition will be fundamental to ensure this rapid growth achievement without compromising sustainable broiler production (Beski et al., 2015).Crude protein (CP) is the critical constituent of poultry diets, so, the main emphasis in broiler diets formulation is on crude protein (CP) and amino acids (AA). Proteins are essential components of cell walls and they have an important role in biologic process, they are built by chain of AA that are linked by peptide bound. Therefore, the hydrolysis of proteins results in free AA. Plant and animal proteins are the most important sources of protein and dietary AA in poultry diets. However, animal protein and synthetic AA are used as complementary source of protein or AA due to the lower content of some essential AA in vegetal proteins (Beski et al., 2015).
Soybean meal (SBM) is the most common ingredient used in poultry diets as source of protein because of its high content of protein and good profile of AA compared with other oilseed meals (Ravindran, 2013). Although, cereals are source of energy, their high inclusion in the diets results in a considerable contribution of dietary total AA and protein. The content and availability of protein and AA vary between ingredients, so an important aspect in feed industry is the knowledge of the availability of AA in feedstuffs. Many approaches have been used to estimate amino acid availability. However, amino acid digestibility is the most suitable method for estimating amino acid bioavailability because the values apply directly to the bird and because more than one amino acid can be measured in one assay (Stein et al., 2007 25; Bryden et al., 2009).
Amino acid digestibility is more often reported in poultry as apparent digestibility, (ileal or excreta) than standardized digestibility. The term apparent is used because in the estimation of digestibility it is assumed that all the amino acids found in the ileal content or excreta are from dietary origin. However, some of these AA are from endogenous origin and they decrease the real digestibility values of dietary AA. Endogenous AA are known as endogenous AA losses which are divided in basal that are not affected by the composition of the diet, and specific that depend of the nature of the diet (Stein et al., 2007). Standardized AA values are corrected for basal endogenous losses, which allow having values closer to the real digestibility of dietary AA. However, in poultry, there are a
2
large inconsistences and variability in the results of basal endogenous losses and, for a reliable standardized AA digestibility values, the consistent and repeatable results of the basal endogenous losses is needed (Adedokun et al., 2011).
The application of digestible values in diet formulation provide the advantage of increasing the inclusion level of alternative ingredients, particularly, low quality protein sources in poultry diets by improving the precision of the formulation and ensuring more predictable bird performance (Bryden et al., 2009). The benefit of diets formulated using digestible values have been demonstrated (Rostagno et al., 1995; Fernandez and Parsons, 1996; Douglas and Parsons, 1999). There is a considerable amount of data reporting digestible coefficient of AA in different feedstuffs. However, these values are variable due to differences in the conditions of the studies such as: age of the animals, protocols and laboratory procedures, etc. Therefore, the objective of this study is to predict from proximal composition the apparent ileal digestibility of AA of the main feedstuff in broiler fed diets and identify factors that affect endogenous AA losses using a meta-analysis approach, a tool that allows taking into account the effect of the experiment (Sauvant et al., 2008).
3
4
1.1 Amino acids in broiler diets
Plant and animal proteins are the most important sources of protein and AA, with the majority of the protein dietary requirement supply by plant protein sources and a lower part by animal protein sources (Beski et al., 2015). In this group, soybean meal (SBM) is the most common protein source used in poultry diets due to its high content of CP, which vary between 40 to 48% depending on the quantity of hulls removed and the oil extraction process (Beski et al., 2015). Moreover, although other sources of plant protein such as oilseed grains or oilseed meals (canola) can be used as alternative sources of protein, SBM is favored because of its interesting price and its well-balanced AA profile, especially in the essential AA (Ravindran, 2013). Plant protein sources are generally deficient in some AA, which is corrected using supplemental AA as synthetic AA or other protein sources as animal protein. Inclusion of some plant sources may be also limited by their content in anti-nutritional factors (ANFs). It has to be noticed that most of ANFs can be destroyed by thermal processing (Adeyemo and Longe, 2007).
Animal protein sources, such as bone meal, meat meal, meat and bone meal (MBM), poultry meal, hydrolyzed feather meal and blood meal, are well balanced in terms of essential AA (EAA), but they are expensive and therefore mostly used as supplement of AA in the diet rather than as the main source of AA (Beski et al., 2015). These sources of protein are however ban in some countries such as European Union. The secondary source of protein is cereal, mainly corn, wheat and barley that are firstly used as a source of energy in the diets, but their high inclusion results in a considerable contribution in the total protein and AA contents in the diet. As an example, in classical broiler diet, 20% of lysine (Lys) is supply by cereals (wheat and corn), 65% by SBM and 15% by synthetic AA or MBM.
5
1.2 Fate of dietary amino acids
1.2.1 Role
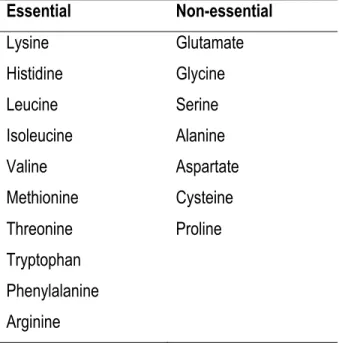
Proteins are constituents of all cells and are required to sustain life because of important role in biological process as regulators of metabolism (hormones and enzymes), structural components of membranes, muscle and connective tissues, transport molecules, osmoregulators, and immune factors. Proteins are built by chains of AA that are linked by peptide bonds; AA are therefore the products of protein hydrolysis. In poultry, Met has been reported as the first limiting AA and Lys as the second for growing and egg production in corn-SBM based diets (Ravindran and Bryden, 1999). AA can be divided in two group’s essential and non-essential AA (Table 1-1); the first group must be provided in the diets due to the inability of animals to synthetize them. The second group of AA receives the name of non-essential because animals are able to synthetize them from other AA and carbon chain, and they generally do not need to be add in the diets. All mammals require the core of nine essential AA, however in cats, poultry and fish arginine may be provided in the diet as an essential AA (D’Mello and D'Mello, 2003).
Table 1-1 Nutritional classification of amino acids in broilers.
Essential Non-essential Lysine Glutamate Histidine Glycine Leucine Serine Isoleucine Alanine Valine Aspartate Methionine Cysteine Threonine Proline Tryptophan Phenylalanine Arginine
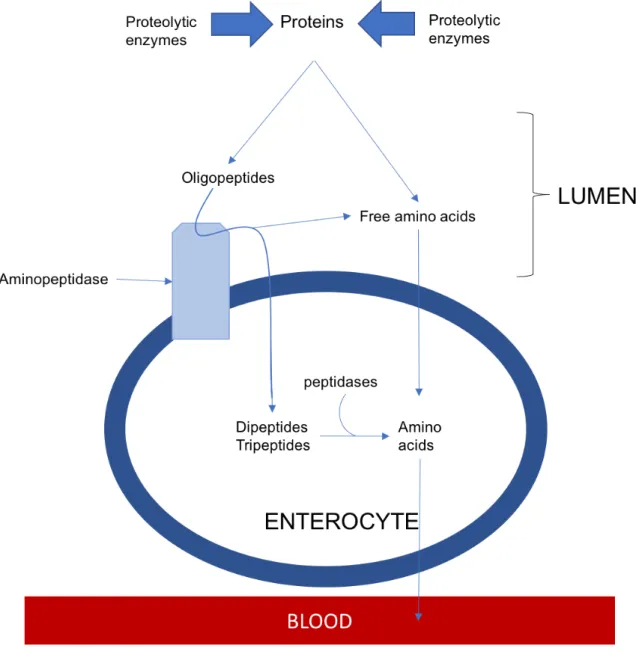
6 1.2.2 Digestive fate of amino acid
Digestion of proteins occurs in three important steps: 1. gastric degradation of proteins, 2. digestion in the small intestinal lumen, and 3. Protein hydrolysis at mucosal level and absorption (Figure1-1). In broilers, gastric digestion is initiated in the proventriculum in the presence of Hydrochloride acid (HCl) and pepsin. Hydrochloride acid is used to convert pepsinogens into pepsins because they are secreted as inactive precursors (Krehbiel and Matthews, 2003). Although, the production of HCl is high in the proventriculus, there is little digestion because of the little storage capacity and the rapid digesta transit (Krehbiel and Matthews, 2003). To digest exogenous proteins without destroying constituent protein in the stomach and pancreas, the inactive precursors, known as zymogens or proenzymes, are synthetized and secreted. Pepsin is activated at pH > 5.0 and increase the susceptibility of proteins to be attack by pancreatic proteases exposing AA residues to the pancreatic endopeptidases. The objective of stomach proteolysis is to make peptide molecules susceptible to further hydrolysis by proteolytic enzymes in the small intestine.
In the duodenum, proteins and polypeptides are initially broken down by pancreatic exopeptidases such as trypsin, chymotrypsin, elastase, and endopeptidases as carboxypeptidases A and B. Trypsin is secreted as inactive trypsinogen, which is activated by enteropeptidase (Krehbiel and Matthews, 2003). The activity of enteropeptidase may be regulated by pancreatic secretion and possibly by dietary protein content (Kwong et al., 1978). The function of trypsin, chymotrypsin, and elastase is to breakdown proteins and peptides into smaller peptides and AA in the duodenum. Each pancreatic protease is catalytic specific; trypsin catalyzes the breakdown of bonds between Lys and/or Arg, and aromatic AA residues are susceptible to chymotrypsin hydrolysis (Alpers, 1987). The products of exopeptidases are numerous terminal peptide bonds, which are digested by aminopeptidases, carboxypeptidases, and other specific peptidases present in the lumen or mucosa of the small intestine. According with Alpers (1987), the products of pancreatic digestion are oligopeptides of up to six AA residues (approximately 60%) and free AA (approximately 40%).
The last stage of non-fermentative protein digestion is known as the mucosal phase of digestion in which small peptides enter the enterocytes mainly via active carrier-mediated process and some passive. Previous hydrolysis is carried out by the action of peptidases present in desquamated
7
mucosal cell but most of the oligopeptide breakdown occurs into enterocytes. Indeed, peptides absorbed into enterocytes are hydrolyzed into free AA by intracellular peptidases located in the cytoplasm of the intestinal mucosa. Finally, free AA go to the liver via portal blood (Yadalam, 2005).
8 1.2.3 Metabolic fate of amino acid
Free AA resulted from the hydrolysis of the dietary protein and also from endogenous proteins mostly transported to hepatocytes via the portal blood. Then, the liver controls the distribution of AA across the body (Yadalam, 2005). Those free AA are submitted to catabolism in almost all the tissues, but this process is more important in the intestinal mucosa, liver, brain and kidney. The catabolic process of AA consists in the removal of the amino group, resulting in α-keto acid that is used for oxidation to CO2.
Amino acid and protein metabolism refers to the totality of reactions involving their biosynthesis and the use within anabolic and catabolic pathways. Because AA cannot be stored as free molecules, they must follow anabolic routes to peptides, proteins, hormones and other bioactive molecules, or catabolic routes to uric acid (Figure 1-2) in the case of birds (D’Mello and D'Mello, 2003). There are in general three pathways for using or salvaging ammonia in key assimilation reactions involving glutamate dehydrogenase, glutamine synthesis, and carbamoyl phosphate synthetase in the case of mammals.
9
Amino acids
Synthesis
Tissue proteins Hormones Neurotransmitters Other bioactive molecules
Degradation
Amino group Carbon skeleton
Uric acid/
urea Gluconeogenesis/ ketogenesis Figure 1-2 . Overview of pathways in amino acid metabolism in animals (taken from D’Mello, 2003)
10
The action of the glutamate dehydrogenase for the synthesis of glutamate, results in an amino group which is transferred to the α-keto acids by action of the aminotransferases or transaminases to form a number of important non-essential AA. The transamination results in a production of ammonia, and the primary site for reactions of this type is the liver (D’Mello and D'Mello, 2003). The ammonia must be reutilized or converted in uric acid or urea in the liver because of its toxicity before excretion by kidneys. In the case of the transamination of branched-chain of AA (BCAA), leucine, isoleucine and valine, the skeletal muscle is the major site of transamination (Harper et al., 1984). There, transaminases accept these three AA as substrates, yielding their respective branched-chain keto acids (BCKA), which are transported to the liver for metabolism. The amino groups are used for the synthesis of glutamate. Ammonia can also be assimilated being catalyzed by glutamine synthetase (D’Mello and D'Mello, 2003).
The excretion of waste Nitrogen (N) in avian species is the uric acid pathway. Uric acid is a purine, and their immediate precursors of its biosynthesis are glycine, glutamine, aspartate, bicarbonate, and formyl tetrahydrofolate. Glutamine may arise from glutamate via glutamine synthetase, and glutamate itself and aspartate may arise from the transamination of other AA and excreted in excreta as uric acid (Wiggins et al., 1982).
1.2.4 Estimation of amino acids value of feedstuffs used in broiler diet 1.2.4.1 Bioavailability and digestibility
Digestibility is the fraction of a nutrient ingested that is not excreted in the feces and therefore is considered absorbed. Then, digestibility can be calculated by measuring dietary AA input and excreta AA output (Lemme et al., 2004), as followed:
Digestibility (%) = ((AAdiet - AAexcreta)/AA diet) X 100
The terms digestibility and bioavailability are often assumed as the same, but they are different. Bioavailability of dietary AA is defined as the portion of dietary AA in a form suitable for digestion, absorption and utilization for metabolism or protein syntheses (Batterham, 1992; Lewis and Bayley, 1995). The slope-ratio method is used to estimate bioavailability. However, this method is
11
expensive and time-consuming. In addition, each assay provides only the relative bioavailability value of one amino acid (Ravindran and Bryden, 1999). Therefore, digestibility is a better method to estimate bioavailability of AA and ileal digestibility is the most used method. It consists in collecting digesta at the distal part of the ileum and analyzing both the content of an indigestible marker added in the feed and the nutrient study in the digesta (Lemme et al., 2004). Ileal digestibility is more accurate to estimate AA bioavailability than excreta or total excreta digestibility because of the effect of hindgut microorganism on protein digestion and the contribution of microbial protein to the AA profile and concentration in excreta (Sauer and Ozimek, 1986; Lemme et al., 2004). Values of AA digestibility can be expressed in different ways: apparent digestibility, standardized digestibility, and true digestibility depending on how endogenous losses are considering.
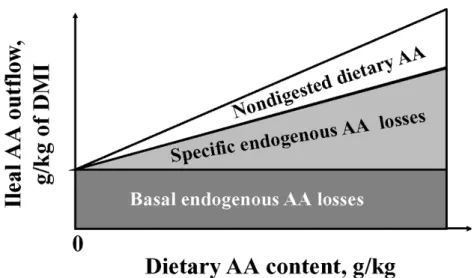
Part of the AA found in the ileal content are from endogenous origin, originated from different sources such as digestive secretions (saliva, bile, gastric, and pancreatic secretions as well as intestinal secretions), mucoproteins, sloughed intestinal epithelial cells, serum albumin, and amides (Hee et al., 1988). Those AA are defined as Ileal endogenous losses (IAAend). Endogenous AA losses are divided into two main fractions: basal (or non-specific) and specific losses (Lemme et al., 2004). Basal endogenous are the minimum and inevitably quantity of AA lost by the animal, they remain constant and are not affected by dietary AA level and diet composition because they are related to the physical flow of dry matter feed or the animal’s metabolic state (Figure 1-4). The specific AA losses are influenced by the composition of the diet and represent those losses above the basal losses (Stein et al., 2007; Adedokun et al., 2011). The specific feed ingredient characteristics that affect specific losses are related mainly to the type of fiber, anti-nutritional factors, and level of dietary protein (Kong and Adeola, 2014). Indeed, when diets with highly digestible purified proteins are used (i.e., casein or egg protein), the specific losses are minimal, but when diets using ingredients with high content of fiber or anti-nutritional factors are provided, the amount of specifics losses may represent more than 50 % of the total IAAend (Souffrant, 1991).
12
In chickens, glutamic acid (Glu), aspartic acid (Asp), Ser and Thr have been reported as the predominant AA in the ileal digesta (Siriwan et al., 1994; Angkanaporn et al., 1997; Adedokun et al., 2007a; Golian et al., 2008) and Thr and Ser, represent 28 to 33 and 13 to 16% of the tAA content of mucin respectively (Lien et al., 2001). Mucin is a polymeric glycoprotein that represents the main component of the mucus layer that covers the epithelium of the gastrointestinal tract (GIT) (Smirnov et al., 2006). Mucin is constantly secreted and renewed, which results in a high proportion of undigested mucin in the distal portion of the small intestine (Hoskins, 1984). Consequently, the apparent digestibility values of some AA are compromised especially Thr which represent a high proportion in the ileal digesta due to its high contribution from mucin (Adedokun et al., 2011).
The apparent ileal digestibility (AID) of AA is the amount of dietary AA absorbed from the digestive tract proximal to the distal ileum, and it can be represented by the following expression.
AID (%) = ((AA intake – Ileal AA outflow)/ AA intake) X 100
In the concept of true ileal digestibility, values are corrected for the total (basal and specific) ileal IAAend. It means that only the undigested dietary AA and not the IAAend in the ileal content are related with the intake (Stein et al., 2007). The true ileal digestibility (TID) is calculated equally
Figure 1-3 Influenced of dietary AA content on the partitioning of AA in ileal digesta from pigs (taken from Stein et al., 2007)
13
than AID, but the total IAAend of AA are subtracted from the ileal outflow of AA, as is shown in the following expression:
TID (%) = ((AA intake – (Ileal AA outflow - total IAAend)/ AA intake) X 100
Specific IAAend are affected by the amount and nature of the dietary protein source (Angkanaporn et al., 1997; Dänicke et al., 2000; Souffrant, 2001) and the procedures to measure them are labor demanding, expensive and not yet reliable (Stein et al., 2007)
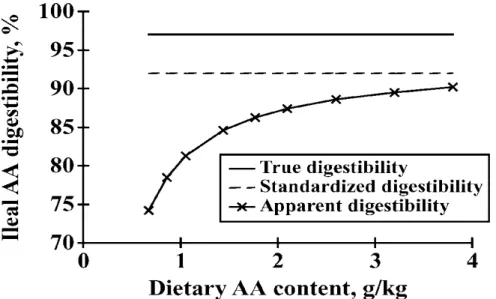
Values of standardized ileal digestibility (SID) are only corrected by the basal IAAend. As a result, SID can be considered as intermediate values between AID and TID, (Stein et al., 2007) and they are independent of dietary AA level (figure 1-3).
To obtain SID values the following expression can be used:
SID (%) = ((AA intake – (Ileal AA outflow - basal IAAend)/ AA intake) X 100 If AID values are already calculated, then the following equation should be used:
Figure 1-4 Influence of the dietary AA content on the measured values of apparent, standardized and true ileal AA digestibility (taken from Stein et al., 2007).
14 SID (%) = AID + (basal IAAend)/ AA diet) X 100 1.2.4.2 Ileal digestibility assays
Digestibility assays are the most common and favored technique to estimate AA value for feed formulation; due to digestibility is the greatest single determinant of AA availability (Lemme et al., 2004). One of the greatest advantages of these methods is its ability of measuring all amino acids in one assay. Digestibility assays are divided in two categories according to site of digesta collection: excreta and ileal. Excreta digestibility, commonly named retention, refers to the collection of excreta either from intact or caecectomised birds. On the other hand, in ileal digestibility, digesta are collected from the distal part of the ileum because amino acid absorption takes place essentially in the small intestine. Consequently, contamination from AA in the urine and microbial protein and also its modifying effects are avoided, providing more accurate measure of available AA for animals.
The slaughter technique is the most commonly used method to collect ileal content in birds (Adedokun et al., 2007a; 2008). In this method, animals normally fed the experimental diets for 5 to 7 days with an indigestible marker included in the diet. Then, birds are killed and the lower small intestine is removed and gently flushed with distilled water to collect ileal digesta. The main advantage of this technique is the relatively quick way of sampling animals and that there is no need of surgical procedures (Batterham, 1994). For that reason, The cannula method is not often used in birds because of the complicated surgical procedures and only mature animals can be employed (Lemme et al., 2004).
To estimate ileal digestibility of AA, it is necessary to know the amount of AA in the diet and digesta. Therefore, it requires the addition of an indigestible marker in the diet, which must be an inert material that is not digested or absorbed in the gastrointestinal tract and have no effect on the digestive system (Laplace, 1972). Amino acid digestibility is determined by the ratio of the concentration of the marker in the diet to the concentration of the marker in the ileal digesta or feces. There are three indigestible markers that can be used in digestibility assays: chromium oxide (Cr2O3), acid insoluble ash (AIA), and titanium dioxide (TiO2).
15
Chromium oxide is very effective as a marker because it can be added in a very low inclusion rate (0.25-0.50%), and is well incorporated into the diets. This marker has been criticized for its low repeatability and high variability for the analytical assay (Sales and Janssens, 2003). However, according with Scott and Boldaji (1997) it has the advantage that only a small amount of sample is required to run the chemical analysis. Titanium dioxide is a white pigment insoluble in water that was proposed as indigestible marker by Jagger et al. (1992), and rate of passage is similar to Cr2O3. When TiO2 was compared with Cr2O3 by Monforte-Braga (2006) in broiler chickens, higher values of digestibility were obtained using TiO2 and less variation. Acid insoluble ash (AIA) is another marker. When the marker goes through acid digestion, Celite® will precipitate into a salt (NHCl), which can be measured in the feces, ileal digesta, and feed. One of the disadvantages of this marker is the need of a large amount of sample, which is around 3 g, for accurate analysis (Scott and Boldaji, 1997). However, it is generally cheaper than other markers.
1.2.4.2.1 Methods to estimate basal endogenous AA losses
There are several methods to estimate endogenous AA losses, which include feeding a protein free diet, the peptide alimentation technique, feeding a highly digestible purified diet, and the regression method. Data from those methods should be considered representative of basal losses. The protein free diet
The protein free diet method (PFD) is the most common methodology used to estimate basal endogenous losses. This method is however criticized because of its unphysiological nature. Main concerns are related to the fact that amount of endogenous AA secreted does not represent the amount of AA secreted when protein is added in the diet (Moughan et al., 1992) and the secretion of proteolytic enzymes is not stimulated (Ravindran and Bryden, 1999).
Highly digestible protein method
It consists of using a highly digestible protein such as casein, which is used as the only source of protein in the diet. This method assumes that dietary AA from casein are 100% digestible and they are absorbed prior to the distal ileum. When this method is used in pigs, results are not consistent. Some authors report higher values of endogenous AA from casein and crystalline AA in
16
comparison with protein free diet (Chung and Baker, 1992; Adedokun et al., 2007c). On the contrary, Fuller and Cadenhead(1991) report higher values for protein free diets, and Leibholz (1982), reported not differences between both methods. It may due to the increased stimulation of digestive secretions due to the dietary protein or to incomplete digestion of protein in casein. The peptide alimentation
This method is based in an enzymatically hydrolyzed casein diet (EHC) as the sole source of protein (Moughan et al., 1990), which is a mixture of free AA and low molecular weight oligopeptides (< 5000 DA). Assuming that AA of dietary origin are supposed to have a molecular weight < 10000 DA (dalton) while the AA of endogenous losses have a molecular weight > 10000 DA, it allows the separation of AA endogenous and dietary by centrifugation followed by ultrafiltration, where the AA of dietary origin supposed to be in the low molecular weight supernatant and the endogenous AA are contained in the high molecular weight precipitate. Normally higher losses are obtained using EHC when they are compared with those obtained by protein free method (Butts et al., 1993; Leterme et al., 1996), and has been reported that this method may provide lower estimates of basal endogenous AA than using intact highly digested protein or synthetic AA diets (Butts et al., 1993).
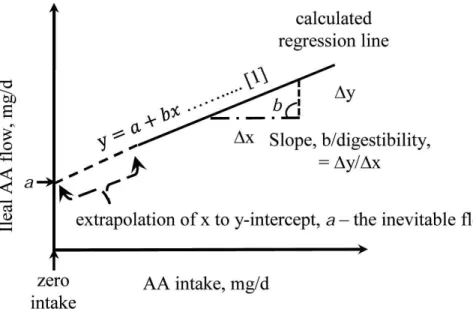
The linear regression method
In this approach, a series of diets with graded level of protein are formulated for the birds Carlson and Bayley (1970). Then, if there are linear relationships between dietary content of apparent ileal digestible and total AA content, the endogenous amino acids levels in ileal digesta can be determinate by extrapolating the dietary AA to zero, which are represented by the intercept of the equation (Fan et al., 1995; Rodehutscord et al., 2004).
17
Figure 1-5 Schematic representation of regression approach to study inevitable ileal endogenous flow and standardized ileal digestibility by regression (Taken from Akinde, 2016).
There are two important concerns about this method; first at all the estimation error of the extrapolation may be high, especially if there is a wide gap between the theoretical zero intake and the lowest data. However, according with Akinde (2016) this point should be subject to more investigation because the slope/digestibility is mathematically asymptotically stable at all values of AA/CP intake. Second, the possible plateau effect of basal CP level in the flow and digestibility assays may affect values of AID determination due to the curvilinear relationship between basal (Lemme et al., 2004). It is worthy to note, that by using seven linear regression selecting five levels of CP levels (500, 1000, 1500 2000 and 2500 mg / kg) Siriwan (1993) found similar intercepts and similar slopes in broilers. This shows that there was no evidence that intercept depends on N ingestion level. However, in pigs, Fan and McBuerney (1995) observed large differences among extrapolated intercepts across different ranges of dietary CP concentration using levels from 40 to 240 g/kg, but they found also huge error of determination (SE) which means that these differences may be more attributed to statistical deviations unrelated to the animal biology (Fan et al., 1995; Akinde, 2016). One advantage of this method is that allows the use of practical diets with feed ingredients used in poultry nutrition, instead the use of protein free diet that results in abnormal physiological conditions (Nyachoti et al., 1997; Adedokun et al., 2011). However, the use of this
18
technic requires at least three diets with different levels of AA or CP, which is costly in time and animals (Akinde, 2016).
1.2.5 Factors modulating amino acid digestibility in broilers
Amino acid digestibility can be affected by many factors such as, breeding programs, agronomic conditions, presence of anti-nutritive factors, and processing. Moreover, factors influencing endogenous AA may also be considered due to its strong influence on AA digestibility, especially in the apparent ileal concept (Bryden and Li, 2010).
1.2.5.1 Age and physiological state of bird
Age and physiological state of the bird are known to influence the ability to digest and absorb protein and AA (Tarvid, 1995). It is generally reported that the digestibility coefficient of AA increase with the age and varied with feedstuff (Bryden and Li, 2010), but some authors report lowered digestibility of CP and AA with advancing age (Hakansson and Eriksson, 1974; Fonolla et al., 1981; Zelenka and Liska, 1986). These differences may be explained by differences in the methodology used (Bryden and Li, 2010).
The effect of the age might be influenced by the type of feedstuff. Huang et all (2005) reported an increase of digestibility coefficients with advancing age for corn, but digestibility of most AA in wheat and sorghum was higher at 14 d than 28 d of age. The increase on AA coefficient digestibility with advancing age can be explained by the fact of the increase in the intestinal mass (Wakita et al., 1970). Moreover, young chickens have a rapid growth rate as well as a larger intestinal surface area per unit weight which may contribute to the high intestinal uptake of nutrients (Wakita et al., 1970; UNI et al., 1995).
Part of the differences in digestibility coefficients attributed to the age, may reflect differences in endogenous AA flows (Ravindran and Hendriks, 2004). In fact, endogenous AA losses (mg/kg of DM) were twice fold higher in broiler at 5d compared with broilers at 15d and 21d (Adedokun et al., 2007a). This difference can be attributed to an increased rate of digestion and absorption of
19
endogenous proteins and/or a decreased rate of mucin secretion with age (Nasset, 1972; Ravindran and Bryden, 1999).
1.2.5.2 Feed Milling and processing
Due to the high concentration of ANFs in the most used source of protein for poultry (grain legumes, oilseed meals), some processes have been implemented to reduce their deleterious effects in these feedstuffs. As an example, heat process is essential for the inactivation of many ANFs such trypsin inhibitors (TIs). However, this process can produce Maillard type reactions in presence of carbohydrates, protein crosslinking and AA racemization, which results in a reduction protein quality (Friedman, 1996). Heat processes also contribute to the variability of digestibility values of ingredients such as protein meals and cottonseed meal (Dale, 1996 134). Because Lys is heat sensitive, the low digestibility of this AA reported in meals as cottonseed meal may reflect the effect of heat process on the meal (Bryden and Li, 2010). In meat meals such as meat and bone meal (MBM), variation in AA digestibility are also due to differences in the raw ingredients (e.g. pig, beef or mixed), time between slaughter and rendering, duration, pressure and temperature of the rendering process (Skurray, 1974; Shirley and Parsons, 2000; Karakas et al., 2001). The effect of process such as grinding to modify the particle size and shape of the feedstuffs has not chemical changes in the feedstuffs but it has been reported that grinding improves nutrient digestibility in birds (Hamilton and Proudfoot, 1995). The increased surface area available for enzymatic process can explain it (Amerah et al., 2007).
1.2.5.3 Modulating factors of endogenous losses in broilers 1.2.5.3.1 Dietary protein or amino acid
Crude protein and AA concentration increase the digestive enzyme secretion and mucin dynamics in the gut of monogastric animals, resulting in the increase of the amount of endogenous losses (Adedokun et al., 2011). The effect of varying CP level on endogenous losses has been studied previously in pigs (Zhang et al., 2002; Eklund et al., 2008). In a study to estimate endogenous losses in weaned pigs Eklund et al. (2008), found that when varying the CP level from 90 to 415 g/kg the amount of endogenous losses increased as CP level increased. The same author and Fan
20
et al. (1994) found linear relationships between endogenous losses and CP and AA level in the diets, in the latter study the CP level varies from 40 to 240 g/kg using soybean meal as source of protein in grower-finisher pigs.
1.2.5.3.2 Dietary fiber
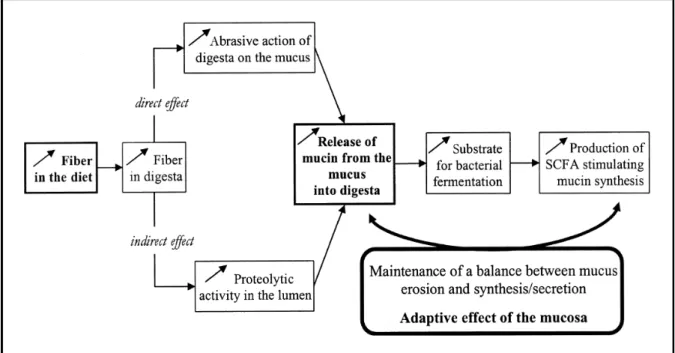
Dietary fiber has the ability of affecting mucin dynamics (figure 1-6), which includes mucin secretion in the GIT of animals (Montagne et al., 2004; Adedokun et al., 2011). The increase of endogenous losses as consequence of high inclusion of dietary fiber is well-known in pigs, showing that different sources of dietary fiber like cellulose or pectin increase the endogenous AA losses at the terminal ileum (Taverner et al., 1981). In the same study, the average endogenous AA level was related to the level of dietary fiber, except for glycine and proline. In broilers, few studies have assessed the effect of fiber fractions on the endogenous losses, but Kluth and Rodehutscord (2009) concluded that high concentration of fiber (80 g of cellulose / kg of diet) in the diets of broiler chickens increases the endogenous losses. However, the composition of the endogenous losses was not affected; being glutamic acid, aspartate, and threonine the AA with highest flow in both diets (high and low fiber). The increase of endogenous losses caused by increase dietary fiber is due to increased cellular losses of epithelial cells or, increased mucus secretion or both in pigs (Taverner et al., 1981). Also, the solubility of fiber and also the water-holding capacity (WHC) of the fiber in the diet increase the endogenous losses, especially when WHC exceed 3 g of water / g of DM intake in pigs (Leterme et al., 1998).
21
Figure 1-6 Hypothetical effects of dietary fiber on the balance between mucus erosion releasing mucin into the gut lumen and synthesis and secretion of mucin from the goblet cells. SCFA _ short-chain fatty acids (taken from Montagne et al., 2004).
In chickens, the effects of different sources of dietary fiber on EL has been evidenced. Protein free diets containing potato starch-pectin also resulted in higher endogenous losses than birds fed with insoluble fiber as cellulose (Parsons et al., 1983; Parsons, 1984). In summary, the effect of fiber on endogenous AA losses has been demonstrated in pigs, and the few studies in broilers suggest a similar effect.
1.2.5.3.3 Anti-nutritional factors
The effects of ANFs in reducing apparent digestibility work in two ways; 1) by increasing the endogenous AA losses, and 2) by reducing the digestion of both endogenous and dietary AA (Angkanaporn et al., 1994). In the first case, the effect of ANFs as tannins, lectins and protease inhibitors of poultry feedstuffs on growth performance has been well discussed in a considerable number of published papers. However, report of the effect of ANFs on AA endogenous losses is not common (Mansoori and Acamovic, 2007). In general, ANFs increase endogenous AA losses by
22
enhancing endogenous secretions and/or by decreasing degradation and reabsorption of endogenous N (Nyachoti et al., 1997).
Protease inhibitors are components of plants and play an important role in the defense against insects, microorganisms and other predators. Protease inhibitors are able to inhibit enzymes especially trypsin and chymotrypsin (Liener, 1989). Two important families of TIs have been isolated: the Kunitz soya trypsin inhibitor family (STI) and the Bowman-Birk trypsin inhibitor (BBI). Soya trypsin inhibitors affect primarily trypsin and weakly chymotrypsin, and BBI inhibits both trypsin and chymotrypsin (Liener, 1970; Van der Poel et al., 1993). Most legume seeds and raw soybeans contain high levels of TIs. In legume seeds the main TI is BBI whereas STI is in lower level. On the other hand, in raw soybeans the main TI is the STI. In poultry, an increase of trypsin inhibitor activity in soybean resulted in a reduction in protein digestibility, weight gain and feed conversion efficiency (Palliyeguru et al., 2011). The inhibition of intestinal proteolysis arise a hyper secretory activity of the pancreas to counteract the effect of protease inhibitors (Yen et al., 1977), which may increase endogenous AA losses due to an increased secretion of trypsin and chymotrypsin because a feedback loop elicited by trypsin inhibition (Corring et al., 1986). Barth et al. (1993) suggests that the influence of protease is quantitatively more important on endogenous protein than dietary CP or AA digestibility. In that study, intake of 3000 mg of trypsin inhibitor in a casein-based diet caused a 7.8-fold greater rise of endogenous compared with exogenous protein. Tannins are found in many poultry feedstuffs as sorghum, barley and faba beans. These molecules can bind proteins and affect AA digestibility (Duodu et al., 2003). They are also known to interact with both dietary and endogenous AA in the digestive tract decreasing true AA digestibilities (Jansman, 1993). Mansoori and Acamovic (2007) studied the effect of tannic acid on endogenous losses in broilers and found that EL of all the AA was increased when the content of tannins increased in the diet. The effect of tannins was greater for Met, His and Lys, probably due to the important role of Met and His in the elimination of tannins. Additionally, there is evidence of hypersecretion of mucin and hypertrophy and hyperplasia of the global cells in the intestinal tract due to tannins (Mitjavila et al., 1977; Sell et al., 1985; Ortiz et al., 1994). As previously discussed, tannins as other ANFs affect the reabsorption of endogenous AA from the gut lumen. There are reports of adverse effects of tannins on the intestinal absorption, uptake mucosal and transport of
23
AA. It could be due to the reduction of mucosal uptake, which might be consequence of the disturbance in Na+ -K+ pump co-transportation of AA, directly, or through the inhibition of Na+ -K+ ATPase, indirectly (Karasov et al., 1992; Zdunczyk et al., 1996).
Phytic acid is found in most plants feedstuff use in poultry diets (Graf, 1983). An increase of endogenous losses in the terminal ileum of broiler with increasing dietary phytic acid has been reported in few studies (Cowieson et al., 2008; Onyango et al., 2009; Liu and Ru, 2010). Phytic acid may increase the endogenous losses through negative feedback mechanism by binding to dietary protein and endogenous digestive enzymes in the gastrointestinal tract, hence increasing the secretion of the enzymes (Woyengo and Nyachoti, 2013). The effect of phytic acid on the increase of mucin has been reported in chickens (Onyango et al., 2009). These authors mention that the specific mechanism by which phytic acid increases mucin production is not clear, but it is known that mucins have an important protective and lubrication role in digestive tract and irritation of epithelial surfaces often results in increased mucin secretions. Therefore, it is possible that increase in mucin secretions may be a respond of the gut mucosa in response of irritation. Moreover, phytic acid could increase endogenous losses of AA by reducing the reabsorption of the endogenously secreted AA in the small intestine.
1.3 Analysis of data from different studies: Meta-analysis
1.3.1 Basic concepts of simple and multiple regression analysis
Multiple linear regression is a statistical tool for the investigation of relationships between variables; a response variable, y, varies depending of the variation of one or a set of independent variables x1, x2, ..., xm.
The variance of y has two components: a systematic part and a random part. The systematic
variation of y can be explained by the independent variables. Therefore, it can be modeled as a
function of the x variables. The relationship of y in relation to x1, x2,..., xm, is called the regression
24
the model. In short, multiple linear regression fits a dependent variable y (response) to a function of regressor variables and parameters. The general linear regression equations have the form:
! = $%+ $'('+ $)()+ ⋯ + $+(++ , Where
• Y is the response, or dependent, variable. • β0, β1, …, βm are unknown parameters.
• x1, x2, ..., xm are the regressor, or independent, variables. • ε is a random error term.
1.3.1.1 Estimation of unknown parameters
Least squares is a technique for estimating of parameters β0, β1, …, βm using a set of observed values. To find the best estimators, the least squares minimize the sum of the squared differences between the y value observed and the y value predicted by the equation. The estimates are called the least-squares estimates and the error sum of squares.
Linear regression analysis is used to:
• Obtain the least-squares estimates of the parameters. • Estimate the variance of the error term.
• Estimate the standard error of the parameters estimates. • Test hypotheses about the parameters
• Calculate predicted values using the estimated equation • Evaluate the fit or lack of fit of the model.
25
The investigator selects the x’s values, these values are not random but the response values are random. Y values are sampled from several populations.
Often, it is not possible to control the actual values of the independent variables; as a result, you should assume that they are fixed with respect to the response variable. Additionally, it must be assumed that:
1. The model is correct, that means, all the important independent variables are included and the functional part is appropriate.
2. The expected values of the errors are zero.
3. The variances of the errors (and thus the response variables) are constant across observations.
4. The errors are uncorrelated.
5. For hypothesis testing, the errors are normally distributed.
Sometimes the random error may not be normally distributed. In this case, the least squares technique is not necessary the appropriate method for estimating the parameters, therefore the logistic regression model or other distribution as Poisson should be considered for using.
1.3.1.2 Partitioning the sums of squares
Least square technique is based in the partition of the sum squares of the dependent variable. The variation of y is measured in terms of deviation.
! − ! Where:
26
This basic identity shows that the total sum of squared deviations from the mean, (! − !)), is equal to the sum of squared differences between the mean and the predicted values, (! − ŷ)), plus the sum squared deviations from the observed y’s to the predicted values, (! − ŷ)). These parts all called the sum of squared of the regression (model) and the residual (error) sum of squares, which corresponds to the random or not explained variation of the data.
Corrected Total SS = Model SS + Residual SS
A set of data has always the same Corrected Total SS, regardless which model is used; whereas Model SS and Residual SS depend on the model. When the relation between Model SS and corrected total increases, the effect of the regression is greater on the total variation. Largely, the addition of a new x variable to a model increases the Model SS, and reduces the Residual SS. If the Residual SS increases, the variation of y’s according to the regression line adjusted will be greater.
1.3.1.3 Hypothesis Testing
Inferences on the parameters are greatly depending on the other parameters in the model. So that, it is important to accentuate the parameters for which inferences are adjusted in the hypothesis testing.
Statistical inferences can be made using terms of linear functions of the parameters: Ho: Lβ0: l0β0 + l1β1 +… + lmβm = 0
Where the li are the arbitrary constants chosen to correspond to a specific hypothesis. Such functions are estimated by the corresponding linear function
L10: l0β0 + l1β1 +… + lmβm
Of the least squares estimates β. The variance of L1 is V(L1) = (L(x’x)-1L’) σ2
27
To test H0: (L1) = 0 a test t or F test can be used. Usually the denominator is the residual mean square (MSE). The test of the hypothesis includes all the model parameters, because the variance of the estimated function is based on statist computed of the entire model.
To determinate if there is regression relation between the dependent variable y and the set of independent variables x1, x2, … , xm. The hypothesis tested is:
H0 = $' = $) = ⋯ = $+ = 0 Vs. H1 = $' = $) = ⋯ = $+ ≠ 0 A test H0 is provided by the F statistic
F = (model SS / m)/MSE Where
The F statistic has (m, n-m-1) degrees of freedom.
When H0 is rejected it is assumed that there is regression relation between y and the set of xs. 1.3.2 Definition and applications of meta-analysis in animal nutrition
Meta-analysis is a technique that allows summarizing and quantifying knowledge from previously published research. In animal nutrition, this technique has been applied more often because of the increasing number of publication and quantitative data (Sauvant et al., 2008). The general objective of the meta-analysis is to analyze concomitantly data from different studies. The main advantage of a meta-analysis is the possibility to increase the power of the statistical analysis and obtain estimations more precise than these obtained by only one study. Also by including the effect of the study it allows removing the absence of effect in some studies given the high statistical power (Sauvant et al., 2008). One of the main limitations is the data. Indeed, in many cases data are unbalanced and factor effects are not orthogonal (independent), which result in statistical estimation problems such as leverage points, near collinearity, and factor disconnectedness that prohibits the testing of the effects that are completely confounded with others (Sauvant et al., 2008).
28
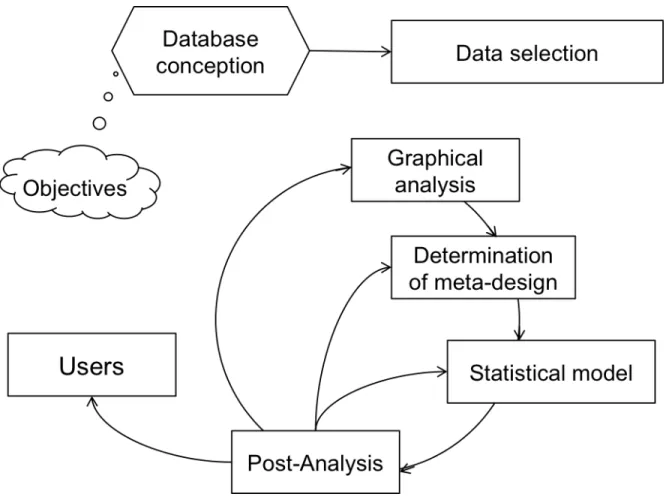
1.3.3 Steps followed in the current meta-analysis process
Meta-analysis is an iterative process where prior steps can be re-visited and refined because of its heuristic characteristic (figure 1-7). In this process, there are several inherent steps of which the most important and those followed here will be discussed.
1.3.3.1 Objective of the study
The objectives of the study define the structure of the database, the data filtering process and the choice of the statistical model. As a consequence, this first step is critical in a meta-analysis process (Sauvant et al., 2008). The objective can be exploratory with a wide range of targets to find potential factors affecting a system.
1.3.3.2 Data entry and filtering
An exhaustive research of information of prior studies found in the literature must be done in order to obtain the maximum of data to develop a good meta-analysis; this information can be found using online databases such as Web of Science, CAB abstracts, Prod INRA and Science Direct. After an exhaustive collection, a database is created containing all the variables and factors according with the objective of the meta-analysis with codes. The coding is important to avoid the improper aggregation of results across studies with different objectives (Sauvant et al., 2008). It is possible that not all the information collected is appropriated for the meta-analysis; therefore, a filtering of data should be done. First, the study under consideration is coherent with the objective of the meta-analysis. The second step includes a critical review of each publication, focusing on the detection of errors in the quantitative results. In the third step, it is important to evaluate that a publication is not an outlier with respect with the characteristics and relations under consideration. 1.3.3.3 Meta-design and graphical examination
An important step in the meta-analysis process is the graphical evaluation of the data. This visual analysis allows to have a previous idea about the nature and relative importance of the inter and
29
intra study relationships between dependent variables, predictors, factors, etc. It is also helpful to identify outliers or unique observations by regarding the coherence and heterogeneity of the data.
Figure 1-7 Schematic representation of a meta-analytic process (adapted from Sauvant et al., 2008)
1.3.3.4 Determination of the meta-design and study effect
The structure of the meta-design depends of the structure of the experiments for each of the predictor variables. One important aspect on this stage, is to determinate the significance of the study effect on the independent variables (Sauvant et al., 2008). The study effect represents the variance between studies that is not explained by the other variables in the model, and, in general terms, it would be desirable that its component of variance and interactions with predictors to be
30
small and nonsignificant (St-Pierre, 2001). In statistics terms, studies are blocks of observations, which can be assumed as a random or fixed effect. An effect is fixed when the study represents all the possible levels of the factor (Littell, 2006), and random, when the levels of the factor used in the study, represents only a random sample of all the possible levels (St-Pierre, 2001).
It is suggested by St Pierre (2001) that the study effect must be included in the meta-analytic models to avoid biased parameter estimates of the effects of other parameters under investigation. Moreover, due to the study effect represents the sum of the effects of many factors with relative small effects on the dependent variable, the study should be considered random. According with Sauvant et al. (2008) the choice depends also on the size of the conceptual population, and the sample size (number of studies in the meta-analysis). Another aspect to considerer in the determination of random or fixed effect is related to the inference desired for the user. If the purpose of the model is to inference only about the effect-size parameters in the set of the studies in the meta-analysis, the fixed effect should be appropriate. In contrast, if the analyst wants to make inferences about parameters of a population of studies that is larger than the set of studies in the meta-analysis, the random effect is the appropriated (Hedges and Vevea, 1998).
When two predictor variables are included in the model, a graphical and statistical analysis must be done to examine inter and intrastudy relationships between the predictor variables. It is also very important to assess the degree of independence between the predictor variables.
1.3.3.5 Selection of statistical model
The variables in the statistical model can be of two types: discrete or continues. Models can be performed using only continues, only discrete or both.
Model with discrete predictor variable
Yijk = µ + Si + Tj + STij + eijk
where Yijk = the dependent variable, µ = overall mean, Si = the random effect of the ith study, Tj =
31
the jth level of factor T, and eijk the residual errors. eijk, STij and Si are assumed to be independent
random variables.
When the study effect is included in the model, it is important to test its interaction with the predictor variables, it is wished that this interaction to be highly non-significant. Otherwise, a significant interaction means that the linear relationship between y and x depends on the study, hence unidentified factors.
1.3.3.6 Post-analysis evaluation
After the statistical model is fitted, numerous analyses should be applied to assess the assumptions underlying the model. Examination of residuals (errors) is the common way to evaluate assumptions. In statistical models, residuals are assumed uncorrelated, with mean zero and variance homogenous and following a normal distribution. The normal distribution of the errors is tested by using the test of Shapiro-Wilks or a standard X2. The study of residuals allows also to check the presence of outliers by using the Studentized residuals, where values exceeding 3 are suspected as outliers (Tomassone et al., 1992). According with Sauvant et al. (2008) the removal of an outlier should be done with extreme caution due to data come often from models that are already free from them. Other methods such as laverage values, Cook’s distances can be used in the determination of the influence of each observation in the parameters estimated (Tomassone et al., 1992).
32
1.4 Hypothesis and objectives of this research
The possibility of predicting and studying AA digestibility based in chemical composition of the diets has been previously demonstrated in pigs (Messad et al., 2015; 2016). Therefore, the hypothesis of this study is that the apparent ileal digestibility of amino acids can be determinate using the chemical composition of fed ingredients for poultry diets, and the relationship between digestible AA concentration and total amino acids concentration allows studying endogenous losses.
Objectives
Using a meta-analysis approach, the objectives of this research were:
• To develop statistical models to predict AA digestibility of feedstuffs for broilers based on published chemical analysis data.
• To study endogenous losses by performing a linear regression between digestible AA concentration and total AA concentration in poultry fed diets.
33
References
Adedokun, S., O. Adeola, C. Parsons, M. Lilburn, and T. Applegate. 2008. Standardized ileal amino acid digestibility of plant feedstuffs in broiler chickens and turkey poults using a nitrogen-free or casein diet. Poultry science 87: 2535-2548.
Adedokun, S., P. Jaynes, M. A. El-Hack, R. Payne, and T. Applegate. 2014. Standardized ileal amino acid digestibility of meat and bone meal and soybean meal in laying hens and broilers. Poultry Science 93: 420-428.
Adedokun, S., C. Parsons, M. Lilburn, O. Adeola, and T. Applegate. 2007a. Endogenous amino acid flow in broiler chicks is affected by the age of birds and method of estimation. Poultry Science 86: 2590-2597.
Adedokun, S., C. Parsons, M. Lilburn, O. Adeola, and T. Applegate. 2007b. Standardized ileal amino acid digestibility of meat and bone meal from different sources in broiler chicks and turkey poults with a nitrogen-free or casein diet. Poultry Science 86: 2598-2607.
Adedokun, S. A., O. Adeola, C. M. Parsons, M. S. Lilburn, and T. J. Applegate. 2011. Factors affecting endogenous amino acid flow in chickens and the need for consistency in methodology. Poultry Science 90: 1737-1748.
Adedokun, S. A., C. M. Parsons, M. S. Lilburn, O. Adeola, and T. J. Applegate. 2007c. Standardized ileal amino acid digestibility of meat and bone meal from different sources in broiler chicks and turkey poults with a nitrogen-free or casein diet. Poultry Science 86: 2598-2607.
Adeyemo, G., and O. Longe. 2007. Effects of graded levels of cottonseed cake on performance, haematological and carcass characteristics of broilers fed from day old to 8 weeks of age. African Journal of Biotechnology 6.
Akinde, D. 2016. Application of linear regression to elucidate ileal inevitable flow and digestibility of amino acids and consequences for standardised digestibility system. World's poultry science journal 72: 245-264.
Al-Marzooqi, W. et al. 2010. Apparent ileal amino acids digestibility of four varieties of barley for two strains of chickens. International Journal of Poultry Science 9: 527-532.
Alpers, D. 1987. Digestion and absorption of carbohydrates and proteins.
Amerah, A., V. Ravindran, R. Lentle, and D. Thomas. 2007. Feed particle size: Implications on the digestion and performance of poultry. World's poultry science journal 63: 439-455.
Angkanaporn, K., M. Choct, W. L. Bryden, E. F. Annison, and G. Annison. 1994. Effects of wheat pentosans on endogenous amino acid losses in chickens. Journal of the Science of Food and Agriculture 66: 399-404.
Angkanaporn, K., V. Ravindran, Y. Mollah, and W. Bryden. 1997. Evaluation of homoarginine as a marker for the determination of endogenous amino acid concentrations in poultry excreta. British poultry science 38: 577-585.
Bandegan, A. et al. 2011. Standardized ileal amino acid digestibility in wheat, barley, pea and flaxseed for broiler chickens. Canadian Journal of Animal Science 91: 103-111.
Bandegan, A., W. Guenter, D. Hoehler, G. Crow, and C. Nyachoti. 2009. Standardized ileal amino acid digestibility in wheat distillers dried grains with solubles for broilers. Poultry Science 88: 2592-2599. Bandegan, A. et al. 2010. Standardized ileal amino acid digestibility in dry-extruded expelled soybean meal, extruded canola seed-pea, feather meal, and poultry by-product meal for broiler chickens. Poultry Science 89: 2626-2633.
Barth, C. A., B. Lunding, M. Schmitz, and H. Hagemeister. 1993. Soybean trypsin inhibitor (s) reduce absorption of exogenous and increase loss of endogenous protein in miniature pigs. The Journal of nutrition 123: 2195-2200.