HAL Id: hal-02071136
https://hal.archives-ouvertes.fr/hal-02071136
Submitted on 18 Mar 2019HAL is a multi-disciplinary open access archive for the deposit and dissemination of sci-entific research documents, whether they are pub-lished or not. The documents may come from teaching and research institutions in France or abroad, or from public or private research centers.
L’archive ouverte pluridisciplinaire HAL, est destinée au dépôt et à la diffusion de documents scientifiques de niveau recherche, publiés ou non, émanant des établissements d’enseignement et de recherche français ou étrangers, des laboratoires publics ou privés.
diamond airfoil designed for space launchers applications
Jeromine Dumon, Yannick Bury, Nicolas Gourdain, Laurent Michel
To cite this version:
Jeromine Dumon, Yannick Bury, Nicolas Gourdain, Laurent Michel. Numerical and experimental investigations of buffet on a diamond airfoil designed for space launchers applications. IUTAM Sym-posium on Critical flow dynamics involving moving/deformable structures with design applications, Jun 2018, Santorini Island, Greece. pp.1-14. �hal-02071136�
an author's https://oatao.univ-toulouse.fr/22760
Dumon, Jéromine and Bury, Yannick and Gourdain, Nicolas and Michel, Laurent Numerical and experimental investigations of buffet on a diamond airfoil designed for space launchers applications. (2018) In: IUTAM
Symposium on Critical flow dynamics involving moving/deformable structures with design applications, 18 June 2018 - 22 June 2018 (Santorini Island, Greece).
NUMERICAL AND EXPERIMENTAL INVESTIGATIONS
OF BUFFET ON A DIAMOND AIRFOIL DESIGNED FOR
SPACE LAUNCHERS APPLICATIONS
Jéromine DUMON
1,2, Yannick BURY
1, Nicolas GOURDAIN
1, Laurent MICHEL
21 ISAE-SUPAERO, Dpt. of Aerodynamics, Energetic and Propulsion, University of Toulouse, France 2 ISAE-SUPAERO/Institut Clément Ader, University of Toulouse, France
jeromine.dumon@isae.fr, Yannick.bury@isae.fr, Nicolas.gourdain@isae.fr, Laurent.michel@isae.fr
Abstract. The capability to reuse space launchers for new missions requires to better understand flow phenomena in the transonic regime, such as buffet, and its interaction with the structure. Indeed, the mechanical integrity of the launcher can be compromised by shock/boundary layer interactions, that induce lateral forces responsible for plunging and pitching moments. This work reports some numerical and experimental investigations about the aerodynamic and aero-elastic behavior of a diamond airfoil, designed for microsatellite-dedicated launchers, with a particular interest for the fluid/structure interaction during buffeting. Experiments have been conducted, based on Schlieren visualizations, and compared with numerical predictions obtained with unsteady RANS and Large-Eddy Simulation. Finally, the effect of buffeting on the composite aileron is studied by solving the equation of the dynamics, showing that the aerodynamic response of the airfoil tends to damp the structural displacement, and thus limit the effect of buffeting. Key words: buffet, URANS, LES, wind tunnel test, fluid structure interaction, composite.
1. Introduction
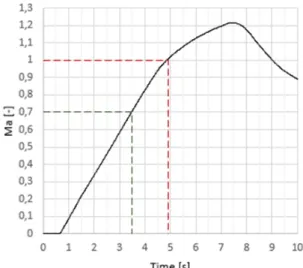
Microsatellite-dedicated launchers, for which payload is lower than 50kg, are of paramount importance for future space missions. Among the difficulties encountered for the design of such launchers, the aero-elastic behavior of the ailerons in transonic regimes still remains nowadays partly unknown. Such ailerons are originally designed to provide stability to the launcher, especially when lateral winds are experienced. The PERSEUS’ project (French acronym for Academic and Scientific European Student project for Space research) is an initiative of CNES, the French Space Agency, to promote the emergence of innovative technical solutions for space launchers. The present work takes place in the frame of the development of SERA (Supersonic Experimental Rocket ARES) series launchers (Figure 1). To improve the stability of the rocket, SERA is equipped with three ailerons, composed of diamond airfoils made in composite material. With the objective to increase their reliability in turbulent transonic flows, it is necessary to better understand the interaction between the unsteady flow, including shock induced flows, and the composite walls. Moreover, such information is relevant in the context of reusable launchers, where the number of cycles that can be accomplished by the aileron must be accurately predicted. It is thus necessary to predict the loads that occurs during buffeting, to ensure that structure components and subsystems possess adequate strength, stress and fatigue margins in regard to the structural dynamic response. Buffeting is a well-known instability, that occurs in the transonic regime. Buffet is characterized by fluctuating pressures resulting from flow-induced turbulence, flow separation, wake effects, and shock oscillations. The interaction between the shock wave and the separated boundary layer causes the inception of instabilities responsible for a self-sustained periodic motion of the shock over the surface of the airfoil. In a typical flight of a SERA rocket, the transonic regime occurs during less than two seconds during its atmospheric phase as shown in Figure 2.
2
Figure 1. Global view of the SERA launcher
and details of the aileron shape and dimensions [mm]
Figure 2. Evolution of the Mach number, as
recorded during a typical flight of the SERA rocket
Transonic buffet is observed in many aeronautical applications, including internal flows (e.g. compressor passages) and external flows (e.g. aircraft wings). This phenomenon has been extensively studied, see for example the works of Percey [1], Tijdeman [2] and Lee [3], thanks to experimental campaigns on reference geometries [4-5] or numerical simulations [6] [7] [8]. Based on this extensive knowledge, it has been possible to delay or alleviate buffeting in such geometries [9] [10] [11]. Unfortunately, the detailed mechanisms that are responsible for the buffet inception and its dynamics are still debated. Moreover, contrary to classical supercritical profiles for civil aircraft, there is a lack of studies for diamond airfoils, adapted to supersonic flows, which are the target of this work.
The first part of this paper deals with the experimental and numerical methods that have been used to study buffet. In a second part, aerodynamic data are compared and analyzed, in order to highlight some of the mechanisms related to buffet for a non-moving airfoil. In the last part of the paper, numerical simulations are conducted considering a moving airfoil, that dynamically responds to aerodynamic forces. Finally, some conclusions and perspectives are drawn.
2. Methods
2.1.
EXPERIMENTAL SETUP
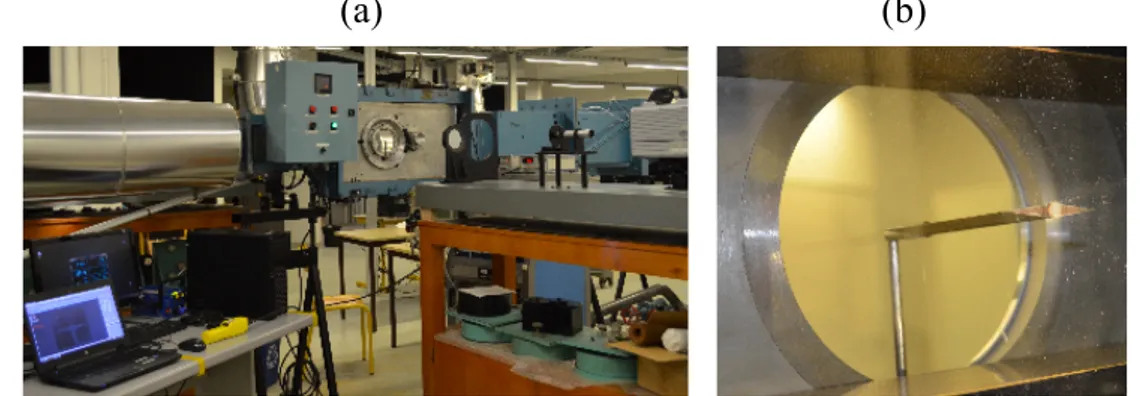
The ISAE-SUPAERO transonic wind tunnel has a 130mm-by-80-mm rectangular slotted test section, Fig. 3(a). It is powered by four vacuum pumps and provides flow Mach numbers ranging from 0.7±0.05 to 1.3±0.1. Here the Mach number is determined from the stagnation pressure Pi
and the test section static pressure P according to equation (1)), with Ma the Mach number and γ the heat capacity ratio,
" "#
= 1 +
'() *𝑀𝑎
* ( --./. (1)
Time-resolved Schlieren visualizations are recorded using a high speed Photron camera. Two sets of data can be recorded: 1) 704×512 pixels’ image with an acquisition frequency of 20,000 frames per second or 2) a 512×272 pixels’ image with an acquisition frequency of 50,000 frames per second. However, Schlieren technique intrinsically integrates 3D information into a 2D image.This complicates the analysis of the images when the flow naturally exhibits 3D structures, and is responsible for a hard-to-quantify inaccuracy
.
(a)
(b)
Figure 3. (a) View of the wind tunnel equipped with Schlieren test bench and (b) detailed
view of the aileron in the test section
The aileron dimensions are 80mm in span and 50mm in chord, with a symmetric diamond shape, Fig. 4. Its thickness is equal to 12% of the chord, corresponding to 6mm thick. Such dimensions, with the Mach numbers considered in this work, correspond to a Reynolds number of about 700,000. The mock-up is fixed on one of the transparent glass window of the wind tunnel test section, Fig. 3(b), on a rotating device allowing to change the angle of attack of the aileron. The 0° angle is determined on the basis of the Schlieren images revealing the symmetric distribution of the shock waves on both sides of the WT model. The accuracy of the aerodynamic angle is estimated at 0.5° via the post processing images of calibration targets. The angle of attack can be set from -2° to 2° by steps of 0.5°.
Figure 4. Schematic view and dimensions of the wind tunnel aileron
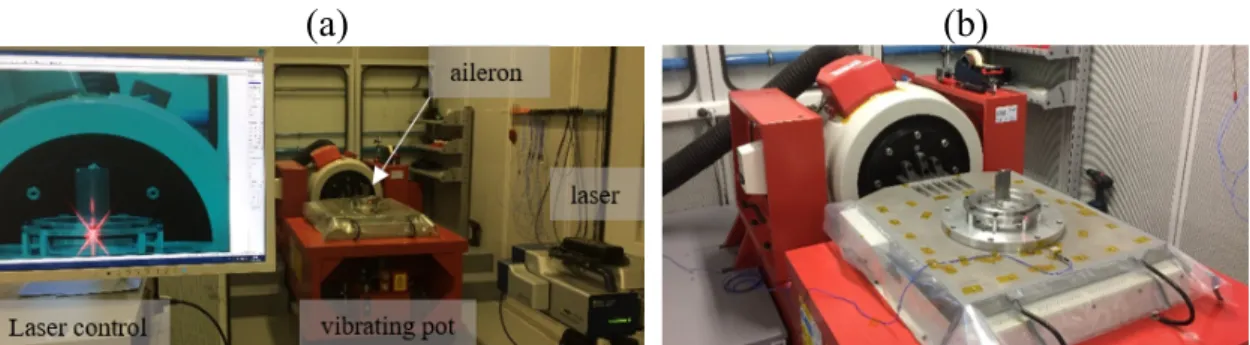
In order to determine the potential occurrence of a coupling between the characteristic frequencies of the flow (in particular with the oscillating shock waves) and a specific vibratory frequency of the aileron, a modal analysis is conducted on a vibrating pot (Figure 5). The setup of the aileron on the vibrating pot is chosen similar to its setup in the wind tunnel model, taking into account both the fixing beam of the aileron to the wind tunnel structure and the window in close contact with the aileron. The modal analysis shows three main natural frequencies 𝑓)= 196 𝐻𝑧, 𝑓*= 226 𝐻𝑧 and 𝑓6= 850 𝐻𝑧. The frequency f3 is associated with the fixation of the window to the
vibrating pot, f1 and f2 correspond to the two first flexion modes of the aileron.
The predicted aerodynamics frequencies are away of the above-mentioned structural frequencies, which ensures that i) the potential occurrence of pressure fluctuations on the surface of the aileron due to the buffeting phenomenon and to other flow unsteadinesses during the wind tunnel tests will not be induced or enhanced by the structural deformation of the aileron, ii) the aileron will not experience severe deformation promoted by the aerodynamic excitation and its coupling with the structural deformation of the model under resonant effects.
4
(a)
(b)
Figure 5. (a) Close view of the vibrating pot and (b) details of the laser scanner used for the
modal analysis
On the basis of the time-resolved Schlieren visualizations (Figure 6), a spectral analysis of the shock oscillation is proposed, based on a three-step process:
- A one pixel-height sensor line is selected in the shock oscillation area, - A time series of the grey level signal is then extracted,
-
The Power Spectral Density (PSD) of this signal is computed (if the signal is periodic).(a)
(b)
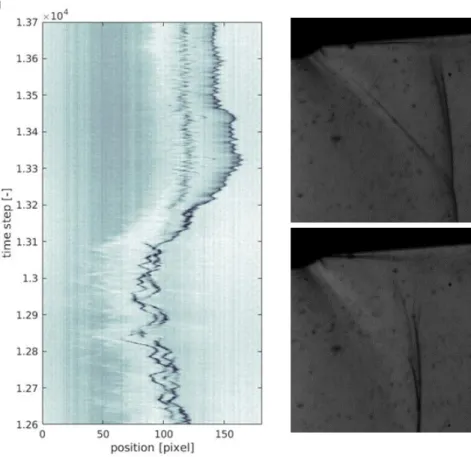
Figure 6. Description of the image processing-based frequency analysis, with (a) the selection
of a one pixel-height sensor line (grey level associated with the shock position on the image is observed as a function of the time) and (b) position of the shock with respect to the time.
2.2. NUMERICAL SETUP
This section presents the numerical analysis, led with unsteady Reynolds Averaged Navier Stokes (RANS) and Large Eddy Simulation (LES) approaches, considering the operating conditions of the wind tunnel (including wind tunnel walls). As the zone located downstream of the shock wave is subsonic, it is expected that perturbations generated in the boundary layer and in the close wake of the aileron travel upstream and impact the shock development in the zone of the lambda-shaped shock pedestal, especially as the expected buffeting results from an interaction between separated boundary layer and the shock wave.
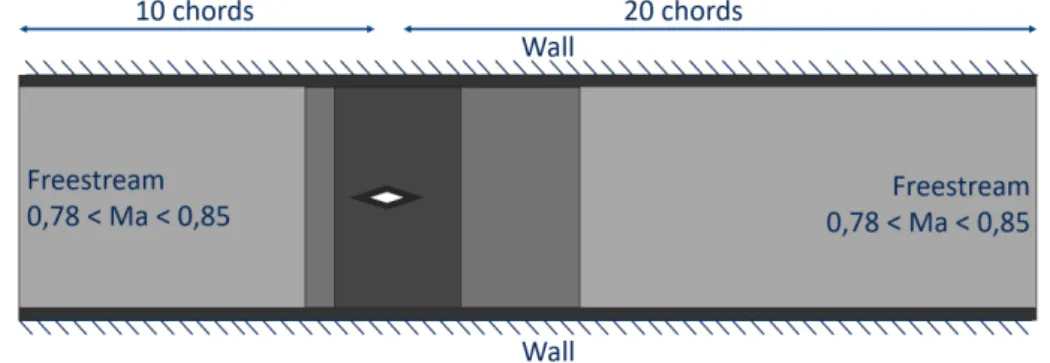
The numerical model used in the URANS approach is purely two dimensional, in order to reduce computational time effort, corresponding to the section of the aileron. The dimensions of the computational domain are similar to those of the wind tunnel test section (130mm high and 30 chords long). The center of the model is positioned 10 chords downstream of the inlet of the domain. For the LES computations, the 2D section of the actual wind tunnel model is extruded in the spanwise direction, with a span corresponding to 25% of the chord, in order to ensure uncorrelated turbulence.
The URANS simulations are performed using STAR-CCM+ v11.02. The k-ω SST-Menter turbulence model [12] is used for modeling the turbulence. A compressible solver is used with a second order Runge-Kutta scheme for the time discretization. The spatial discretization of the
convective fluxes is performed by a third-order MUSCL scheme. Regarding the grid, an unstructured polyhedral 2D mesh is generated with StarCCM+, based on prism layers close to the airfoil walls and polyhedral cells in the rest of the computational domain. The size of the mesh is highly refined close to the aileron surface, and in the zone where the shock waves are expected to develop. The prism layers were set on the aileron and wall surfaces to better capture the flow gradients in the boundary layer. The size of the first layer was chosen to impose y+<0.5 on the
aileron surfaces. A grid convergence study was performed, based on the evolution of both drag and lift coefficients, showing that a 1 Million cell mesh is sufficient to ensure convergence on the efforts while capturing the buffeting phenomenon.
As shown in Fig. 7, for URANS, the inlet and outlet flow conditions are modelled as freestream and the walls are considered as adiabatic with a no-slip condition. For LES, total pressure and temperature are imposed at the inlet, static pressure at the outlet, and walls are considered as adiabatic with a no-slip condition.
Figure 7. Schematic of the computational domain, mesh grid refinement as a function of grey levels and boundary conditions
LES computations are performed using the CharLESX solver [13], which solves the spatially filtered compressible Navier-Stokes equations using a finite volume formulation on unstructured hexahedral meshes. A fourth-order central scheme is used for the computation (2nd order on stretched volumes as in the present study). An explicit third-order Runge-Kutta (RK3) scheme is used for time integration with the Vreman subgrid-scale (SGS) model [14]. The approach relies on the combination of a dissipative centered numerical scheme and an essentially non-oscillatory (ENO) second-order shock-capturing scheme, with a shock sensor [13]. Two grid strategies have been considered. The first one relies on a wall-modelling approach, with y+≈15,
x+ ≈ 30 and z+ ≈ 50, leading to a 30 million cells grid. The second method relies on a wall resolved approach [15], with y+ ≈ 1, x+ ≈ 30 and z+ ≈ 20, that leads to a 120 million cells grid. Beyond the mesh size reduction, the main interest with the wall-modelling approach is the possibility to increase the time step by a factor of 10 in contrast to the wall resolved approach. Indeed, the cost ratio here between wall resolved and wall modelling approaches is around 40.
3. Analysis of results at wind tunnel conditions
The spectral analysis presented in section 2 is applied for the numerical data on the density gradient captures. Moreover, aerodynamic loads (drag and lift) are analyzed in order to highlight the link between loads and the position of shock waves, using Fast Fourier Transform (FFT). Shock wave and separated boundary layer oscillations are observed in both experimental and numerical simulations.
6
Figure 8. Schlieren visualizations at 2 distinct instants revealing the oscillations of the shock
associated with the buffeting: (a-b) measurements, (c-d) URANS and (e) LES.
The analysis of the Schlieren-based data shows an aperiodic three-dimensional, time-varying deformation of the shock wave in the spanwise direction, Figure 9.
A secondary oscillation of the shock wave is observed in both numerical and experimental data: the local boundary layer separation induces an oblique weak shock wave in front of the strong shock wave, resulting in a classical delta shaped pedestal. While the dominant frequency results from the interaction between the strong shock wave and the boundary layer separation, the secondary oblique shock wave also oscillates due to the local periodic flow separation in front of the strong shock wave.
An important observation is that experimental data exhibit a chaotic behavior, Fig. 10. Two states are alternatively distinguished: the “flag state” and the “delta state”. The flag state corresponds to a 3D shock, oscillating in the spanwise direction (as a wind-flapping flag). Due to the 2D spatial integration of the Schlieren technique, it cannot be confirmed if it is or not periodic. The delta state is a state where a sinusoidal oscillation of the shock is observed. In this state, both the oblique weak shock and the strong shock oscillate at the same frequency. For this state, the flow can reasonably be considered as two dimensional.
With an angle of attack (2 degrees), both flag and delta states are present. But contrary to a zero angle of attack, the scenario doesn’t switch alternatively from one state to the other state. The flag state is present on the suction side of the aileron and the delta state on the pressure side.
The frequency of the shock oscillation is evaluated to f=620 Hz (URANS) and f=310 Hz (LES) with the spectral analysis. However, the results should be considered with caution for LES due to the limited amount of time available. As mentioned, the analysis of the Schlieren-based data remains difficult due to the presence of a three-dimensional, time-varying deformation of the shock wave in the spanwise direction.
Figure 9. 3D supposed shock wave visualization on the aileron confronted to the 2D Schlieren
Figure 10. shock position signal (upper left image) illustrating delta (upper right schlieren
image) and flag (lower right image) states
However, the delta state is completely periodic, as revealed by the extraction of the shock wave displacement as a function of time on the Schlieren images, Fig. 11. An oscillating frequency of 4.7kHz is determined for the delta states. However, the oscillating phenomenon observed in numerical results differs from the experiment. More investigations have to be performed for a better understanding.
Figure 11. Temporal history of the shock state changes (4 corresponds to the delta state and 1 to
the flag state)
Figure 12(a-b) depicts the density standard deviation fields based on the LES and URANS computations. Figure 12(c) shows cumulated density gradient fields based on time resolved Schlieren images obtained in the wind tunnel. These two complementary post-processing
0 1 2 3 4 0 2000 4000 6000 8000 10000 12000 14000 fl ag/ de lt a st at e time step [-]
8
approaches provide similar information on the displacement amplitude of the shock wave experiencing the buffeting effect.
Figure 12. Shock magnitude oscillation for (a) LES, (b) URANS and (c) wind tunnel test
The magnitude of the shock wave oscillations varies depending on the method used (LES, URANS or wind tunnel tests). It is worth to mention that the angle of attack in the experimental setup is not exactly zero, as revealed by a non-strictly symmetric distribution of the shock wave footprint. Relatively to the wind tunnel results, the amplitude of the shock wave oscillations is better predicted with LES than with URANS. However, the mean position of the shock is better predicted with URANS than with LES. The shock position is greatly dependent on the boundary layer thickness on the lateral walls for a given Mach number, which is a difficult parameter to predict.
The aerodynamic loads are unsteady due to the shock oscillations, as shown in Figure 13. Indeed, the lift and drag oscillations are driven by the buffet phenomenon. The FFT in Figure 13 highlights a fundamental peak at 516 Hz and its harmonics. The Strouhal number, based on the upstream velocity and the chord, is equal to 0,089
.
The analysis of load signals is not straightforward. Interestingly, correlations between instantaneous flow fields and lift signals reveal that the instant at which the lift is null does not
Figure 13. aerodynamics efforts (left: lift, right: drag) as a function of time [s] (URANS results)
correspond to the instant where the shock waves are symmetric on both sides of the airfoil. This behavior is explained by the dynamics of the shock wave, which is different depending on its direction of displacement (upstream or downstream). This shock dynamic is thus associated with both lift and drag signals which are not sinusoidal, which in turn explains why the zero lift is not achieved when the positions of the shocks are symmetric. This analysis also shows that the drag frequency is twice the lift frequency.
The lift and drag predicted with the wall-resolved LES are shown in Figure 14. Only one period of the shock oscillation has been simulated at the moment, which is insufficient to fully analyzed the spectral content of the signal. However, these results highlight two main frequency: one low frequency associated to buffeting and one higher frequency, related to the oblique shock oscillation. The magnitude order in terms of lift and drag are similar to URANS predictions.
4. Analysis of results at real operating conditions
To complete the numerical simulations, a study has been performed at Reynolds condition close to the one encountered by the SERA rocket at real dimensions. The URANS approach is used with the same methodology, as previously described. The 2D geometry considered here is based on a slice of the real aileron, at mid-span of the real swept aileron. At this location, the chord of the airfoil is 200mm and the relative thickness is 12% of the chord, Fig. 15.
The numerical simulations are performed for several Mach numbers so that the transonic range is entirely covered, from Ma = 0.77 to Ma = 0.83. Figure 15 depicts three instants of the simulation which allows to identify buffeting thanks to the shock wave and the boundary layer oscillations.
Figure 14. Aerodynamics loads (left: lift, right: drag) as a function of time [s] (LES results)
Figure 15. Instantaneous flow fields colored with Mach number, at three different instants of the
10
Buffeting is observed for Mach numbers ranging from 0.78 to 0.81. As illustrated in Figure 16, the normalized frequency of buffeting is constant, corresponding to a Strouhal number (based on upstream velocity and axial chord) of 0.083, which is still very close to the Strouhal number reported for the 1:4th scaled model-based URANS computations. The amplitude of oscillations
increases as a function of the Mach number.
5. Fluid-structure interaction: impact of buffeting on aileron
The objective is now to study the effect of aerodynamic forces on the dynamic response of the profile. As a first approximation, only rigid movements of the aileron are considered, such as bending and torsion, as shown in Fig. 17(a). The 3D aileron is reduced to its 2D extruded shape. The bending is modeled by a pure vertical translation in the plane while the torsion is modeled by a rotation in the plane, as in Fig. 17(b).
(a) (b)
Figure 17. Example of the (a) aileron deformation (bending and torsion) and (b) 2D modelling
The aileron is made of a sandwich composite material. The core is an epoxy foam and the skin is a carbon laminate. The aileron is considered as a beam with a thin web cross section. Moments of inertia are then calculated geometrically, for a diamond cross section of diagonals equal to 220mm and 12.5 mm, with a 1 mm thick web corresponding to the laminate skin. The Young’s
modulus E and the shear modulus G are material properties, determined by the Classical Laminate Theory [17]. The stiffness results are presented in Table 1.
𝐾 𝑓 [𝐻𝑧]
Flexion 1373 N/m 13,2
Torsion 346 Nm 55,1
Table 1 : Estimation of the stiffness of the real aileron
The dynamic response of the aileron is driven by the fundamental equation of dynamics. The ideal solution is to simulate the solid displacement in a fully coupled way with the flow. However, the large difference between the characteristic times of the fluid and the solid makes this approach impracticable in the present case. The method relies thus on a separation between the numerical simulation of the flow and the resolution of the aileron dynamics. As a first step, only flapping is considered, that is driven by:
(2) with M is the matrix of mass, D is the matrix of damping, K is the matrix of stiffness and FA are
the aerodynamic forces. In order to simplify the problem, an equivalent homogeneous material is considered, so matrices are reduced to a scalar.
This equation is time marched by means of a classical four steps Runge-Kutta scheme. At each time step, the aerodynamic forces are composed of two components: one related to the phenomenon of buffet and one due to the reaction of the aerodynamic force, induced by the profile displacement. The buffet force is extracted from the numerical simulations (URANS and LES database) and the aerodynamic response is modelled. Due to the low thickness of the profile, and the fact that displacement velocity is small compared to the fluid velocity, the lift force is modelled using the thin profile theory, with a compressibility correction [18]:
(3)
The angle of the flow seen by the profile at each instant of time is estimated as
(4)
Since the flow is responding in phase with the solid, the aerodynamic response is a positive damping term in the equation of the dynamic, Eq. (2). The main limitation of this approach is that the aerodynamic response to the profile displacement is instantaneous, while a lag is observed in practice. For this reason, this method is valid only when the ratio between the flow velocity and the displacement velocity of the solid is large (so the time lag becomes negligible). The results are expressed in terms of non-dimensional parameters U*, representing the ratio between the fluid
velocity and the displacement velocity of the solid and m*, representing the mass ratio between
the solid and the fluid:
U
⇤=
U
1 1 2⇡q
k m.C
F
lif t=
2⇡(↵
↵
0)
p
1
M
2⇥
1
2
⇢
1U
2 1.S
M ¨
x + D ˙x + Kx =
X
F
Atan(↵) =
˙x
U
1m
⇤=
m
⇢SL
12
with k the stiffness, C the chord of the aileron and m the mass of the solid. In the case of the aileron at real dimensions, the value of the normalized velocity U* is estimated to be close to 100.
Two cases are considered: without aerodynamic coupling (only the force coming from buffet is applied) and with coupling (aerodynamic response of the profile is added). The evolution of the normalized displacement, y*=y/C, with respect to the normalized velocity U* is represented in
Fig. 18(a) (using URANS data) and Fig. 18(b) (using LES data), for a large mass ratio parameter
m*=1600.
(a) (b)
Figure 18. Evolution of the maximal displacement and maximal velocity displacement, with
respect to the parameter U*: (a) URANS and (b) LES (m*=1600)
In Fig. 18(a), the peak close to U*=10 corresponds to the resonance between the natural frequency
of the solid and the aerodynamic excitation (buffet). In the case of LES, the buffet is associated to a more complex signal in term of spectral content, so two frequencies of resonance are shown in Fig. 18(b). In the uncoupled case, the maximum displacement increased with U* (corresponding
to a reduction of the stiffness). In the coupled case, as expected, the aerodynamic forces act as a damping term, which reduced the amplitude of the displacement, especially at the resonance frequency. A plateau is also reached for value of U* higher than 500. At such velocity ratios, the
periodic excitation due to buffet is no longer seen by the solid (since the time-average force of buffet is null, the solid does not react to this phenomenon). The effect of buffet predicted by LES has a weaker effect on the solid displacement compared to URANS.
Two normalized masses are compared: m*=80 (light hollow aileron) and m*=1600 (heavy plain
aileron). The previous conclusions are globally unchanged with the lower mass ratio parameter (m*=80), as shown in Fig. 19. However, as expected, the maximum displacement is increased
(especially at low to moderate values of U*) and a smoothening of the resonance peak, due to an
increase of the aerodynamic damping (velocity displacement of the solid is increased compared to m*=1600, and so the value of the flow angle is also increased). In all cases, the value of the
angle stays below 7-8 degrees, which is still acceptable for the thin profile theory.
6. Conclusions
Both experimental and numerical investigations have been performed to understand the buffeting phenomenon and its impact on a composite aileron. This study can be summarized by the following points:
- First, buffeting appears at transonic speed on a diamond aileron at zero angle of attack, as verified with both numerical simulation and measurements,
- Experimental approach reveals a 3D oscillation of the shock, but at this step there is no clear evidence of the physical phenomena promoting this 3D mode,
- LES identifies an oscillation of the width of the shock foot (λ-width) which has a significant impact on the aerodynamics load, but this phenomenon is not seen with the URANS simulation, - at last, the experiments highlighted a chaotic behavior of the shock wave that shifts from an oscillatory periodic state (delta state) to an erratic 3D flapping state (flag state), transiently separated by transition states, where the shock moves from a close-to-trailing edge position (delta state) to a close-to-dihedron position (flag state).
The results reported in this paper still highlight a lack of deciphering of the buffeting origin. A 3D numerical simulation (both URANS and LES) should be conducted in order to better understand the spanwise oscillation of the shock observed experimentally. More information from the wind tunnel is also needed. The use of unsteady pressure sensors on the aileron will provide a more accurate validation of the numerical simulations in the future. Fluid/Structure interaction has been investigated, considering only the bending mode. The effect of torsion should now be investigated since it should have more impact on the flow due to the increase of incidence that amplifies buffeting effects. A provision for future work will also consist in using a time-dependent stiffness, in order to represent the influence of progressive damages of unsteady loads on the aileron (fatigue mode).
Figure 19. Influence of the mass ratio parameter on the displacement and displacement velocity
at U*=100 (URANS data)
Acknowledgements
This work is partially funded by the French Space Agency (CNES), this support is greatly acknowledged. The authors particularly thank Jean Oswald and Florent Puel from DLA (Direction des LAnceurs) at CNES for their help on this study. The experimental campaign was conducted with the technical team of ISAE-Supaero (special thanks to Emmanuel Rivet, Patrick Cheze and Marc Grellet). The simulations performed were achieved using CALMIP computing means, under project p1425 and GENCI A0042A07178.
14
References
1. AH. Pearcey, K. Rao, The interaction between local effect at the shock and rear separation
– a source of a significant scale effects in wind-tunnel tests on airfoils and wings, Technical
report, AGARD, 1968.
2. J. Tijdeman, Investigations of the transonic flow around oscillating airfoils, Technical report, NLR, Rapport Technique NLR TR 77090 U, 1977
3. B.H.K. Lee, Self-sustained shock oscillations on airfoils at transonic speeds, Progress in Aerospace Sciences, 37:147-196, 2001
4. J.B. Mc Devitt and A.F. Okuno, Static and dynamic pressure measurements on a NACA0012
airfoil at AMES high Reynolds number facility, Technical report, NASA, technical paper
2485, 1985
5. L. Jacquin, P. Molton, S. Deck, B. Maury, and D. Soulevant. Experimental Study of Shock
Oscillation over a Transonic Supercritical Profile, AIAA J., 47(9), pp. 1985-1994, 2009
6. M. Thiery and E. Coustols. Numerical Prediction of Shock Induced Oscillations over a 2D
Airfoil: Influence of Turbulence Modelling and Test Section Walls, Int. J. Heat Fluid Flow, 27
(661), 2006
7. Renaud T., Corre C. and Lerat A., Efficient numerical simulation of buffet for airfoils in
transonic regime, IFASD 2001, Madrid, June 2001
8. Brunet V. and Deck S. Zonal-Detached Eddy Simulation of Transonic Buffet on a Civil
Aircraft Type Configuration. In Advances in Hybrid RANS-LES Modelling. Notes on
Numerical Fluid Mechanics and Multidisciplinary Design, 97. Springer, Berlin, Heidelberg, 2008
9. Corre C., Renaud T., Lerat A. Transonic Flow Control Using a Navier-Stokes Solver and a
Multi-Objective Genetic Algorithm. In: Sobieczky H. (eds) IUTAM Symposium
Transsonicum IV. Fluid Mechanics and its Applications, vol 73. Springer, Dordrecht, 2003 10. D., Caruana, A. Mignosi and M. Corrège M. Buffet and buffeting control in transonic
flow. Aerosp. Sci. Technol. 9(7), 605–616, 2005
11. C. Gao, W. Zhang, J. Kou, Y. Liu and Z. Ye. Active control of transonic buffet flow, J. of
Fluid Mechanics, 824, pp. 312-351, 2017
12. F. R. Menter, Two-Equation Eddy-Viscosity Turbulence Models for Engineering
Applications, AIAA J., vol. 32, no 8. pp. 1598-1605, 1994
13. Bermejo-Moreno, I., Bodart, J., Larsson, J., Barney, B. M., Nichols, J. W. and Jones, S.
Solving the compressible Navier-Stokes equations on up to 1.97 million cores and 4.1 trillion grid points. High-Performance Computing, Networking, Storage and Analysis, 2013
14. A.W. Vreman, An eddy-viscosity subgrid-scale model for turbulent shear flow: Algebraic
theory and applications. Phys. Fl. 16 (10), 3670-81, DV, USA, 2004
15. Kawai. S. and Larsson, J. Wall modeling in large eddy simulation: length scales, grid
resolution and accuracy. Phys. Fluids 24, 15105, 2012
16. D. Ziviani, A. Suman, J. Gabrielloni, M. Pinelli, M. De Paepe, and M. van den Broek. CFD
Approaches Applied to a Single-screw Expander, 23rd International Compressor
Engineering Conference at Purdue, 2016
17. J.-M. Berthelot, Matériaux composites, « comportement mécanique et analyse des
structures », Editions TEC & DOC, 5ème édition, 2012