1 © The Author(s) 2019. Published by Oxford University Press on behalf of Entomological Society of America. All rights reserved.
For permissions, please e-mail: journals.permissions@oup.com.
Sampling and Biostatistics
Conventional Sampling Plan for Scouting Neoleucinodes
elegantalis (Lepidoptera: Crambidae) Eggs on
Tomato Fruits
Ézio M. Silva,
1André L. B. Crespo,
2Elizeu S. Farias,
3,6,Leandro Bacci,
4Renan B.
Queiroz,
5and Marcelo C. Picanço
31Instituto de Ciências Agrárias, Universidade Federal de Viçosa, Rio Paranaíba, MG, 38810-000, Brazil, 2Corteva Agriscience™, Agricultural Division of DowDuPont, Johnston, IA 50131, 3Departamento de Entomologia, Universidade Federal de Viçosa, Viçosa, MG 36570‐900, Brazil, 4Departamento de Engenharia Agronômica, Universidade Federal de Sergipe, São Cristóvão, SE 49100-000, Brazil, 5Instituto Capixaba de Pesquisa, Assistência Técnica e Extensão Rural (Incaper), Vitória, ES 29052-010, Brazil, and 6Corresponding author, e-mail: elizeu.farias@ufv.br, elizeusf21@gmail.com
Subject Editor: Arash Rashed
Received 27 February 2019; Editorial decision 11 May 2019
Abstract
The small tomato borer, Neoleucinodes elegantalis (Guenée), is an important pest of tomato (Solanum
lycopersicum L.) in South and Central America. This pest is a potential threat for many tomato-producing
areas and was listed in 2014 as an A1 quarantine pest by the European and Mediterranean Plant Protection Organization. Soon after hatching, the neonate N. elegantalis larvae penetrate the fruits where they feed until pupation. Therefore, effective N. elegantalis management relies on the timely scouting of egg densities to allow decision-making prior to penetration of neonates into fruits. This study aimed to develop a conventional sam-pling plan for scouting N. elegantalis eggs on tomato plants. The most representative and precise samsam-pling unit was the most basal fruit cluster for plants bearing up to three clusters (S1 plants). For plants with more than three fruit clusters (S2 plants), the most representative and precise sampling unit was the combination of the second and third fruit clusters. Among the four variables evaluated (eggs/fruit, egg masses/fruit, per-centage fruit with eggs, and perper-centage clusters with eggs), the perper-centage of clusters with eggs was the most economical for N. elegantalis sampling based on the number of samples and cost required. For this variable, the number of samples determined at the 25% error level was 42 and 36 samples for S1 and S2 plants, respect-ively. The sampling plan developed for scouting N. elegantalis is fast, reflects pest infestation in tomato fields, and costs less than US$1.50 per field scouted.
Key words: decision-making, Crambidae, Lepidoptera, sampling, small tomato borer
The small tomato borer, Neoleucinodes elegantalis (Guenée), is one of the major pests of solanaceous crops in South and Central America (Marcano 1991, Díaz-Montilla et al. 2013, Noboa et al. 2017). Native to South America, N. elegantalis was listed as an A1 quarantine pest by the European and Mediterranean Plant Protection Organization in 2014, indicating that the pest is absent from the EPPO region (EPPO 2015). This pest is considered a great threat for many tomato producing areas, especially under warm and humid conditions (Silva et al. 2017, 2018a).
The damage by N. elegantalis occurs when larvae burrow into the fruits, making them unmarketable. In addition, N. elegantalis attacks contribute to the incidence of phytopathogenic bacteria (Picanço et al. 2007). In tomato fields, up to 77% of fruit damage has been reported to be by the tomato borer (Picanço et al. 1998).
Neoleucinodes elegantalis eggs are usually laid (individually or in
egg masses) on younger fruits (Marcano 1991, Blackmer et al. 2001). Soon after hatching, the neonate larvae penetrate the fruits where they feed until pupation (Marcano 1991). The entry point of the larvae is a small scar, and since virtually the entire larval develop-ment occurs inside the fruits, the detection and managedevelop-ment of this pest are extremely challenging (Silva et al. 2018b).
Successful N. elegantalis management should rely on the correct choice and timing of management practices to target the neonates before they penetrate the fruits (EPPO 2015). Insecticide spraying or parasitoid release are ineffective at reducing damage by the bur-rowing larvae (Picanço et al. 2007), which makes N. elegantalis scouting very important. The monitoring of N elegantalis through the assessment of adult or egg densities allows decision-making
Journal of Economic Entomology, XX(XX), 2019, 1–8
doi: 10.1093/jee/toz158 Research
and choice of management practices prior to the neonates’ entrance into fruits. Traps baited with sex pheromone have been applied for monitoring adult N. elegantalis (Salas et al. 1992, Badji et al. 2003). However, the use of sex pheromone has inherent limitations, starting with the associated cost. Additionally, the use of this monitoring technique requires establishing a relationship between the number of males captured and the pest attack. Correlations between these two variables have been shown to be statistically significant, but not always strong (Benvenga et al. 2010). Another limitation is the commercial pheromone composition, that may not work depending on the distribution of N. elegantalis biotypes in the region ( Díaz-Montilla et al. 2017).
Conventional sampling plans have been established for the scouting of various pests and can address many of the limitations mentioned. In conventional plans, pest densities are assessed through visual inspections, using or not devices such as hand lens or beating trays (Rosado et al. 2014, Lima et al. 2017, Pinto et al. 2017). Conventional sampling plans are also useful in determining eco-nomic injury levels and validating sequential sampling plans (Bacci et al. 2008, Rosado et al. 2014, Pereira et al. 2017). In the develop-ment of conventional plans, the statistical distribution of data, rep-resentativeness, precision, and cost are considered to allow accurate and cost-effective decision-making (Pedigo and Rice 2014). A con-ventional plan is composed of a sampling unit, a sampling variable, and a fixed number of samples determined at a previously estab-lished precision.
Decision-making is a crucial aspect of current integrated pest management (IPM) programs. In order to provide means for timely management of N. elegantalis laying eggs on tomato fruits, this study had the objective of developing a sampling plan for scouting
N. elegantalis eggs.
Materials and Methods
General Conditions
This research was carried out in commercial tomato fields (Débora Max hybrid) located in Coimbra (20°51′24″S, 42°48′10″W, alti-tude 720 m, and tropical climate), Minas Gerais State, Brazil. The climate of the study region corresponds to the Köppen class Cwb (Peel et al. 2007), with rainy summers and dry winters. The average annual temperature is 19.4°C, ranging between 13 and 30°C. The mean annual rainfall is 1,170 mm with rains predominantly between October and March (INMET 2019). Twenty fields with an average area of 0.86 ha were evaluated. Tomato plants were spaced 0.5 × 1.0 m and staked in the inverted ‘V’ system. Sprinkler irrigation was performed three times per week and fertilization followed local prac-tices (Silva and Vale 2007).
Sampling Unit
In order to determine the sampling unit for N. elegantalis scouting, representativeness and precision criteria were used (Gusmão et al. 2005, Rosado et al. 2014). At least 30 plants were evaluated in each field. The number of fruits with eggs (NFE) was assessed for each fruit cluster and for the units formed by the sequential combination of the clusters (containing two, three, four, five, and six fruit clus-ters), hereafter referred to as units. During the assessments, the first fruit cluster was considered as being the most apical in plants pre-senting at least one fruit with ≥0.5 cm in diameter.
First, correlation analyses were performed between the relative densities of each unit and the total NFE in a plant. When a positive and significant correlation (P < 0.05) existed for NFE in a unit, that
was considered the sampling unit. When more than one unit exhib-ited significant correlation, relative densities of those units were re-gressed on total NFE, and the sampling unit was the one presenting the steepest slope at P < 0.05. Difference among slopes in the regres-sion analysis was verified by the confidence interval at 95% prob-ability. Correlation and regression analyses were performed using PROC CORR and PROC REG (SAS 9.2, SAS Institute, Cary, NC). Assumptions of normality and homoscedasticity were checked using PROC UNIVARIATE and PROC GLM (SAS 9.2).
The relative variance (RV, %), used to determine the accuracy of the units, was calculated using formula 1:
RV = 100 ×SEM
¯
x
(1) where SEM is the SE of NFE in a given unit (cluster or combination of clusters) and x is the mean NFE of this unit.
Units with RV ≤ 25% were selected since this is the maximum error value allowed to generate feasible plans (Southwood and Henderson 2000, Bacci et al. 2008).
After performing the correlation and regression analyses and calculating the RV, more than one unit could still be meeting the representativeness and precision criteria. Therefore, the frequency at which each unit was selected was calculated. The ideal sampling unit was the most frequent, considering both the number of clusters/plant and clusters/unit.
Number of Samples
Frequency Distribution
The following variables were evaluated in tomato plants: eggs/fruit, egg masses/fruit, percentage fruit with eggs, and percentage clusters with eggs.
Means and standard errors were calculated for the characteris-tics evaluated for both plants bearing up to three clusters (stage 1, S1) and with more than three clusters (stage 2, S2). Analyses were performed to assess the fitting of the variable data to the frequency-distribution models (Poisson, negative binomial, and positive bi-nomial). The χ2 adherence test was used to compare observed and expected frequencies for each distribution. Nonsignificant differ-ences (P > 0.05) indicate that data fit the frequency distribution (Bliss and Owen 1958, Young and Young 1998). This preliminary analysis allows, based on the frequency distribution of the data, the determination of the formula for calculating the number of samples.
When the variable (eggs/fruit, egg masses/fruit, percentage fruit with eggs, and percentage clusters with eggs) fit the negative bino-mial distribution, the partial K-values (Kp, referred to as the aggre-gation index for each tomato field) was calculated using formula 2:
Kp= ¯x2/(S2− ¯x)
(2) where x and S2 are the mean and variance for each variable.
The Kp value for each field was subjected to linear regression ana-lysis to verify the existence of a common aggregation parameter (Kc) that represents all tomato fields. The fields are considered to have a
Kc when the analysis provides a significant slope and a nonsignificant intercept (Bliss and Owen 1958). The Kc parameter was used to cal-culate the number of samples (NS), according to formula 3 (Young and Young 1998, Moura et al. 2007):
NS = 1 C2× Å1 ¯ x+ 1c Kc ã (3) where C is the maximum allowed error (0.25), and x is the mean for each variable.
When the characteristics of the data fit the Poisson distribution, the following formula was applied to calculate NS:
NS = 1
C2× ¯x
(4) where C is the maximum allowed error (0.25), and x is the mean for each variable.
Finally, if the data of a given variable did not fit any of the tested distributions, NS was calculated using the following formula:
NS = ï t × S C × ¯x ò2 (5) where t is the value of the Student t-test at the 5% level, C is the maximum error allowed; and x and S are the mean and SD, respect-ively, for each variable.
Sampling Variable
Based on the number of samples determined for each variable, to-mato fields (10 fields with S1 plants and 10 with S2 plants) were evaluated. The mean time to scout the tomato plants, considering each variable, was recorded. The scouting time included the time spent walking between scouting points, counting, and recording the
results. The mean cost of scouting was calculated considering the salary plus social charges of two rural workers and the sampling material (paper, pencil, eraser, and drawing board). Then, the mean time and cost data were subjected to analysis of variance followed by Tukey’s HSD test at the 5% probability (R Core Team 2013). The ideal variable was the one requiring the shortest scouting time and cost (Pedigo and Rice 2014).
Number of Samples Against Prediction Error
After determining the best variable to compose the N. elegantalis sampling plan, the number of samples needed for this variable (based on the frequency distribution determined in Frequency Distribution section) was regressed against error levels (0.05, 0.10, 0.15, 0.20, and 0.25) using PROC REG (SAS 9.2). The final number of samples was determined for the error level at which the curve stabilized.
Results
Sampling Unit
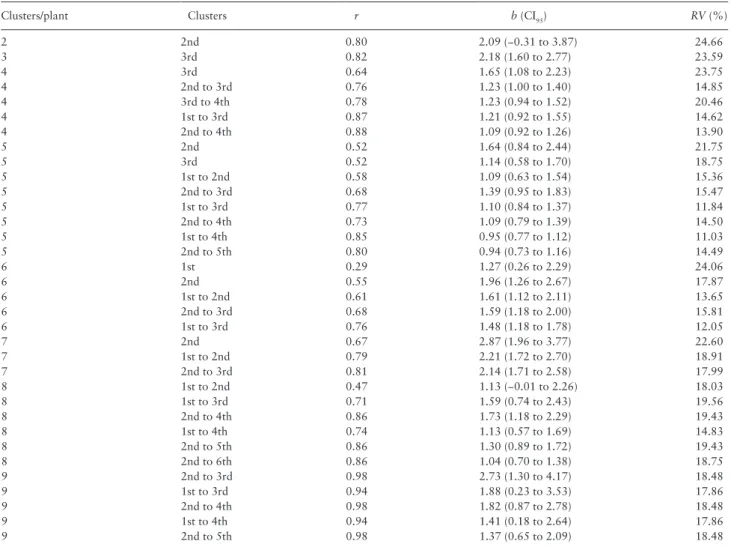
Based on the criteria of representativeness by correlation and re-gression analyses, and precision using the relative variance ≤25%, Table 1. Pearson’s correlation coefficient (r) and slope of the linear regression (b) between the relative and absolute densities of N. elegantalis (eggs/fruit) in sampling units formed by tomato fruit clusters and their combination.
Clusters/plant Clusters r b (CI95) RV (%)
2 2nd 0.80 2.09 (−0.31 to 3.87) 24.66 3 3rd 0.82 2.18 (1.60 to 2.77) 23.59 4 3rd 0.64 1.65 (1.08 to 2.23) 23.75 4 2nd to 3rd 0.76 1.23 (1.00 to 1.40) 14.85 4 3rd to 4th 0.78 1.23 (0.94 to 1.52) 20.46 4 1st to 3rd 0.87 1.21 (0.92 to 1.55) 14.62 4 2nd to 4th 0.88 1.09 (0.92 to 1.26) 13.90 5 2nd 0.52 1.64 (0.84 to 2.44) 21.75 5 3rd 0.52 1.14 (0.58 to 1.70) 18.75 5 1st to 2nd 0.58 1.09 (0.63 to 1.54) 15.36 5 2nd to 3rd 0.68 1.39 (0.95 to 1.83) 15.47 5 1st to 3rd 0.77 1.10 (0.84 to 1.37) 11.84 5 2nd to 4th 0.73 1.09 (0.79 to 1.39) 14.50 5 1st to 4th 0.85 0.95 (0.77 to 1.12) 11.03 5 2nd to 5th 0.80 0.94 (0.73 to 1.16) 14.49 6 1st 0.29 1.27 (0.26 to 2.29) 24.06 6 2nd 0.55 1.96 (1.26 to 2.67) 17.87 6 1st to 2nd 0.61 1.61 (1.12 to 2.11) 13.65 6 2nd to 3rd 0.68 1.59 (1.18 to 2.00) 15.81 6 1st to 3rd 0.76 1.48 (1.18 to 1.78) 12.05 7 2nd 0.67 2.87 (1.96 to 3.77) 22.60 7 1st to 2nd 0.79 2.21 (1.72 to 2.70) 18.91 7 2nd to 3rd 0.81 2.14 (1.71 to 2.58) 17.99 8 1st to 2nd 0.47 1.13 (−0.01 to 2.26) 18.03 8 1st to 3rd 0.71 1.59 (0.74 to 2.43) 19.56 8 2nd to 4th 0.86 1.73 (1.18 to 2.29) 19.43 8 1st to 4th 0.74 1.13 (0.57 to 1.69) 14.83 8 2nd to 5th 0.86 1.30 (0.89 to 1.72) 19.43 8 2nd to 6th 0.86 1.04 (0.70 to 1.38) 18.75 9 2nd to 3rd 0.98 2.73 (1.30 to 4.17) 18.48 9 1st to 3rd 0.94 1.88 (0.23 to 3.53) 17.86 9 2nd to 4th 0.98 1.82 (0.87 to 2.78) 18.48 9 1st to 4th 0.94 1.41 (0.18 to 2.64) 17.86 9 2nd to 5th 0.98 1.37 (0.65 to 2.09) 18.48
Relative variance (RV) was also used to select the most precise and representative sampling unit. A more comprehensive table is provided in Supp Table 1 (on-line only).
CI95 = CIs at 5% level.
the following sampling units were selected: plants bearing up to three clusters (most basal cluster); plants with four clusters (second to third, third, third to fourth, first to third, and second to fourth cluster); plants with five clusters (second, third, first to second, second to third, first to third, second to fourth, first to fourth, and second to fifth cluster); plants with six clusters (first, second, first to second, second to third, and first to third cluster); plants with
seven clusters (second, first to second, and second to third cluster); plants with eight clusters (first to second, first to third, second to fourth, first to fourth, second to fifth, and second to sixth cluster); plants with nine clusters (second to third, first to third, second to fourth, first to fourth, and second to fifth cluster) (Table 1). The sam-pling unit of N. elegantalis eggs in S1 plants was the last cluster, with 100% occurrence. For S2 plants the most representative and Table 2. Frequency at which fruit clusters and their combinations were selected as N. elegantalis sampling units based on the criteria of
representativeness (correlation and regression analyses) and precision (relative variance) in S1 and S2 plants Plants bearing up to three clusters (S1 plants)
Unit Clusters/plant Frequency
2 3
Most basal cluster x x 2/2 = 1.00
Plants with more than three clusters (S2 plants)
Unit (cluster) Clusters/plant Frequency
4 5 6 7 8 9 1st x 1/6 = 0.17 2nd x x x 3/6 = 0.50 3rd x x 2/6 = 0.34 1st to 2nd x x x x 4/6 = 0.67 2nd to 3rd x x x x x 5/6 = 0.83 3rd to 4th x x 1/6 = 0.17 1st to 3rd x x x x x 5/6 = 0.83 2nd to 4th x x x x 4/6 = 0.67 1st to 4th x x x 3/6 = 0.50 2nd to 5th x x x 3/6 = 0.50 2nd to 6th x 1/6 = 0.17
One ‘x’ indicates that the given unit was selected considering the mentioned criteria. The frequency represents the number of times that the unit was selected out of the number of possibilities.
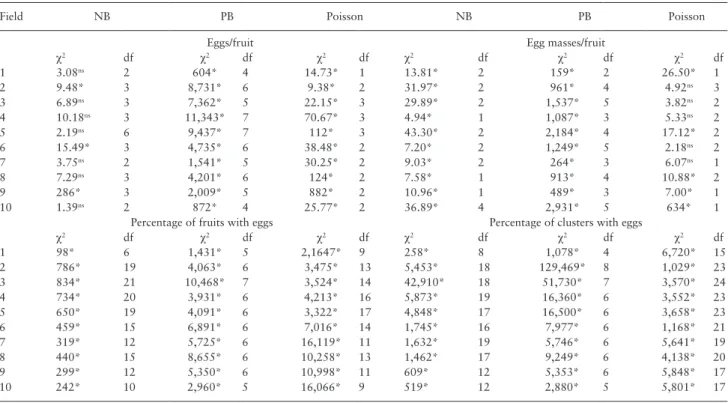
Table 3. Chi-square adherence test by the expected negative binomial (NB), positive binomial (PB), and Poisson distributions of
N. elegantalis sampling data obtained in tomato fields bearing up to three clusters (S1 plants)
Field NB PB Poisson NB PB Poisson
Eggs/fruit Egg masses/fruit
χ2 df χ2 df χ2 df χ2 df χ2 df χ2 df 1 3.08ns 2 604* 4 14.73* 1 13.81* 2 159* 2 26.50* 1 2 9.48* 3 8,731* 6 9.38* 2 31.97* 2 961* 4 4.92ns 3 3 6.89ns 3 7,362* 5 22.15* 3 29.89* 2 1,537* 5 3.82ns 2 4 10.18ns 3 11,343* 7 70.67* 3 4.94* 1 1,087* 3 5.33ns 2 5 2.19ns 6 9,437* 7 112* 3 43.30* 2 2,184* 4 17.12* 2 6 15.49* 3 4,735* 6 38.48* 2 7.20* 2 1,249* 5 2.18ns 2 7 3.75ns 2 1,541* 5 30.25* 2 9.03* 2 264* 3 6.07ns 1 8 7.29ns 3 4,201* 6 124* 2 7.58* 1 913* 4 10.88* 2 9 286* 3 2,009* 5 882* 2 10.96* 1 489* 3 7.00* 1 10 1.39ns 2 872* 4 25.77* 2 36.89* 4 2,931* 5 634* 1
Percentage of fruits with eggs Percentage of clusters with eggs
χ2 df χ2 df χ2 df χ2 df χ2 df χ2 df 1 98* 6 1,431* 5 2,1647* 9 258* 8 1,078* 4 6,720* 15 2 786* 19 4,063* 6 3,475* 13 5,453* 18 129,469* 8 1,029* 23 3 834* 21 10,468* 7 3,524* 14 42,910* 18 51,730* 7 3,570* 24 4 734* 20 3,931* 6 4,213* 16 5,873* 19 16,360* 6 3,552* 23 5 650* 19 4,091* 6 3,322* 17 4,848* 17 16,500* 6 3,658* 23 6 459* 15 6,891* 6 7,016* 14 1,745* 16 7,977* 6 1,168* 21 7 319* 12 5,725* 6 16,119* 11 1,632* 19 5,746* 6 5,641* 19 8 440* 15 8,655* 6 10,258* 13 1,462* 17 9,249* 6 4,138* 20 9 299* 12 5,350* 6 10,998* 11 609* 12 5,353* 6 5,848* 17 10 242* 10 2,960* 5 16,066* 9 519* 12 2,880* 5 5,801* 17
Four variables (eggs/fruit, egg masses/fruit, percentage fruit with eggs, and percentage of clusters with eggs) were assessed in ten fields. χ2, χ2-test value; df, degrees of freedom; ns, nonsignificant at the 5% level.
* significant at the 5% level.
accurate units were those formed by the second to third clusters and first to third clusters, with 83% occurrence (Table 2). Since scouting two clusters is quicker than scouting three, the ideal sampling unit for S2 plants was identified as the combination of the second and third clusters.
Number of Samples
Frequency Distribution
For S1 plants, the number of N. elegantalis eggs/fruit fits the nega-tive binomial distribution in 7 out of 10 fields. Data on egg masses/ fruit fit the Poisson distribution in 5 of the 10 fields. Conversely, percentage of fruit with eggs and percentage of clusters with eggs did not fit any frequency distribution tested (Table 3). For the number of eggs/fruit data in S1 plants, the regression analysis between the aggregation parameter of each field (Kp) and the common aggrega-tion parameter (Kc) provided a significant slope and a non-significant intercept (P > 0.05). The Kc value was 0.58 (Supp Table 2 [online only]).
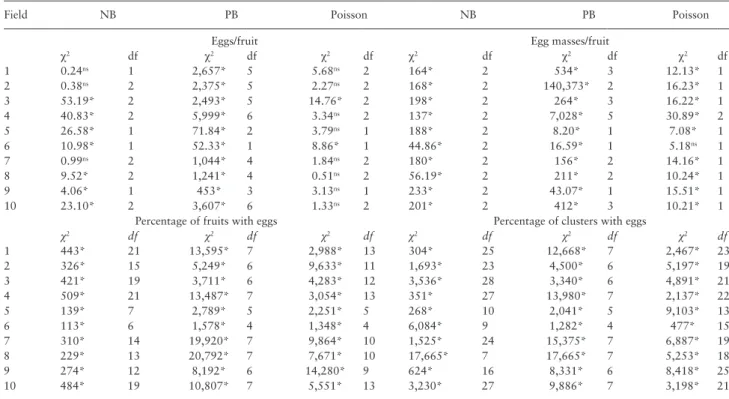
For S2 plants, the data on number of N. elegantalis eggs/fruit fit the Poisson distribution in 8 of the 10 fields. Conversely, data on number of egg masses/fruit, percentage of fruits with eggs, and per-centage of clusters with eggs did not fit any frequency distribution tested (Table 4).
Sampling Variable
There were differences in both time and cost of N. elegantalis sam-pling in S1 (time: F3,36 = 4.74, P = 0.007, cost: F3,36 = 4.37, P = 0.010) and S2 plants (time: F3,36 = 3.40, P = 0.028, cost: F3,36 = 3.58,
P = 0.023). The assessment of the percentage of clusters with eggs
presented the lowest time and cost for both plant stages considered
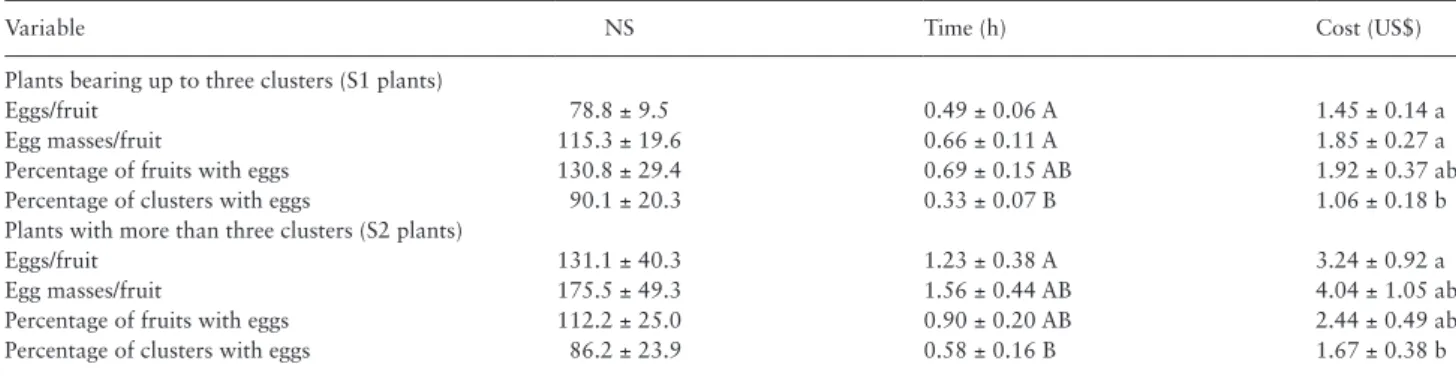
(Table 5). Therefore, percentage of clusters with eggs is the most adequate variable for scouting N. elegantalis eggs on tomato plants. The average time and cost of sampling for this variable were 0.33 h and US$1.06 for S1 plants, and 0.58 h and US$1.67 for S2 plants. Plants in the S1 stage were evaluated in less time due to the smaller number of clusters evaluated (one cluster per plant) compared with the S2 plants (two clusters per plant).
Number of Samples Against Prediction Error
The number of samples needed to assess the percentage of clus-ters with eggs stabilized at the 25% error (0.25) for both S1 and S2 plants. For this error level, S1 and S2 plants required 42 and 36 samples (Fig. 1A and B), respectively. and the residuals were less scat-tered (Fig. 1C and D).
Discussion
Decision-making for N. elegantalis is usually based on data from traps baited with sex pheromone (Salas et al. 1992). However, amongst other limitations, the cost of these traps is high. The use of four traps per hectare is recommended, with a cost per field monitored of US$11.00 excluding labor (Promip 2019). Scouting methods involving visual inspection of eggs on fruits can mitigate the limitations of pheromone traps, including cost-effectiveness. The sampling plan developed for scouting N. elegantalis in this study is fast, reflects pest infestation in tomato fields, and has affordable costs per unit scouted for both plant stages (S1 and S2) considered.
In S1 plants, the sampling unit with the highest accuracy (rela-tive variance ≤ 25%) and representa(rela-tiveness for N. elegantalis egg
Table 4. Chi-square adherence test by the expected negative binomial (NB), positive binomial (PB), and Poisson distributions of
N. elegantalis sampling data obtained in tomato fields with more than three clusters (S2 plants)
Field NB PB Poisson NB PB Poisson
Eggs/fruit Egg masses/fruit
χ2 df χ2 df χ2 df χ2 df χ2 df χ2 df 1 0.24ns 1 2,657* 5 5.68ns 2 164* 2 534* 3 12.13* 1 2 0.38ns 2 2,375* 5 2.27ns 2 168* 2 140,373* 2 16.23* 1 3 53.19* 2 2,493* 5 14.76* 2 198* 2 264* 3 16.22* 1 4 40.83* 2 5,999* 6 3.34ns 2 137* 2 7,028* 5 30.89* 2 5 26.58* 1 71.84* 2 3.79ns 1 188* 2 8.20* 1 7.08* 1 6 10.98* 1 52.33* 1 8.86* 1 44.86* 2 16.59* 1 5.18ns 1 7 0.99ns 2 1,044* 4 1.84ns 2 180* 2 156* 2 14.16* 1 8 9.52* 2 1,241* 4 0.51ns 2 56.19* 2 211* 2 10.24* 1 9 4.06* 1 453* 3 3.13ns 1 233* 2 43.07* 1 15.51* 1 10 23.10* 2 3,607* 6 1.33ns 2 201* 2 412* 3 10.21* 1
Percentage of fruits with eggs Percentage of clusters with eggs
χ2 df χ2 df χ2 df χ2 df χ2 df χ2 df 1 443* 21 13,595* 7 2,988* 13 304* 25 12,668* 7 2,467* 23 2 326* 15 5,249* 6 9,633* 11 1,693* 23 4,500* 6 5,197* 19 3 421* 19 3,711* 6 4,283* 12 3,536* 28 3,340* 6 4,891* 21 4 509* 21 13,487* 7 3,054* 13 351* 27 13,980* 7 2,137* 22 5 139* 7 2,789* 5 2,251* 5 268* 10 2,041* 5 9,103* 13 6 113* 6 1,578* 4 1,348* 4 6,084* 9 1,282* 4 477* 15 7 310* 14 19,920* 7 9,864* 10 1,525* 24 15,375* 7 6,887* 19 8 229* 13 20,792* 7 7,671* 10 17,665* 7 17,665* 7 5,253* 18 9 274* 12 8,192* 6 14,280* 9 624* 16 8,331* 6 8,418* 25 10 484* 19 10,807* 7 5,551* 13 3,230* 27 9,886* 7 3,198* 21
Four variables (eggs/fruit, egg masses/fruit, percentage fruit with eggs, and percentage of clusters with eggs) were assessed in ten fields χ2, χ2-test value; df, degrees of freedom; ns, nonsignificant at the 5% level.
* significant at the 5% level.
sampling was the most basal (last) cluster. For S2 plants the ideal sampling unit is the combination of the second and third clusters. The sampling units from S1 and S2 plant stages are composed pre-dominantly of young fruits (up to 2.2 cm in diameter), previously reported as being the most preferred for N. elegantalis oviposition (Blackmer et al. 2001, EPPO 2015). At these sampling units, the relative densities that best represent N. elegantalis absolute density can be obtained, allowing for effective decision-making (Pedigo and Rice 2014).
The types of distributions fitting data for the different variables considered for both S1 and S2 plants were different, and two vari-ables (percentage of fruits and clusters with eggs) did not fit any distribution tested. Data on number of eggs/fruit in S1 plants ad-justed to the negative binomial model. Conversely, the data of egg masses/fruit in S1 plants and number of eggs/fruit in S2 plants pre-sented a better fit to the Poisson distribution. Data of percentage of fruit presenting eggs and percentage of clusters with eggs did not fit the distribution models tested. The association of the numerical distribution of the data to the spatial pest distribution, although ap-plied by some workers, may be inadequate (Young and Young 1990,
Barrigossi et al. 2001). For this purpose, the assessment of the spa-tial dependence, through semivariograms and correlograms, should be applied (Barrigossi et al. 2001, Fernandes et al. 2015, Lima et al. 2018, Martins et al. 2018). In our study, defining the frequency dis-tribution was performed only to allow formula selection for calcu-lating the number of samples for each characteristic. The number of samples for each characteristic was used to calculate the sampling costs and make comparisons among the different characteristics evaluated.
Sampling cost is defined by the number of sampling units and the time taken to evaluate each sample (Feng et al. 1994). For the esti-mation of pest densities, a precision error of up to 25% is allowed (Southwood and Henderson 2000). The percentage of clusters with eggs was the most adequate variable for N. elegantalis sampling. For this characteristic, the mean scouting time was <1 h. When regressing the number of samples against the prediction error, the number of samples at the error level at which the curve stabilized (25%) was 42 (costing US$0.99) and 36 (costing US$1.47) for S1 and S2 plants, respectively. For the 25% error level, residue analysis showed that the variation among the number of samples for different fields is very Table 5. Number of samples (NS), time, and cost required for sampling N. elegantalis in ten tomato crops with S1 and S2 plants
Variable NS Time (h) Cost (US$)
Plants bearing up to three clusters (S1 plants)
Eggs/fruit 78.8 ± 9.5 0.49 ± 0.06 A 1.45 ± 0.14 a
Egg masses/fruit 115.3 ± 19.6 0.66 ± 0.11 A 1.85 ± 0.27 a
Percentage of fruits with eggs 130.8 ± 29.4 0.69 ± 0.15 AB 1.92 ± 0.37 ab
Percentage of clusters with eggs 90.1 ± 20.3 0.33 ± 0.07 B 1.06 ± 0.18 b
Plants with more than three clusters (S2 plants)
Eggs/fruit 131.1 ± 40.3 1.23 ± 0.38 A 3.24 ± 0.92 a
Egg masses/fruit 175.5 ± 49.3 1.56 ± 0.44 AB 4.04 ± 1.05 ab
Percentage of fruits with eggs 112.2 ± 25.0 0.90 ± 0.20 AB 2.44 ± 0.49 ab
Percentage of clusters with eggs 86.2 ± 23.9 0.58 ± 0.16 B 1.67 ± 0.38 b
Four variables (eggs/fruit, egg masses/fruit, percentage of fruits with eggs, and percentage of clusters with eggs) were assessed in order to determine the most cost-effective sampling method. Means followed by the same letter in each column do not differ by Tukey’s HSD test at the 5% level.
Fig. 1. Number of samples required for scouting N. elegantalis under different precision errors, and residual plot exhibiting the dispersion of estimated number
of samples required for the conventional plan assessing percentage of clusters with eggs. (A and C) number of samples and residuals for plants bearing up to three fruit clusters and (B and D) same variables for plants with more than three clusters.
low indicating that minimal changes would occur when determining number of samples for other fields. Therefore, these findings indicate that the number of samples at this error level were not only lower but also robust, providing confidence for the cost estimates and com-parisons among such costs.
A reduced scouting time enables fast and cost-effective decision-making. Particularly for direct pests (i.e., that damage the marketable part of the crop), management decisions must be made quickly, aiming to prevent economic losses. The labor costs in the field represent 26% of the total cost of tomato production (FNP 2012). A shorter scouting time leads to a scouting procedure that can be easily implemented by producers who will be able to use the labor more effectively for other activities in the field (e.g., sowing, fertilization, irrigation, pest and disease control, and harvesting), maximizing the net income of tomato producers.
In summary, the sampling plan for scouting N. elegantalis de-veloped in this study is fast and reflects pest infestation in tomato fields. The plan consists in calculating the percentage of clusters with
N. elegantalis eggs by scouting eggs on the most basal cluster of
plants presenting up to three clusters and the second and third clus-ters on plants with more than three clusclus-ters. The plan requires 42 and 36 samples, costing less than US$1.50 per sampling. Further studies are necessary to generate a sequential sampling plan to allow even more cost effective decision-making in IPM for fresh market tomatoes.
Supplementary Data
Supplementary data are available at Journal of Economic
Entomology online.
Acknowledgments
Financial support was provided by National Council for Scientific and Technological Development (Conselho Nacional de Desenvolvimento Científico e Tecnológico—CNPq); Coordination of Improvement of Higher Education Personnel (Coordenação de Aperfeiçoamento de Pessoal de Nível Superior—CAPES—Finance Code 001); and Minas Gerais State Foundation for Research Aid (Fundação de Amparo à Pesquisa do Estado de Minas Gerais—FAPEMIG).
References Cited
Bacci, L., M. C. Picanço, M. F. Moura, A. A. Semeão, F. L. Fernandes, and E. G. Morais. 2008. Sampling plan for Thrips (Thysanoptera: Thripidae) on cucumber. Neotrop. Entomol. 37: 582–590.
Badji, C. A., A. E. Eiras, A. Cabrera, and K. Jaffe. 2003. Evaluation of sexual pheromone of Neoleucinodes elegantalis Guenée (Lepidoptera: Crambidae). Neotrop. Entomol. 32: 221–229.
Barrigossi, J. A. F., L. J. Young, C. A. G. Crawford, G. L. Hein, and L. G. Higley. 2001. Spatial and probability distribution of mexican bean beetle (Coleoptera: Coccinellidae) egg mass populations in dry bean. Environ. Entomol. 30: 244–253.
Benvenga, S. R., S. A. Bortoli, S. Gravena, and J. C. Barbosa. 2010. Monitoring the tomato fruit borer population for the control decision. Hortic. Bras. 28: 435–440.
Blackmer, J. L., A. E. Eiras, and C. L. M. Souza. 2001. Oviposition prefer-ence of Neoleucinodes elegantalis (Guenée) (Lepidoptera: Crambidae) and rates of parasitism by Trichogramma pretiosum Riley (Hymenoptera: Trichogrammatidae) on Lycopersicon esculentum in São José de Ubá, RJ, Brazil. Neotrop. Entomol. 30: 89–95.
Bliss, C. I., and A. R. G. Owen. 1958. Negative binomial distributions with a common k. Biometrika. 45: 37–58.
Díaz-Montilla, A. E., M. A. Solis, and T. Kondo. 2013. The tomato fruit borer, Neoleucinodes elegantalis (Guenée) (Lepidoptera: Crambidae), an insect pest of neotropical solanaceous fruits potential invasive pests of agricul-tural crops, pp. 137–159. In J. E. Peña (ed.), Potential invasive pests of agricultural crop. CABI, Wallingford, United Kingdom.
Díaz-Montilla, A. E., H. Suárez-Barón, G. Gallego-Sánchez, W. F. Viera-Arroyo, and C. I. Saldamando-Benjumea. 2017. Variation in the capture of Neoleucinodes elegantalis Guenée (Lepidoptera: Crambidae) males using commercial sex pheromones on three solanaceous hosts. Cienc. Tecnol. Agropecu. 18: 583–597.
EPPO. 2015. Neoleucinodes elegantalis. EPPO Bull. 45: 9–13.
Feng, M. G., R. M. Nowierski, and Z. Zeng. 1994. Binomial sequential classi-fication sampling plans for Russian wheat aphid (Homoptera: Aphididae) management: Robustness varying with tally thresholds of aphids in sample units. J. Econ. Entomol. 87: 1237–1250.
Fernandes, F. L., M. C. Picanço, M. E. S. Fernandes, R. A. C. Dângelo, F. F. Souza, and R. N. C. Guedes. 2015. A new and highly effective sampling plan using attractant-baited traps for the coffee berry borer (Hypothenemus hampei). J. Pest Sci. (2004). 88: 289–299.
FNP. 2012. Tomate, pp. 456–462. In AGRIANUAL – Anuário da Agricultura Brasileira. Informa Economics FNP South America, São Paulo, Brazil. Gusmão, M. R., M. C. Picanço, J. C. Zanuncio, D. J. H. Silva, and
J. A. F. Barrigossi. 2005. Standardised sampling plan for Bemisia tabaci (Homoptera: Aleyrodidae) in outdoor tomatoes. Sci. Hortic. 103: 403–112.
INMET. 2019. INMET. Inst. Nac. Meteorol. (http://www.inmet.gov.br/ portal/) (accessed 8 April 2019).
Lima, C. H. O., R. A. Sarmento, T. V. S. Galdino, P. S. Pereira, J. Silva, D. J. Souza, G. R. Santos, T. L. Costa, and M. C. Picanço. 2018. Spatiotemporal dy-namics of whitefly Bemisia tabaci (Hemiptera: Aleyrodidae) in commercial watermelon crops. J. Econ. Entomol. 111: 1895–1903.
Lima, C. H., R. A. Sarmento, P. S. Pereira, T. V. Galdino, F. A. Santos, J. Silva, and M. C. Picanço. 2017. Feasible sampling plan for Bemisia tabaci control decision-making in watermelon fields. Pest Manag. Sci. 73: 2345–2352. Marcano, R. 1991. Estudio de la biología y algunos aspectos del
comportamiento del perforador del fruto del tomate Neoleucinodes elegantalis (Lepidoptera: Pyralidae) en tomate. Agron. Trop. 41: 257–263. Martins, J. C., M. C. Picanço, R. S. Silva, A. H. Gonring, T. V. Galdino, and
R. N. Guedes. 2018. Assessing the spatial distribution of Tuta absoluta (Lepidoptera: Gelechiidae) eggs in open-field tomato cultivation through geostatistical analysis. Pest Manag. Sci. 74: 30–36.
Moura, M. F., M. C. Picanço, R. N. C. Guedes, E. C. Barros, M. Chediak, and E. G. F. Morais. 2007. Conventional sampling plan for the green leafhopper Empoasca kraemeri in common beans. J. Appl. Entomol. 131: 215–220.
Noboa, M., W. Viera, A. Díaz, W. Vásquez, L. Ron, M. Noboa, W. Viera, A. Díaz, W. Vásquez, and L. Ron. 2017. Genitalic differentiations in Neoleucinodes elegantalis (Gueneé) (Lepidoptera: Crambidae) associated with solanaceae crops in Ecuador. Insects. 8: 91.
Pedigo, L. P., and M. E. Rice. 2014. Entomology and pest management, 6th ed. Waveland Press, Long Grove, IL.
Peel, M. C., B. L. Finlayson, and T. A. McMahon. 2007. Updated world map of the Köppen-Geiger climate classification. Hydrol. Earth Syst. Sci. 11: 1633–1644.
Pereira, P. S., R. A. Sarmento, T. V. Galdino, C. H. Lima, F. A. Dos Santos, J. Silva, G. R. Dos Santos, and M. C. Picanço. 2017. Economic injury levels and sequential sampling plans for Frankliniella schultzei in watermelon crops. Pest Manag. Sci. 73: 1438–1445.
Picanço, M. C., L. Bacci, A. L. B. Crespo, M. M. M. Miranda, and J. C. Martins. 2007. Effect of integrated pest management practices on tomato production and conservation of natural enemies. Agric. For. Entomol. 9: 327–335.
Picanço, M., G. L. D. Leite, R. N. C. Guedes, and E. A. Silva. 1998. Yield loss in trellised tomato affected by insecticidal sprays and plant spacing. Crop Prot.. 17: 447–452.
Pinto, C. B., R. A. Sarmento, T. V. S. Galdino, P. S. Pereira, B. G. Barbosa, C. H. O. Lima, N. R. Silva, and M. C. Picanço. 2017. Standardized
sampling plan for the thrips Frankliniella schultzei (Thysanoptera: Thripidae) on watermelon crops. J. Econ. Entomol. 110: 748–754. Promip. 2019. Loja Promip. (http://www.lojapromip.com.br/) (accessed 05
February 2019).
R Core Team. 2013. R: a language and environment for statistical computing. R Found. Stat. Comput. 55: 275–286.
Rosado, J. F., R. A. Sarmento, M. Pedro-Neto, T. V. Galdino, R. V. Marques, E. A. Erasmo, and M. C. Picanço. 2014. Sampling plans for pest mites on physic nut. Exp. Appl. Acarol 63: 521–534.
Salas, J., C. Alvarez, and A. Parra. 1992. Estudios sobre la feronmona a sexual natural del perforador del fruto del tomate Neoleucinodes elegantalis (Guenée) (Lepidoptera: Pyralidae). Agron. Trop. 42: 227–231.
Silva, D., and F. Vale. 2007. Tomate: tecnologia de produção. Editora UFV, Viçosa, Brazil.
Silva, R. S., L. Kumar, F. Shabani, E. M. da Silva, T. V. da Silva Galdino, and M. C. Picanço. 2017. Spatio-temporal dynamic climate model for Neoleucinodes elegantalis using CLIMEX. Int. J. Biometeorol. 61: 785–795.
Silva, R. S., L. Kumar, F. Shabani, A. V. Ribeiro, and M. C. Picanço. 2018a. Dry stress decreases areas suitable for Neoleucinodes elegantalis (Lepidoptera: Crambidae) and affects its survival under climate predictions in South America. Ecol. Inform. 46: 103–113.
Silva, R. S., L. P. Arcanjo, J. R. S. Soares, D. O. Ferreira, J. E. Serrão, J. C. Martins, Á. H. Costa, and M. C. Picanço. 2018b. Insecticide tox-icity to the borer Neoleucinodes elegantalis (Guenée) (Lepidoptera: Crambidae): developmental and egg-laying effects. Neotrop. Entomol. 47: 318–325.
Southwood, R., and P. A. Henderson. 2000. Ecological methods, 3rd ed. Blackwell Science, Oxford, United Kingdom.
Young, L. J., and J. H. Young. 1990. A spatial view of the negative bino-mial parameter k when describing insect populations, pp. 13–20. In G. A. Milliken (ed.), Conference on Applied Statistics in Agriculture, Kansas State University, Manhattan, KS.
Young, L. J., and J. H. Young. 1998. Statistical ecology: a population perspec-tive. Kluwer Academic, Boston, MA.