HAL Id: hal-01724931
https://hal.archives-ouvertes.fr/hal-01724931
Submitted on 6 Mar 2018
HAL is a multi-disciplinary open access
archive for the deposit and dissemination of
sci-entific research documents, whether they are
pub-lished or not. The documents may come from
teaching and research institutions in France or
abroad, or from public or private research centers.
L’archive ouverte pluridisciplinaire HAL, est
destinée au dépôt et à la diffusion de documents
scientifiques de niveau recherche, publiés ou non,
émanant des établissements d’enseignement et de
recherche français ou étrangers, des laboratoires
publics ou privés.
Dynamic Driving Task Fallback for an Automated
Driving System whose Ability to Monitor the Driving
Environment has been Compromised
Yrvann Emzivat, Javier Ibanez-Guzman, Philippe Martinet, Olivier Henri
Roux
To cite this version:
Yrvann Emzivat, Javier Ibanez-Guzman, Philippe Martinet, Olivier Henri Roux. Dynamic Driving
Task Fallback for an Automated Driving System whose Ability to Monitor the Driving Environment
has been Compromised. IEEE Intelligent Vehicles Symposium, Jun 2017, Redondo Beach, United
States. �hal-01724931�
Dynamic Driving Task Fallback for an Automated Driving System whose
Ability to Monitor the Driving Environment has been Compromised
Yrvann Emzivat
1,2, Javier Ibanez-Guzman
1, Philippe Martinet
2and Olivier H. Roux
2Abstract— An Automated Driving System (ADS) is subject to hazardous weather conditions and to failures, both of which can result in a partial or total loss of its ability to monitor the driving environment. Yet until high driving automation and full driving automation is achieved, a human driver is expected to respond appropriately to any malfunction or adverse on-road conditions preventing the ADS from reliably sustaining the dynamic driving task performance. However, automation causes drowsiness and hypo-vigilance, which can compromise a human driver’s ability to respond to ADS-issued requests. Hence the necessity of defining dynamic driving task fallback strategies that can be performed by the ADS, if and when necessary.
The proposed fallback strategy is aimed at level 4 ADS features designed to operate a vehicle on a road whose characteristics make any attempt at stopping hazardous. It naturally applies to level 5 operated vehicles and to ADS-dedicated vehicles as well. The transition stage, during which the strategy is triggered, consists in the replacement of missing vehicles and obstacles in the world model with ghost objects. An embedded visibility map is then used to retrieve the maximum distance at which the ADS-operated vehicle can be seen, when driving behind it. The speed profile underlying the fallback strategy meets a time to collision criterion of 4 s, which enables the avoidance and the mitigation of rear-end collisions. The behaviour of drivers in collision imminent situations cannot be observed in test track studies due to safety concerns. As a result, experiments were conducted in the driving simulation software SCANeR studio.
I. INTRODUCTION
The perception module provides an Automated Driving System (ADS) with the ability to monitor the driving envi-ronment through the accomplishment of real-time roadway environmental object and event detection, recognition, clas-sification, and response preparation, as needed to operate a vehicle. In the event of a failure that renders it inoperable, a level 3 ADS issues a timely request to intervene and disengages soon after, while a level 4 or 5 ADS must make do with its localisation module and communication capabil-ities to perform the dynamic driving task (DDT) fallback if a human driver does not respond appropriately to such a request. The ADS is said to experience a DDT performance-relevant system failure and is expected to achieve a minimal risk condition in order to reduce the risk of a crash, as the trip cannot and should not be completed. At the onset of adverse weather conditions whose impact on the capabilities of the system is deemed significant, the ADS is also expected to perform the DDT-fallback to achieve a minimal risk condition.
1Renault S.A.S., 1 avenue du Golf, 78288 Guyancourt, France 2Laboratoire des Sciences du Num´erique de Nantes (LS2N) – UMR CNRS 6004, 1 rue de la No¨e BP 92101, 44321 Nantes, France
Conditional driving automation assumes a DDT fallback-ready user is able to operate the vehicle and is receptive to ADS-issued requests to intervene. However, while a driving automation system can significantly reduce a human driver’s workload [1], automation can also cause drowsiness and hypo-vigilance [2]. Research was conducted to determine when the user’s attention should be directed back to the driving task [3]. Yet the take-over process remains complex and needs to be studied further [4]. Moreover, some drivers are unaware of the capabilities and limitations of driving automation systems. Adaptive cruise control (ACC) is but one system that is being misused in the case of partial driving automation, for users expect it to perform effectively in situations when it actually cannot [5]. The safety benefits of lower levels of driving automation are compromised if a human driver does not supervise the system correctly. Thus, it can be argued that the value of a level 3 ADS is contentious and that the DDT-fallback ultimately constitutes a burden for the driver with whom all responsibility lies.
For the most part, a fallback strategy entails bringing the vehicle to a stop within its current travel path automatically, but it can also pertain to a more extensive manoeuvre designed to remove the vehicle from an active lane of traffic. In some cases however, the vehicle should not be brought to a stop. For example, stopping the vehicle in a tunnel or on a motorway that does not feature a hard shoulder is dangerous and should be avoided if possible. Automatic braking and swerving was investigated for collision avoidance systems with the rationale that evasive manoeuvres can be applied later than braking manoeuvres [6]. However, the approach relies on a functional radar sensor system to determine inter-vehicle distance values. The fallback strategy proposed here is aimed at level 4 ADS features, designed to operate a vehicle on a road whose characteristics make any attempt at stopping the vehicle hazardous. This implies that the approach also applies to level 5 ADS-operated vehicles and to ADS-dedicated vehicles, for SAE levels indicate minimum rather than maximum ADS capabilities.
The remainder of the paper is organised as follows. Section II presents the rationale behind the current study. Section III highlights potential solutions to the problem at hand and presents the proposed fallback strategy. Section IV concludes this work. This paper complies with the taxon-omy and definitions for terms related to driving automation systems for on-road motor vehicles, as defined by SAE International [7].
Fig. 1: Characteristics of the Dampierre Road (D91)
II. PROBLEM STATEMENT
The objective of this section is to evaluate the behaviour of an Automated Driving System experiencing a severe DDT performance-relevant system failure affecting its perception module, when the system is devoid of a proper fallback strategy.
A. Scenario
1) Road network: A dual carriageway with two lanes in each direction was created within the driving simula-tion software SCANeR studio to model a 2 km long road section, known as the Dampierre Road (D91). This busy road connects the city of Versailles to the activity Centre of Guyancourt in France (fig. 1). The Dampierre Road crosses the state forest of Versailles. Trees on both sides of the road impair visibility. The region is also subject to heavy rain and fog.
The modelled road consists of three sections. The speed limit of the middle section, which features two sharp turns, is set to 50 km.h−1. The speed limit is set to 70 km.h−1 for the other two. Lanes in opposite directions have different elevations in the middle section.
2) Vehicles and Traffic: Buses take the Dampierre Road. They sometimes encroach on both lanes when they exceed the speed limit. Bicycles are also to be expected, for the road features a cycle lane in both directions. The road takes under two minutes to travel when traffic is flowing smoothly.
The proposed scenario consists of four vehicles initially positioned in the right lane. Their characteristics are detailed in Table I. The ADS-equipped vehicle (ADS-EV) is initially in second position. In the simulation software, a simple bi-cycle model is used to model vehicle dynamics. All vehicles comply with road traffic regulations.
TABLE I: Characteristics of the vehicles Identifier A B C D Vehicle type Car ADS-EV Bus Car Initial position 0 1 2 3 Max speed (km.h−1) 90 75 90 90 Max acceleration (m.s−2) 5 5 1.5 4 Max deceleration (m.s−2) 9 9 7.5 9
TABLE II: Characteristics of the zones Trip Guyancourt - Versailles Versailles - Guyancourt Zone A1 A2 A3 B1 B2 B3 Distance (m) 210 180 235 190 190 185 Duration (s) 11.5 12.4 17.7 12.9 14.8 9.5
3) Failure: The Automated Driving System is assumed to lose its ability to monitor the driving environment as a result of the DDT performance-relevant system failure affecting its perception module. This implies that the ADS cannot ac-complish real-time roadway environmental object and event detection. Despite being unable to function optimally, the ADS remains capable of following the right lane during failures, thanks to its localisation module.
Both the Guyancourt-Versailles and the Versailles-Guyancourt trips were performed as part of the simulation scenario. The perception module of the Automated Driving System was subject to the DDT performance-relevant system failure on three occasions during each trip. These failures lasted throughout the areas that are represented in figure 1. Road geometry, visibility and speed limits were taken into consideration to define these zones. Their characteristics are given in Table II. The duration of each failure corresponds to the time it takes to travel the zone at the maximum speed limit. It includes the reaction time of the ADS.
4) Experiment: Separate experiments were conducted for each trip:
• For the Guyancourt-Versailles trip (scenario S1), the
speed profile of vehicle A was set according to the graph displayed in figure 2. Real trips were performed on the Dampierre Road in order to define a typical speed profile for vehicle A, when traffic is light.
• For the Versailles-Guyancourt trip (scenario S2),
ve-hicle A was positioned in front of the ADS-equipped vehicle with a given speed vi (ranging from 0 to
50 km.h−1), at a distance of 20 m, whenever the ADS recovered from a failure.
In both cases, data pertaining to the dynamics of all four vehicles was recorded and the behaviour of the ADS was evaluated.
B. Analysis
Figures 3 and 4 show the behaviour of the ADS-operated vehicle in scenario S1 and scenario S2 respectively. The
speed profile of a vehicle that drives at the maximum speed limit is represented by a curve labelled vRef for each trip.
0 0.5 1 1.5 2 10 20 30 40 50 60 70 A1 A2 A3 70 50 70 Lane abscissa (km) Speed (k m .h − 1 ) vRef vA
Fig. 2: Speed profile of vehicle A in scenario S1
0 0.5 1 1.5 2 10 20 30 40 50 60 70 A1 A2 A3 70 50 70 Lane abscissa (km) Speed (k m .h − 1 ) vRef vB
Fig. 3: Speed profile of vehicle B in scenario S1
Scenario S1 illustrates the fact that an ADS that lacks a
proper fallback strategy runs the risk of crashing into the vehicle in front of it during the failure. After 81 seconds of simulation time, a collision between vehicle B, travelling at 50 km.h−1 and vehicle A, travelling at 25 km.h−1 occurs. When the perception module of the ADS-operated vehicle fails, the Automated Driving System acts as if there are no obstacles in the scene, which explains why the speed profile of vehicle B matches the curve labelled vRef in these areas,
regardless of the last known position of vehicle A. The longer the duration of the failure, the greater the risk of a collision between vehicles A and B. This also shows how an ADS would react if obstacles were missing in the world model as a result of sensor failures or occlusions, and if no action is taken to replace the missing information.
Scenario S2 illustrates the fact that the behaviour of the
ADS at recovery can lead to hazardous situations. For vA=
20 km.h−1, the sudden deceleration following the recovery
0 0.5 1 1.5 2 10 20 30 40 50 60 70 B1 B2 B3 70 50 70 Lane abscissa (km) Speed (k m.h − 1 ) vRef v50 v40 v30 v20
Fig. 4: Speed profile of vehicle B in scenario S2
0 20 40 60 80 100 120 140 50 100 150 200 B1 B2 B3 70 50 70 Time (s) Distance (m ) dBA dBC dBD
Fig. 5: Inter-vehicle distances when vA is set to 20 km.h−1
(at recovery) in scenario S2
of failure B1 led vehicle D to overtake vehicles C and B
while vehicle A was accelerating once again. The subsequent emergency break helped to avoid the collision between vehicle B and vehicle D but the sudden speed variation created yet another hazardous situation with vehicle C, which was forced to brake as well. Figure 5 provides the inter-vehicle distances separating the ADS-equipped inter-vehicle from the other vehicles in this scenario.
The absence of a DDT fallback can lead to highly haz-ardous situations, including rear-end collisions at full speed and multi-vehicle crashes with severe consequences. It is necessary for the system to adapt gracefully to the failure in order to avoid hazardous recoveries. In order to design a level 4 ADS-equipped vehicle that can operate on the Dampierre Road, a proper fallback strategy must be defined in the event of such a failure.
III. THE PROPOSED FALLBACK STRATEGY A fallback strategy usually entails automatically bringing the vehicle to a stop within its current travel path, but can also pertain to a more extensive manoeuvre designed to remove the vehicle from an active lane of traffic. However, the road under consideration does not feature a hard shoulder. An emergency stop would be highly hazardous given the road geometry, the road logic, the variety of travellers and limited visibility. In the following, any attempt to stop on the road is considered hazardous and is therefore prohibited. A. Assumptions
This section highlights the assumptions that are made in the proposed approach.
1) Perception module: It is assumed that the Automated Driving System’s ability to monitor the driving environment has been compromised. Such a condition is attributable to failures and to hazardous weather conditions. Different types of sensors typically react to the same environmental condition in diverse ways. While common practices address-ing hardware failures tend to over-provision resources, an Automated Driving System targeted towards large-scale cost-sensitive markets is more likely to feature a variety of sensor modalities.
A fallback strategy is needed in case such attempts at improving system dependability prove insufficient. To this end, a framework that gives the automated system the means to acknowledge its inability to monitor the driving environment is required. The purpose of this study is not to evaluate the validity of the request to intervene by the auto-mated system. Therefore, it neither issues false alarms nor categorises critical situations as uncritical. In the following, the perception module is considered unreliable and cannot be used to elaborate a fallback strategy.
2) Human driver: Nowadays, most Automated Driving Systems rely on a DDT fallback-ready user to achieve a minimal risk condition. However, a human driver may not respond to a request to intervene appropriately and in good time, which is why a fallback strategy is to be defined regardless of the presence of a human driver and his ability to intervene. The dynamic driving task fallback must also be defined for ADS-dedicated vehicles (designed to be operated exclusively by a level 4 or level 5 ADS for all trips).
3) Communication: The sharing of information between vehicles or with the infrastructure allows the ADS to perceive its environment beyond the limits of the on-board sensors of its perception module. This can be useful if the position and speed of other vehicles can be obtained with a good precision and in good time. However, communication poses security threats, confidentiality issues and is subject to delays in response time. In the following, communication is not used to elaborate a fallback strategy.
4) Localisation module: The localisation module is a driving automation system whose purpose is to determine the position of the vehicle with respect to an embedded map. The map contains relevant information about the road typography (number of lanes, intersections, etc). In the following, both
the map and the localisation module of the ADS are assumed to be perfect. The ADS-operated vehicle can therefore posi-tion itself correctly in the right lane, regardless of any failure affecting the perception module.
In practice however, sensors can be shared between the perception module and the localisation module. For exam-ple, cameras are used by the perception module to detect pedestrians and by the localisation module to detect lane markings. As a result, both failures and hazardous weather conditions affecting the cameras can prevent the localisation module from functioning optimally.
The conflicting hypotheses of an unreliable perception module and of perfect vehicle localisation can be rephrased as follows. The combination of hazardous weather conditions and failures affecting the Automated Driving System are severe enough that the perception module cannot monitor the driving environment reliably. Yet they are not severe to the point the ADS can no longer reach the end of the road under consideration by following the right lane. It is assumed here that the Automated Driving System takes advantage of the multi-modality that its localisation module provides.
5) Miscellaneous: Vehicles drive on the right side of the road. When the failure occurs, the ADS-operated vehicle is either positioned on the right lane or is assumed to have the ability to immediately change lane to position itself there.
The visibility range of other vehicles is determined by the curvature and elevation of the road. The chosen road adhesion parameters match those of a dry road in the simulation software. Finally, we assume that the ADS is able to make use of the full range of vehicle dynamics.
B. Active safety systems
An active safety system senses and monitors conditions inside and outside of the vehicle in order to identify potential dangers to the vehicle, occupants, and/or other road users [7]. In the following, the existence of an active safety system that can detect the loss of the perception capabilities of the vehicle is assumed. This loss can be the result of a failure of the perception module as a whole, as well as the failure of key sensors or the presence of major inconsistencies in the generated world model.
The rationale behind the proposed fallback strategy rests on the following remarks:
• Since the vehicle is prohibited from stopping on the considered road, as it is highly hazardous, the goal of the ADS is to reach the end of the road while mitigating collisions or avoiding them.
• Since the ADS has lost its ability to monitor the driving environment, the ADS-operated vehicle is to be constrained to the right lane to avoid complex and hazardous situations. Moreover, the localisation module is assumed to be perfect, so the ADS can easily follow the lane. The vehicle must be slow enough so that rear-end collisions with vehicles in front are avoided or mitigated. It must also be fast enough so that other vehicles are not startled by its behaviour when it appears in their field of view.
0 0.5 1 1.5 2 0 50 100 150 200 A1 A2 A3 70 50 70 Lane abscissa (km) V isibility Distance (m )
Fig. 6: Visibility distances on the Guyancourt-Versailles trip
C. Speed profile meeting a TTC-criterion
The speed profile that is to be adopted by the ADS-operated vehicle during failures depends on a time to col-lision criterion. The general idea is to drive as slowly as possible while giving following vehicles the time to slow down or attempt evasive manoeuvres such as overtaking. Figure 6 shows, for each position x1 of the ADS-equipped
vehicle, the maximum distance Dvmax(x1) at which it can be
seen, by vehicles driving behind it. In order to mitigate the severity of collisions with leading and following vehicles, the minimum and maximum speed limits Vmin and Vmax
are set to 20 km.h−1 and 35 km.h−1 respectively for the Automated Driving System, on all three sections of the road. Vmax influences the severity and likelihood of a rear-end
collision with a vehicle in front of the ADS-operated vehicle, while Vmin mostly influences the time it takes to reach the
end of the road. These parameters must be chosen according to the type of road and the maximum speed limit.
Time to collision (TTC) is defined as the time required for two vehicles to collide if they continue at their present speed and on the same path [8]:
T T C = ∆L v2− v1
= x2− x1 v2− v1
,
where ∆L is the distance between both vehicles, x1and x2
are the lane abscissas of the vehicles, v1 is the speed of the
leading vehicle and v2is the speed of the following vehicle.
The value of TTC is usually used in the decision making process that leads to the activation of driver assistance systems for driving automation systems. Studies have shown that it is a fitting measure of the severity of conflicts on the road. This metric was successfully used for collision risk prediction using a grid-based approach [9] and for situation identification [10] in the context of autonomous driving. The lowest value of TTC during a situation involving two vehicles on a collision course is denoted TTCmin and indicates the
severity of the encounter. The lower the value of TTCmin,
0 0.5 1 1.5 2 10 20 30 40 50 60 70 70 50 70 Lane abscissa (km) Speed (k m.h − 1 ) TTC3 TTC4 TTC5 vfailureADS
Fig. 7: Speed profile that is to be adopted by the ADS-operated vehicle in the event of a failure
0 0.5 1 1.5 2 0 2 4 6 8 10 12 A1 A2 A3 70 50 70 Lane abscissa (km) TTC (s ) TTC4
Fig. 8: Evolution of the Time To Collision parameter when adopting the proposed speed profile
the higher the risk of a collision. Situations are considered critical when the minimum TTC is less than 1.5 s. TTCmin
appears to be independent of approach speed [8].
The value of TTC at the onset of braking, denoted TTCbrake, represents the available manoeuvring space when
the evasive action starts. In the following, the reaction time of other drivers is set to 1.5 s and TTCbrake is set to 2.5 s,
leading to a TTC-criterion of 4 s. Assuming ∆L = Dmaxv
and v2= vRef, the minimal risk condition is defined for each
lane abscissa x as the speed that guarantees the following TTC-criterion:
vADSf ailure(x) = min[max(vT T C4
ADS (x), Vmin), Vmax],
where vT T C4
ADS (x) = vRef(x − Dvmax(x)) −
Dmaxv (x) T T C4 .
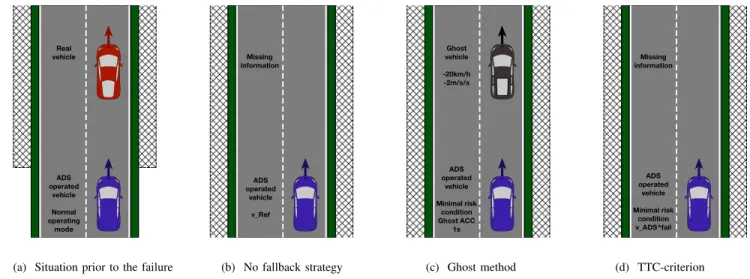
ADS operated vehicle Normal operating mode Real vehicle ADS operated vehicle v_Ref Missing information ADS operated vehicle Minimal risk condition Ghost ACC 1s Ghost vehicle -20km/h -2m/s/s ADS operated vehicle Minimal risk condition v_ADS^fail Missing information
(a) Situation prior to the failure (b) No fallback strategy (c) Ghost method (d) TTC-criterion Fig. 9: Behaviour of the Automated Driving System based on its interpretation of the driving environment
The minimum speed that the ADS-operated vehicle needs to achieve a TTC-criterion of 3, 4 and 5 s, is represented in figure 7 along with the speed profile that verifies the minimal risk condition. As expected, a higher TTC-criterion implies a higher minimum speed must be achieved. As shown in figure 8, the 4 second TTC criterion can be met without the vehicle exceeding 29.4 km.h−1. The chosen speed profile vADSf ailure ensures:
• The ADS-operated vehicle leaves the road in under 6
minutes.
• The mitigation of rear-end collisions with vehicles in front of the ADS-operated vehicle, as its speed never exceeds 30 km.h−1.
• The avoidance of severe rear-end collisions with vehi-cles following the ADS-operated vehicle, as the TTC-criterion of 4 seconds is met for the whole duration of the trip.
Simulations show that both the collision in scenario S1and
the hazardous situation in scenario S2 are avoided when the
ADS performs the DDT-fallback by enforcing the proposed speed profile during failures. However, the ADS-operated vehicle shows sudden speed variations that lead to close calls such as the one presented in scenario S2 in other situations,
since the ADS toggles the DDT-fallback as soon as the failure is detected. This occurs almost exclusively when simulating intermittent faults.
D. Transition stage and ghost method
The transition stage, during which the fallback strategy is activated, must be given proper consideration in order to tackle the remaining number of close calls. This is especially challenging as the nature and duration of the failure usually cannot be determined. If the fault is intermittent, applying the proposed speed profile as soon as a failure is detected leads to a succession of sudden speed variations as the vehicle switches between its normal operating mode and the speed profile underlying the fallback strategy.
The last generated world model prior to the failure of the perception module can be used to finely-shade the transition stage. Missing obstacles can be replaced in the world model with ghosts of the vehicles that were last perceived (fig. 9). Such an approach is only valid for a short period of time, as each vehicle on the road continually adapts its behaviour to new events that cannot be predicted. In the following, it is assumed valid for a time duration of 1 s. When the failure occurs, the ADS adjusts the speed of the vehicle to maintain a safe distance from the ghost of the vehicle that is directly ahead. The initial speed of the ghost vehicle is reduced by 20 km.h−1 compared to the real vehicle and its acceleration is reduced by 2 m.s−2. This forces the ADS to initiate a preventive braking procedure and enables the vehicle to smoothly transition to the TTC compliant speed profile. After 1 s, the ADS terminates the ghost ACC-procedure and enforces the proposed speed profile vADSf ailure. This approach provides a smoother speed profile and removes the sudden speed variations for failures that last less than 3 seconds entirely, as well as intermittent faults of that length.
The setup proposed for scenario S1 was used to elaborate
10 situations featuring a close call and 20 situations featuring rear-end collisions for the Guyancourt-Versailles trip, by modifying the speed profile and behaviour of vehicles A and C. These situations were submitted to an ADS that achieves the minimal risk condition as defined previously, with and without the transition stage adaptation. Results are given in table III. As expected, the 4 s TTC criterion enables the avoidance of collisions with vehicles behind the ADS-operated vehicle, while the addition of the ghost method mitigates the number of close calls. Depending on the traffic conditions and the areas where the failures occur, some collisions with vehicles in front of the ADS-operated vehicle cannot be avoided. For each of the four recorded collisions, the speed difference between the ADS-operated vehicle and vehicle A was below 15 km.h−1.
TABLE III: Experimental results Fallback strategy None TTC4 TTC4+ Ghost
Close calls 10 12 3 Collisions (front) 10 4 4 Collisions (back) 10 0 0
IV. CONCLUSION
A fallback strategy was proposed for an Automated Driv-ing System whose ability to monitor the drivDriv-ing environment had been compromised. It was assumed that bringing the vehicle to a stop was hazardous. The approach favours rear-end collisions at low speed with vehicles in front of the ADS-operated vehicle against risking more serious hazards by bringing the vehicle to a stop. It enables the vehicle to reach a road where it can safely stop, as the ADS keeps the vehicle on the move. However, this can be a matter of discussion as it raises the question of responsibility and ethical decision making [11].
The approach relies on the detection of hazardous weather conditions and failures by an active safety system. It can be adapted to a variety of operational design domains, as long as the backwards visibility mappings are included in the embedded map. In practice, sensors are shared between the perception module and the localisation module. This can prevent the approach from being used as is by some Auto-mated Driving Systems, unless the vehicle can be positioned precisely in its lane. Taking advantage of multi-modality is recommended as it can enable an ADS to reliably determine its position for a longer period of time.
The ADS was supposed devoid of communication capabil-ities as they are prone to security threats and confidentiality issues. However, communicating with the infrastructure and with other vehicles can be useful to obtain information about their position, their speed and the state of traffic. The hypothesis of a truly autonomous vehicle was favoured here. To further reduce the risk of collisions with vehicles in front of the ADS-equipped vehicle, special hazard flashers can be activated in case of such failures. Vehicles in front of the ADS-equipped vehicle are expected to yield when detecting such signals, while human drivers tailgating the ADS-operated vehicle are expected to slow down.
Future work includes a classification of road sections and a framework in which different fallback strategies for an ADS with given capabilities are associated to each road section.
ACKNOWLEDGEMENT
The authors would like to thank Sarouthan Sriranjan for his help with the scenario creation within SCANeR Studio.
REFERENCES
[1] J. C. de Winter, R. Happee, M. H. Martens, and N. A. Stanton, “Effects of adaptive cruise control and highly automated driving on workload and situation awareness: A review of the empirical evidence,” Transportation Research Part F: Traffic Psychology and Behaviour, vol. 27, Part B, pp. 196 – 217, 2014. Vehicle Automation and Driver Behaviour.
[2] P. Thiffault and J. Bergeron, “Monotony of road environment and driver fatigue: a simulator study,” Accident Analysis & Prevention, vol. 35, no. 3, pp. 381 – 391, 2003.
[3] C. Gold, D. Damb¨ock, L. Lorenz, and K. Bengler, “Take over! How long does it take to get the driver back into the loop?,” in Proceedings of the Human Factors and Ergonomics Society Annual Meeting, vol. 57, pp. 1938–1942, SAGE Publications Sage CA: Los Angeles, CA, 2013.
[4] M. Bahram, M. Aeberhard, and D. Wollherr, “Please take over! an analysis and strategy for a driver take over request during autonomous driving,” in Intelligent Vehicles Symposium (IV), 2015 IEEE, pp. 913– 919, IEEE, 2015.
[5] D. A. Dickie and L. N. Boyle, “Drivers’ understanding of adaptive cruise control limitations,” in Proceedings of the Human Factors and Ergonomics Society Annual Meeting, vol. 53, pp. 1806–1810, Sage Publications, 2009.
[6] C. Ackermann, R. Isermann, S. Min, and C. Kim, “Collision avoidance with automatic braking and swerving,” IFAC Proceedings Volumes, vol. 47, no. 3, pp. 10694–10699, 2014.
[7] SAE International, “Taxonomy and definitions for terms related to driving automation systems for on-road motor vehicles,” 2016. [8] R. van der Horst and J. Hogema, Time-to-collision and collision
avoidance systems. 1993.
[9] L. Rummelhard, A. N`egre, M. Perrollaz, and C. Laugier, “Probabilistic grid-based collision risk prediction for driving application,” in Exper-imental Robotics, pp. 821–834, Springer, 2016.
[10] W. Wachenfeld, P. Junietz, R. Wenzel, and H. Winner, “The worst-time-to-collision metric for situation identification,” in Intelligent Vehicles Symposium (IV), 2016 IEEE, pp. 729–734, IEEE, 2016. [11] N. Goodall, “Ethical decision making during automated vehicle
crashes,” Transportation Research Record: Journal of the Transporta-tion Research Board, no. 2424, pp. 58–65, 2014.