HAL Id: hal-03027933
https://hal.archives-ouvertes.fr/hal-03027933
Submitted on 27 Nov 2020
HAL is a multi-disciplinary open access archive for the deposit and dissemination of sci-entific research documents, whether they are pub-lished or not. The documents may come from teaching and research institutions in France or abroad, or from public or private research centers.
L’archive ouverte pluridisciplinaire HAL, est destinée au dépôt et à la diffusion de documents scientifiques de niveau recherche, publiés ou non, émanant des établissements d’enseignement et de recherche français ou étrangers, des laboratoires publics ou privés.
Layered Oxides for Na-Ion Battery Applications
Mariyappan Sathiya, Sathiya Mariyappan, Thomas Marchandier, François
Rabuel, Antonella Iadecola, Gwenaëlle Rousse, Anatoly Morozov, Artem
Abakumov, Jean-marie Tarascon
To cite this version:
Mariyappan Sathiya, Sathiya Mariyappan, Thomas Marchandier, François Rabuel, Antonella Iadecola, et al.. The Role of Divalent (Zn 2+ /Mg 2+ /Cu 2+ ) Substituents in Achieving Full Capacity of Sodium Layered Oxides for Na-Ion Battery Applications. Chemistry of Materials, American Chemical Society, 2020, 32 (4), pp.1657-1666. �10.1021/acs.chemmater.9b05205�. �hal-03027933�
This document is confidential and is proprietary to the American Chemical Society and its authors. Do not copy or disclose without written permission. If you have received this item in error, notify the sender and delete all copies.
The role of divalent (Zn2+/ Mg2+/ Cu2+) substituents in achieving full capacity of sodium layered oxides for Na-ion
battery applications
Journal: Chemistry of Materials Manuscript ID cm-2019-05205e.R3 Manuscript Type: Article
Date Submitted by the Author: n/a
Complete List of Authors: Mariyappan, Sathiya; College de France,
Marchandier, Thomas; Collège de France, Chimie du Solide et de l'Energie
Rabuel, François; Universite de Picardie Jules Verne, Laboratoire de Réactivité et de Chimie des Solides; Réseau sur le Stockage Electrochimique de l’Energie (RS2E)
Iadecola, Antonella; Elletra-Sincrotrone Trieste, Rousse, Gwenaëlle; College de France, UMR8260
Morozov, Anatoly; Skolkovo Institute of Science and Technology, Center for Energy Science and Technology
Abakumov, Artem; Skolkovo Institute of Science and Technology, CEE CREI
Tarascon, Jean-Marie; Universite de Picardie Jules Verne, Laboratoire de Réactivité et de Chimie des Solides
The role of divalent (Zn2+/ Mg2+/ Cu2+) substituents in achieving full capacity of sodium
layered oxides for Na-ion battery applications
Sathiya Mariyappan,*,1,2 Thomas Marchandier,1,3 François Rabuel,2,4 Antonella Iadecola,2
Gwenaëlle Rousse,1,2,3 Anatoly V. Morozov,5 Artem M. Abakumov5 and Jean-Marie Tarascon1,2,3
1Chimie du Solide-Energie, UMR 8260, Collège de France, 75231 Paris Cedex 05, France 2Réseau sur le Stockage Electrochimique de l’Energie (RS2E), FR CNRS 3459, France 3Sorbonne Universités, 4 Place Jussieu, 75005, Paris, France
4Laboratoire de Réactivité et de Chimie des Solides, UMR 7314, Univ. de Picardie Jules Verne, 80039
Amiens Cedex 1, France
5Center for Energy Science and Technology, Skolkovo Institute of Science and Technology, Nobel str. 3,
143026 Moscow, Russia *e-mail: sathiya.mariyappan@college-de-france.fr 3 4 5 6 7 8 9 10 11 12 13 14 15 16 17 18 19 20 21 22 23 24 25 26 27 28 29 30 31 32 33 34 35 36 37 38 39 40 41 42 43 44 45 46 47 48 49 50 51 52 53 54 55
Abstract:
O3 type layered sodium transition metal oxides, e.g. NaNi0.5Mn0.5-zTizO2, having one sodium per
transition metal ion could be attractive positive electrode materials for achieving high energy density sodium-ion batteries provided we can reversibly utilize their full Na content. However, the layered structure on cycling undergoes series of phase transitions in which the fully de-sodiated O1 phase shows huge reduction in cell volume together with cation migration both of which are detrimental for long term cycling performance. Hence, the practical capacity of layered oxides is restricted to solely ~0.5-0.6 Na (oxidation up to ~4 V vs Na+/Na0), avoiding the
complete removal of sodium. Herein, we show that the partial substitution of a redox-active Ni2+
cation by an inactive one (e.g. Zn2+ to form NaNi
0.45Zn0.05Mn0.4Ti0.1O2) suppresses the phase
transitions at high voltage (>4 V vs Na+/Na0), and helps in utilizing the maximum capacity of the
material (170 mAh g-1 with ~0.8 Na) without much degradations upon long cycling. The fully
charged phase (Na0.2Ni0.45Zn0.05Mn0.4Ti0.1O2), as determined by high resolution electron
transmission microscopy, shows P3-O1 intergrowth structure in which the O1 phase is present only locally as nanoscale domains. We believe that the formation of P3-O1 intergrowths in the Zn-substituted material, in contrast to the distinct O1 phase for unsubstituted NaNi0.5Mn0.4Ti0.1O2,
restricts structural degradations during cycling and improves the long term cycling stability. Similar substitution chemistry can be extended to Cu2+, Mg2+ ions as well. The
NaNi0.45Zn0.05Mn0.4Ti0.1O2 positive electrode material on implementation in 18650 Na-ion cells
show electrochemical performances comparable to that of polyanionic Na3V2(PO4)2F3/C cells.
3 4 5 6 7 8 9 10 11 12 13 14 15 16 17 18 19 20 21 22 23 24 25 26 27 28 29 30 31 32 33 34 35 36 37 38 39 40 41 42 43 44 45 46 47 48 49 50 51 52 53 54 55 56
Introduction:
Rechargeable Li-ion batteries are presently powering most portable electronic devices and are also on the run for electric vehicles applications.1,2 However, with the transitioning to clean
energy, better utilization of renewable energy is of paramount importance and hence the need for finding cheaper battery technologies than the Li-ion one as energy storage device for grid applications. In this regard, sodium-ion batteries are considered as one of the most probable contender.3 Nevertheless, the Na-ion battery technology is now only at the demonstration level
and still requires further improvements prior commercialization.4,5 The majority of Na-ion
batteries demonstrated so far utilize hard carbon as negative electrode,6 a sodium salt in organic
solvent as electrolyte,7,8 whereas the positive electrode enlists either layered sodium transition
metal oxides also termed as sodium layered oxides (NaxMO2, x ≤ 1 and M= transition metal
ion(s)),9 poly-anionic compounds (e.g. Na
3V2(PO4)2F3)5 or even Prussian blue analogues10 etc.
Among the listed positive electrode materials, further improvement in capacity is more feasible with sodium layered oxides due to the low molecular weight and their versatile substitution chemistry.11 The layered oxides could be crystalized in O3, O1, P2, P3 etc phases in which
sodium occupies either octahedral (O) or trigonal prismatic (P) sites with the ‘n’ number (1, 2, 3 etc) of MO2- layers requiring to represent the unit cell.12 In all the sodium layered oxides, the
stacking of the MO2- layers exhibits interlayer O-O repulsions which are getting stabilized
exclusively by the screening Na+ ions. Hence removal of Na+ ions during cycling causes
structural instabilities that are highly pronounced when almost all Na+ ions are removed from the
structure, thereby leading to poor cycling performance when attempting to use their full capacity.13,14,15 To circumvent this problem, the sodium layered oxides are used with hardly 50%
3 4 5 6 7 8 9 10 11 12 13 14 15 16 17 18 19 20 21 22 23 24 25 26 27 28 29 30 31 32 33 34 35 36 37 38 39 40 41 42 43 44 45 46 47 48 49 50 51 52 53 54 55
energy which is lower than the present state of the art compound Na3V2(PO4)2F3 (NVPF) for
Na-ion battery applicatNa-ions.4,5,16
To achieve high energy density with sodium layered oxides, it is thus important to utilize their full capacity and hence to stabilize the high voltage phase when almost all sodium is removed from the structure. Recently, our group has reported the feasibility to achieve such stabilization in layered NaNi0.5Mn0.5O2 material by dual substitution of Cu2+ and Ti4+.17,18 The resulting NaNi 0.5-yCuyMn0.5-zTizO2 (x=0.05- 0.1 and z=0.1- 0.2) phase exhibits high energy density with long term
cycling stability. Though Cu2+ was used in small quantities (5-10% of the total transition metal
content), it plays a crucial role in stabilizing the structure in high state of charge, as the Cu-free NaNi0.5Mn0.5-zTizO2 material did not show similar electrochemical performance. Despite the good
electrochemical performance delivered by the Cu-substituted materials, we could not rationalize the role of Cu2+ in stabilizing the high voltage phase. The fully charged phase still demonstrated
majority of O1-type structure with cation migration that is typically considered disadvantageous for good electrochemical stability.17 In such contrasted scenario, the perception was with
Jahn-Teller activity of Cu2+ ion which may have a special role in stabilizing the structure on high
voltage cycling even with cation migrations.17
To check this hypothesis we decided to extend our study to NaNi0.5-yZnyMn0.5-zTizO2 where the
non Jahn-Teller active ion Zn2+ is used instead of Cu2+. The Zn2+ cation has exactly the same
ionic radius (0.73 Å) as that of Cu2+ (0.74 Å), but it is not Jahn-Teller active and redox inactive.
We thus prepared the Zn-substituted NaNi0.45Zn0.05Mn0.4Ti0.1O2 (y = 0.05 and z = 0.1) materials
and reported herein their electrochemistry and structural evolution upon cycling prior to extend our work to Mg-substituted NaNi0.45Mg0.05Mn0.4Ti0.1O2 materials.
3 4 5 6 7 8 9 10 11 12 13 14 15 16 17 18 19 20 21 22 23 24 25 26 27 28 29 30 31 32 33 34 35 36 37 38 39 40 41 42 43 44 45 46 47 48 49 50 51 52 53 54 55 56
Experimental section:
Synthesis: NaNi0.45Zn0.05Mn0.4Ti0.1O2, NaNi0.5Mn0.4Ti0.1O2 and the other sodium layered oxide
phases used in this study were synthesized using solid state synthesis method by mixing stoichiometric amounts of sodium carbonate (Na2CO3, Aldrich), nickel oxide (NiO, Aldrich),
zinc oxide (ZnO, Aldrich)/ copper (II) oxide (CuO, Aldrich)/ magnesium nitrate (Mg(NO3)2.6H2O, Aldrich), manganese (III) oxide (Mn2O3, Aldrich) and titanium (IV) oxide
(TiO2, Aldrich) and calcining at required temperature with intermediate grinding. Mixing of the
precursors was performed by hand grinding for 15 minutes followed by ball milling for an hour using SPEX ball mill with powder to ball ratio of 1:10. The calcination steps were optimized and the optimized protocol consists of three steps heating at 900 °C/12 h, 900 °C/12 h and 1000 °C/12 hours with intermediate grindings. The furnace heating and cooling rates were maintained as 3 °C and 1 °C per minute respectively. The sodium layered oxides thus prepared were stored in the argon filled glove box without exposing it to atmospheric air. Typically the samples were prepared in 1-2 g batches, however the same synthesis condition was used to make 200 g batches of NaNi0.45Zn0.05Mn0.4Ti0.1O2 material for assembling prototype 18650 cells.
Structural and electrochemical characterizations: The purity and structure of the synthesized
materials were analyzed by X-ray powder diffraction (XRD) using BRUKER D8 Advance diffractometer equipped with Cu Kα radiation source (λ Kα1 = 1.54056 Å, λ Kα2 = 1.54439 Å) and
Lynxeye XE detector. Synchrotron X-ray diffraction (SXRD) analyses were performed at the 11-BM beamline (Advanced Photon Source, Argonne National Laboratory) with a wavelength of λ=0.41284 Å. The Rietveld refinements were carried out using Fullprof program.19,20
3 4 5 6 7 8 9 10 11 12 13 14 15 16 17 18 19 20 21 22 23 24 25 26 27 28 29 30 31 32 33 34 35 36 37 38 39 40 41 42 43 44 45 46 47 48 49 50 51 52 53 54 55
The phase pure materials were analyzed for their sodium reactivity by testing them in Swagelok-type half cells using metallic sodium as counter electrode and in coin Swagelok-type (2032) full cells using hard carbon counter. The hard carbon powder was purchased from Aekyung Petrochemical, Republic of Korea (average particle size= 9 µm and BET surface area = 3.29 m²·g-1) and coated
on Al foil with the mass loading of 5-6 mg cm-2. For the coating, the slurry was made using hard
carbon, 4 w/w % conducting carbon (C45) and 4 w/w % polyvinylidine fluoride (PVDF) binder in N-methyl-2-pyrrolidone (NMP).
In contrast, the positive electrode was used as loose powder in both half-cell and in coin type full cells without any binder and just after mixing with 15% super P carbon from TIMCAL as conducting additive. The mixing of sodium layered oxide positive electrode (85%) and super P carbon black (15%) was done using a SPEX ball mill with the powder to ball ratio of 1:25 for 30minutes. The electrolyte used was 1M sodium hexafluoro phosphate (NaPF6) in propylene
carbonate (PC) solvent. Whatman GF/D borosilicate glass fiber separators were used for both half cells and full cells. The NaNi0.45Zn0.05Mn0.4Ti0.1O2 material alone was tested in prototype
18650 cells and the cell assembly is described in supplementary note 1.17 The assembled cells
were cycled at C/10 rate (the capacity for removing one sodium is taken as 1C) within the voltage window of 2- 4.5 V for half cells and 1.2- 4.4 V for full cells, using Bio-Logic (France) potentiostat/galvanostat. The high oxidation potential of 4.4/ 4.5 V was used to remove almost all sodium ions from the structure and to realize the full capacity of the material.
The structural evolutions of the materials during cycling were followed by operando XRD analysis using an home-made XRD cell with Be window as a current collector as explained elsewhere.21 Half cells were made using sodium metal negative electrode and the cells were
cycled at C/30 rate from OCV to 4.5 V and maintained at 4.5 V at constant voltage mode
(CC-3 4 5 6 7 8 9 10 11 12 13 14 15 16 17 18 19 20 21 22 23 24 25 26 27 28 29 30 31 32 33 34 35 36 37 38 39 40 41 42 43 44 45 46 47 48 49 50 51 52 53 54 55 56
CV cycling protocol) till the residual current becomes 1/100th of the current used for cycling. The
XRD patterns were recorded for every 1.5 hours that corresponds to the removal of 0.05 Na from the structure.
Transmission electron microscopy analysis:
The transmission electron microscopy (TEM) analyses were carried out for the pristine and de-sodiated samples prepared by charging the layered oxides in Na-metal half cells to 4.5 V at C/20 rate. After charge, the cells were immediately transferred to the glove box, disassembled to collect the charged samples, which were washed with dry dimethyl carbonate (DMC) to remove the electrolyte, subsequently dried in vacuum (in antechamber) overnight. The dried samples were dispersed in DMC and deposited onto holey carbon grids; the carbon grids with the sample were transferred to the TEM column using a vacuum transfer holder to avoid air exposure. Selected area electron diffraction (SAED) patterns, high angle annular dark field scanning TEM (HAADF-STEM) images and STEM-EDX compositional maps were obtained with an aberration-corrected Titan Themis Z electron microscope operated at 200 kV and equipped with a Super-X system for energy-dispersive X-ray (EDX) analysis.
X-ray absorption spectroscopy analysis:
Self-standing films consisting of 80 % active material, 15 % Super P carbon, and 5 % polytetrafluoroethylene (PTFE) binder were cycled to the desired state (charging to 4 V, 4.5 V and 1 cycle by charging to 4.5 V followed by discharging to 1.5 V). The cycled electrodes were washed with dimethyl carbonate, dried under vacuum, and then placed between two layers of Kapton tape and sealed under argon atmosphere in an air-tight transparent plastic bag. Ex situ XAS measurements at the transition metal (Ti, Mn, Ni and Zn) K-edge were performed in a
3 4 5 6 7 8 9 10 11 12 13 14 15 16 17 18 19 20 21 22 23 24 25 26 27 28 29 30 31 32 33 34 35 36 37 38 39 40 41 42 43 44 45 46 47 48 49 50 51 52 53 54 55
transmission mode at the ROCK beamline22 of synchrotron SOLEIL (France) using a Si (111)
channel-cut quick-XAS monochromator with 2 Hz oscillating frequency. Three consecutive ionization chamber filled with 30 ml of N2 were used as detectors. The sample was placed
between the first and the second ionization chamber. The energy calibration was established with simultaneous absorption measurements on transition metal foil placed between the second and the third ionization chamber. The energy calibration as well as the normalization was done using Demeter package.23 Some references were used to probe the Mn and Ni oxidation states such as
NiO, LiNiO2, LiNi1/3Mn1/3Co1/3O2, Li2MnO3, TiO2 and ZnO. Results and discussions:
The O3 sodium layered oxide NaNi0.45Zn0.05Mn0.4Ti0.1O2 termed ZNMT hereafter, was
synthesized by solid state synthesis from a mixture of corresponding transition metal oxides and sodium carbonate in stoichiometric ratio that was calcined at various temperatures for different annealing times with intermediate grindings so as to identify the optimum conditions. Figure 1a shows the evolution of X-ray diffraction (XRD) patterns of the ZNMT materials as a function of time and temperature.
The material after calcination at 900 °C for 12 hours shows broad peaks indicating the possibility of having multiple phases with close lattice parameters. Repeating the calcination at 900 °C for 12 more hours (marked 900 °C/24 h in the XRD), sharpens the XRD peaks that they can all be indexed with R-3m space group (O3 phase, Supporting Figure S1) with the unit cell lattice a = 2.9735(3) and c = 16.0236(1) Å. Small peaks due to cubic metal oxide impurities (marked by asterisk in Figure 1a) started to appear and is deduced to be nearly 1 wt. % by Rietveld refinement (Supporting Figure S1).
3 4 5 6 7 8 9 10 11 12 13 14 15 16 17 18 19 20 21 22 23 24 25 26 27 28 29 30 31 32 33 34 35 36 37 38 39 40 41 42 43 44 45 46 47 48 49 50 51 52 53 54 55 56
Figure 1: Synthesis optimization of ZNMT material. (a) Powder XRD pattern of the ZNMT material calcined at different temperature and calcination period, the black vertical line in the figure is used as a guide to eyes to see the shift in (00l) peak upon increasing the calcination temperature/time. The XRD pattern of the NMT material prepared at 900 °C/24 h is shown in figure for comparative purpose. (b,c) HAADF-STEM image
3 4 5 6 7 8 9 10 11 12 13 14 15 16 17 18 19 20 21 22 23 24 25 26 27 28 29 30 31 32 33 34 35 36 37 38 39 40 41 42 43 44 45 46 47 48 49 50 51 52 53 54 55
together with the compositional EDX maps of Mn, Ni, Ti, Zn and the color-coded mixed compositional map of ZNMT-900 and ZNMT-1000 materials, where the (Ni,Zn)O impurity is clearly seen in the ZNMT-1000 sample.
Upon further heating NaNi0.45Zn0.05Mn0.4Ti0.1O2 to 1000 °C for 12 hours and more, the (00l) peak
shifts to lower angle, indicative of an increase in c lattice parameter due to possible loss of sodium at high temperature calcinations. The sodium loss on heating of the 900 °C/24 h sample to 1000 °C is calculated to be ~1 wt. % by thermogravimetric analysis (TGA, Supporting Figure S2) and it increases with calcination temperature and time. Therefore, the materials prepared at 1000 °C/24 h and 1100 °C/12 h show secondary layered phase with relatively lower sodium content (marked by arrow in Figure 1a) and consequently were not used for further studies. Next, we compared the XRD patterns of the ZNMT materials with that of Zn2+ un-substituted
NaNi0.5Mn0.4Ti0.1O2 (NMT) prepared exactly in the same experimental conditions. The observed
structural evolution as function of temperature and time is alike that for ZNMT (See Supporting Figure S3) and the XRD pattern of the pure phase NMT phase prepared at 900 °C/24 h is shown in Figure 1 for comparison purpose. We barely note a small increase in lattice parameters upon Zn2+ substitution (a = 2.9683(6), c = 15.981(6) Å for NMT and a = 2.9735(3), c = 16.0236(1) Å
for ZNMT) which is not significant enough to confirm the Zn2+ substitution into the NMT
material. Increasing the Zn concentration to 0.1 (NaNi0.4Zn0.1Mn0.4Ti0.1O2) also does not show
visible difference in the XRD pattern (Supporting Figure S4). So, we have decided to test the incorporation of Zn into the NaNi0.5Mn0.4Ti0.1O2 materials by elemental mapping in high
resolution transmission electron microscope (TEM).
The pure phase ZNMT (NaNi0.45Zn0.05Mn0.4Ti0.1O2) materials synthesized at 900 °C/24 h
(ZNMT-900) and 1000 °C/12 h (ZNMT-1000) were examined by HAADF-STEM analysis (Supporting Figure S5). An increase in particle size is observed in moving from ZNMT-900 to
3 4 5 6 7 8 9 10 11 12 13 14 15 16 17 18 19 20 21 22 23 24 25 26 27 28 29 30 31 32 33 34 35 36 37 38 39 40 41 42 43 44 45 46 47 48 49 50 51 52 53 54 55 56
ZNMT-1000 due to the increase in calcination temperature, however both the materials show crystalline O3 phase (Supporting Figure S5) with a very homogeneous distribution of transition metals Zn, Ni, Mn and Ti (Figure 1b and 1c) confirming that Zn has entered into the crystal structure. Yet, small crystallites of Zn-substituted NiO admixture are seen in the ZNMT-1000 sample, indicating that the cubic metal oxide impurities observed in the XRD pattern are due to Zn-substituted NiO24 and is found to be ~6 wt.% by Rietveld refinement (supporting figure S6).
The Zn substituted ZNMT-900 and ZNMT-1000 are further studied for their electrochemistry. Electrochemical performance of ZNMT and NMT:
Electrochemical analyses were done in half cells (Supporting Figure S7) using sodium metal negative electrode and in Na-ion full cells (Figure 2a) using hard carbon negative electrode (See Supporting Figure S8 for hard carbon cycling). The voltage vs composition profile for ZNMT-900 and ZNMT-1000 in Na-ion full cells are shown in Figure 2a (left) along with the corresponding capacity retention plots (right).
3 4 5 6 7 8 9 10 11 12 13 14 15 16 17 18 19 20 21 22 23 24 25 26 27 28 29 30 31 32 33 34 35 36 37 38 39 40 41 42 43 44 45 46 47 48 49 50 51 52 53 54 55
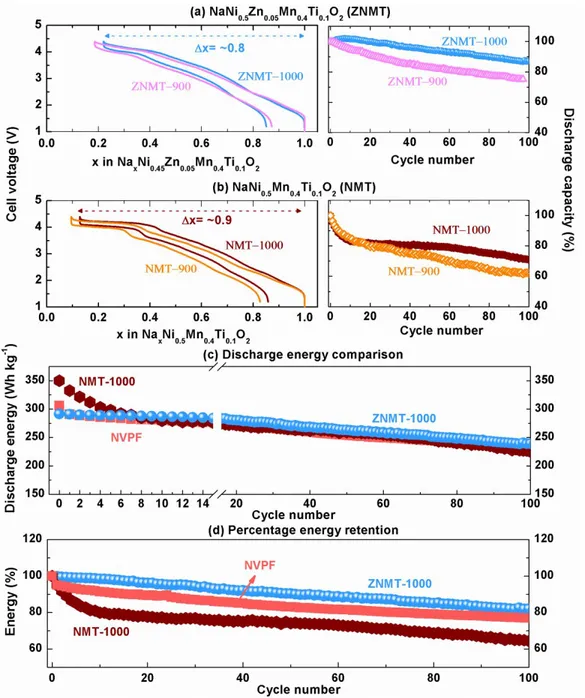
Figure 2: Electrochemical performance of ZNMT and NMT. (a,b) left, Galvanostatic charge- discharge cycle of (a) ZNMT and (b) NMT materials synthesized at two different synthesis conditions (900 °C/24 h mentioned as 900 and re-annealed 1000 °C/12 h mentioned as 1000), in Na-ion full cells using hard carbon negative electrode and cycled at C/10 rate within the voltage window of 1.2- 4.4 V; and the corresponding capacity retention plots in the right. The specific discharge capacity of 177, 178, 165 and 152 mAh g-1 is used as 100%
capacity for NMT-900, NMT-1000, ZNMT-900 and ZNMT-1000 respectively. The materials ZNMT-1000 and NMT-1000 that show best capacity retention is compared together for their (c) discharge specific energy and the (d) percentage energy retention. The polyanionic NVPF is used here as a benchmark compound for cycling stability and the specific energy of the NVPF/C cell is compared with that for the NMT-1000 and ZNMT-1000 materials. All energy values are normalized for the total weight of positive and negative active materials to have uniform comparison.
3 4 5 6 7 8 9 10 11 12 13 14 15 16 17 18 19 20 21 22 23 24 25 26 27 28 29 30 31 32 33 34 35 36 37 38 39 40 41 42 43 44 45 46 47 48 49 50 51 52 53 54 55 56
Both ZNMT-900 and ZNMT-1000 samples show nearly 0.8 Na removals on first charge with however a repeatedly and slightly lower removal for ZNMT-1000. The difference is mainly due to the relatively lower sodium content in the high temperature calcined material (ZNMT-1000) as is observed by the less capacity (0.2 Na, 48 mAh g-1 for ZNMT-1000 and 0.25 Na, 60 mAh g-1
for ZNMT-900) obtained in the low voltage plateau (Supporting Figure S7). Besides the smaller initial capacity (187 mAh g-1 for ZNMT-1000 vs 195 mAh g-1 for ZNMT-900), ZNMT-1000
material show better capacity retention on long cycling, retaining nearly >85% of the initial capacity after 100 cycles in comparison to the ~75% capacity retention with ZNMT-900 sample. The possible reason could be the smaller particle sizes as observed with TEM (Figure 1b) in the low temperature synthesized material (ZNMT-900), which may induce more side reactions of the electrolyte at high voltages, thereby deteriorating long cycling performance. Whatever, a similar trend is observed with NMT material (Figure 2b) as well, in which NMT-1000 with some NiO impurity show better cycling retention than NMT-900. For simplicity reason and for concise comparison of the electrochemical performance of the materials with and without Zn substitution, from now on we solely focus on high temperature synthesized samples NMT-1000 and ZNMT-1000 and the terms ZNMT and NMT used hereafter represent the materials ZNMT-ZNMT-1000 and NMT-1000, unless otherwise mentioned.
Figure 2c and 2d compares the discharge specific energy and the percentage retention of NMT with that of ZNMT. NMT shows high initial discharge energy due to the removal of more sodium from the structure (0.9 Na for NMT vs 0.8 for ZNMT) during charge. As expected, ZNMT in which the redox active Ni2+ ion is substituted by a redox inactive Zn2+ ion (see Supporting Figure
S9 for XAS data) shows reduced capacity (charge/discharge capacity of 214/179 mAh g-1 for
NMT vs 187.5/152 mAh g-1 for ZNMT) and hence reduced energy (charge/discharge energy of
3 4 5 6 7 8 9 10 11 12 13 14 15 16 17 18 19 20 21 22 23 24 25 26 27 28 29 30 31 32 33 34 35 36 37 38 39 40 41 42 43 44 45 46 47 48 49 50 51 52 53 54 55
433/350 Wh kg-1 for NMT and 368/291 Wh kg-1 for ZNMT; energy calculated for total weight of
positive and negative active material weight). However, the energy of the NMT material drops abruptly within the first 10 cycles and become lower than that for ZNMT. The derivative plot in Supporting Figure S10 shows a sharp redox peak above 4 V that is reminiscent of a two-phase process. Its intensity reduces continuously upon cycling, indicating that the high voltage redox process is the main source of capacity degradation. This is in contrast with ZNMT, which shows a broad redox peak around 4.2 V that neatly superimposes upon cycling. Lastly, the ZNMT material exhibits much better cycling retention by retaining ~85% of its initial energy after 100 cycles in contrast to just ~65% for the NMT material (Figure 2b and 2c). Overall, the energy and cycling retention of ZNMT is comparable with that of polyanionic Na3V2(PO4)2F325 (marked as
NVPF in Figure 2c and 2d and see Supporting Figure S11 for the cycling curve) which is used as a benchmark compound in this study. Altogether, the 5% Zn2+ substitution in the NMT material
improves the structural stability upon sodium removal, mainly when the charge cutoff cycling voltage exceeds 4 V.
Structural evolutions of ZNMT and NMT:
To follow the role of Zn2+ in controlling the structural evolution of the material, we studied both
NMT and ZNMT phases in Na-half cells by operando XRD analyses, and the results are compared in Figure 3 with the interlayer distance evolution reported in Supplementary Figure S12. Both ZNMT and NMT show nearly similar phase evolution till 4 V (region I: O3 O’3 P3 biphasic processes and region II: P3 solid solution), with the difference being the shortened biphasic processes (region I) and increased P3 solid solution behavior (region II) for the ZNMT material compared to NMT. The O3 O’3 P3 phase transitions observed here below 4 V were heavily discussed in the literature for many other O3-type sodium layered oxide materials
3 4 5 6 7 8 9 10 11 12 13 14 15 16 17 18 19 20 21 22 23 24 25 26 27 28 29 30 31 32 33 34 35 36 37 38 39 40 41 42 43 44 45 46 47 48 49 50 51 52 53 54 55 56
and they won’t be addressed here.15,26 We rather focus mainly on the region III (above 4 V)
where a major difference is observed between NMT and ZNMT materials.
Figure 3: Operando XRD analysis of (a) ZNMT and (b) NMT materials. The XRD pattern evolutions during first charge are shown on the right and the corresponding cycling curves in the left. The cells are cycled at C/30 rate followed by constant voltage period and XRD pattern was recorded for every 1.5hours; nearly 0.84 Na+ was removed from ZNMT material whereas ~0.95 Na+ was removed from NMT after constant current-
constant voltage cycling. The important structural changes are marked as region I, II, III, and the appearance of end of charge phase of NMT with small unit cell is marked by an arrow in Figure 3b.
3 4 5 6 7 8 9 10 11 12 13 14 15 16 17 18 19 20 21 22 23 24 25 26 27 28 29 30 31 32 33 34 35 36 37 38 39 40 41 42 43 44 45 46 47 48 49 50 51 52 53 54 55
Within the region III clear biphasic processes are observed for NMT material as opposed to a complex structural evolution for ZNMT, with namely the presence of broad peaks whose intensity decreases as Na is removed. More precisely, upon cycling of NMT material above 4 V a new peak starts to appear around 2 = 42° (marked by blue circle in Figure 3b) which resembles the (104) peak of the pristine O3 phase. Concomitantly, the (003) peak also shifts to higher angles indicating a reduction in the c unit cell parameter (see Supporting Figure S12 and S13). This leads us to suspect a phase transition from P3 (region II) to an O-type structure, most possibly O3, in the region III. The stability of the P3 structure is claimed to be rooted in the reduction of Na-Na repulsion by a zig-zag type Na-vacancy ordering till 0.5Na in the structure.27
Upon further sodium removal, the Na-Na repulsion is negligible and hence the O3-type structure with reduced O-O repulsion is preferred leading to shrinking of the structure along c axis, as observed. Pushing further the oxidation towards the end of the region III, a new phase starts to appear (new peak at 2 = 20°, marked by an arrow in Figure 3b) with the associated disappearance of the peak at 42°. The appearance of the peak at 2 = 20° indicates that the end-of-charge phase has a very small unit cell and is indexed with an O1-type structure (see the Supporting Figure S14). Such structural transition to O1 phase leads to a huge reduction in unit cell volume on moving from pristine Na1Ni0.5Mn0.4Ti0.1O2 (V/Z= 40.61(5) Å3) to
Na0.05Ni0.5Mn0.4Ti0.1O2 (V/Z= 30.15(3) Å3), which is most likely be the origin of poor cycling
performance of NMT at high voltage.
In contrast, the ZNMT material shows over the same voltage domain a shift of the (003) peak from 2 = 16° to 18° (instead from 16° to 20° for NMT) signifying overall a smaller change in unit cell volume upon cycling, hence better structural reversibility and higher capacity retention. However, for securing our observation owing to complex Na-driven structural evolution in these
3 4 5 6 7 8 9 10 11 12 13 14 15 16 17 18 19 20 21 22 23 24 25 26 27 28 29 30 31 32 33 34 35 36 37 38 39 40 41 42 43 44 45 46 47 48 49 50 51 52 53 54 55 56
compounds we decided to study both the oxidized Na0.1Ni0.5Mn0.4Ti0.1O2 (NMT) and
Na0.2Ni0.5Zn0.05Mn0.4Ti0.1O2 (ZNMT) phases by HAADF-STEM analysis and the results are
shown in Figure 4.
Both samples ZNMT (Figure 4a) and NMT (Figure 4f) show cracked morphology. The SAED patterns of ZNMT consist of the set of bright reflections streaked along the c* axis and diffuse spots (Figure 4b, 4c). The bright reflections can be indexed with the P3 R3m crystal structure with a 2.8 Å, c 16.2 Å. The diffuse spots (marked with arrowheads in the [010] ED pattern) indicate the presence of the domains with the O1 crystal structure. From the [010] HAADF-STEM image in Figure 4d we can deduce that the ZNMT crystals are built of the domains of the P3 and O1 structures. The domains are just few unit cell in width (sometimes – only a single layer) forming a nanoscale intergrowth. A characteristic feature of the O1 domains is the pronounced transition metal cation migration into the interlayer octahedral interstices, whereas in the P3 domains the cationic migration to the trigonal prismatic cavities is essentially suppressed. The P3-type layers are easily discernible from the O1-type layers by the lateral shifts of the bright dots of the transition metal columns (Figure 4e) and larger interlayer spacing of ~5.4 Å compared to ~ 4.7 Å in the O1 domains. Presence and absence of the transition metal cations in the interlayer cavities of the O1 and P3 domains, respectively, can also be traced with the HAADF intensity profiles across the layers (Figure 4e). The P3-O1 transformation and shrinkage of the interlayer distance apparently causes strong mechanical strain which results in numerous cracks in the ZNMT crystallites (Figure 4a). Strain also causes exfoliation at the crystal surface resulting in rolling the layers up (Supporting Figure S15).
3 4 5 6 7 8 9 10 11 12 13 14 15 16 17 18 19 20 21 22 23 24 25 26 27 28 29 30 31 32 33 34 35 36 37 38 39 40 41 42 43 44 45 46 47 48 49 50 51 52 53 54 55
Figure 4: TEM analyses of the ZNMT and NMT materials at the end of charge with the stoichiometry, Na0.2Ni0.45Zn0.05Mn0.4Ti0.1O2 and Na0.1Ni0.5Mn0.4Ti0.1O2, respectively. (a, f) The particle’s morphology, (b, c and
g, h), electron diffraction patterns and (d and i, j) [010] HAADF- STEM images are compared in parallel for both the systems. The O1 domains in the P3-O1 intergrowth of ZNMT are shown by white brackets in (d) and the P3 phase observed in some particles of the oxidized NMT is shown by white brackets in (j). (e) The zoomed part of the HAADF-TEM image of ZNMT material to show the P3-O1 intergrowths. The lateral displacement of the layers (absent in O1 and present in P3 domains) is traced with the vertical white line in the image. The HAADF-intensity profile taken across the layers in (e) shows the presence of migrated transition metal ions in the O1 region and its absence in P3 region with large inter layer spacing (marked with black arrowhead).
3 4 5 6 7 8 9 10 11 12 13 14 15 16 17 18 19 20 21 22 23 24 25 26 27 28 29 30 31 32 33 34 35 36 37 38 39 40 41 42 43 44 45 46 47 48 49 50 51 52 53 54 55 56
In contrast to the SAED patterns of ZNMT, those of the NMT sample are indexed with the hexagonal unit cell with a 2.8 Å, c 4.7 Å, characteristic of the O1 crystal structure (Figure 4g and 4h). The reflections are elongated along c* indicating highly strained structure. Diffuse intensity along c* is also present. [010] HAADF-STEM images of NMT (Figure 4i and 4j) indeed demonstrate large areas of the O1 structure (Figure 4i) with the pronounced transition metal cation migration into the octahedral interlayer cavities. The intergrowth of the P3 and O1 domains is also present, but the size of the P3 domains is much larger compared to that in the ZNMT sample encountering dozens of nanometers (Figure 4j). As in the ZNMT sample, the crystallites in the NMT sample undergo exfoliation of the layers and mechanical cracking (Supplementary Figure S15). Summarizing the results of TEM investigation, the charged ZNMT samples consists of nanosized (few unit cells) domains of the P3 and O1 structures where the P3 structure prevails. In contrast, the NMT sample reveals clearly a biphasic reaction in which the O1 structure dominates but the P3 structure is also found in a form of extended domains few dozens of nm in width.
Stabilizing role of Zn2+ ion:
Altogether, complete removal of sodium from the NMT and ZNMT layered oxides leads to O1 phase which is accompanied with transition metal cation migration into the interlayer space. However, the formation of O1 phase with NMT occurs through a biphasic process enlisting a huge reduction in cell volume which upon repeated cycling becomes detrimental for the material capacity retention. In contrast, the formation of O1 phase does not extend as much with ZNMT since the complete removal of sodium is not possible due to the limited availability of the Ni2+/Ni4+ redox. Thus, instead of forming a distinct O1 phase, the fully charged ZNMT (Na =
3 4 5 6 7 8 9 10 11 12 13 14 15 16 17 18 19 20 21 22 23 24 25 26 27 28 29 30 31 32 33 34 35 36 37 38 39 40 41 42 43 44 45 46 47 48 49 50 51 52 53 54 55
additionally a diminution of the cation migration owing to the presence of trigonal prismatic sites in the P3 phase that are unfavorable for accommodation of small 3d cations.
The difference in the Na-driven removal process, which enlists at high potential a biphasic region for NMT as opposed to domain structure formation with Zn-substitution in the case of ZNMT, is not yet fully understood. The redox inactive Zn2+, may specifically retain Na close to (Zn2+O
6)
-octahedra compared to the highly oxidized (Ni4+/Mn4+/Ti4+O
6)’- octahedra for charge neutrality
that may act as a pillar to avoid layer gliding and phase transitions as is reported with some lithium layered oxides. However, we do not have a solid proof for such scenario. We can solely ascertain that Zn plays a main role in driving the redox mechanism from biphasic to P3-O1 domain intergrowths, as we observed similar changes by Zn-substitution in Ti-free NaNi0.5Mn0.5O2 or in Ti-based NaNi0.5Mn0.3Ti0.2O2 (Supporting Figure S16 and S17). However,
let’s recall that Zn is not unique in triggering this P3-O1 domain formation since an overall similar behavior was obtained in our previous study with Cu-substitution as well. Interestingly, there are several literature reports with P2/P3/O3 sodium layered oxides showing improved cycling performance upon Cu2+ / Mg2+ / Zn2+ substitutions27-32 and nearly similar results were
stated with layered lithium transition metal oxides as well where 5% Mg substitution in LiNiO2/
Li(Ni,Co)O2 proved to increase the structural stability on high voltage cycling.33,34 Altogether,
these results show that the combined change in redox and structural stability mechanism observed here is not specific to the nature of the divalent substituent (Zn or Cu). So, we decided to extend our study for another M2+ substituent, Mg2+, having the same ionic radius as that of Zn2+ ion
(0.73 Å) while keeping the host lattice the same as NaNi0.5Mn0.4Ti0.1O2, and benchmark our
electrochemical performances to that of Cu- and Zn-substituted ones.
3 4 5 6 7 8 9 10 11 12 13 14 15 16 17 18 19 20 21 22 23 24 25 26 27 28 29 30 31 32 33 34 35 36 37 38 39 40 41 42 43 44 45 46 47 48 49 50 51 52 53 54 55 56
The 5% Cu-substituted NaNi0.45Cu0.05Mn0.4Ti0.1O2 (CNMT), 5% Mg-substituted
NaNi0.45Mg0.05Mn0.4Ti0.1O2 (MNMT), ZNMT and NMT were synthesized together under same
experimental conditions (e.g, three steps calcination 900 °C/12 h, 900 °C/12 h and 1000 °C/12 h with intermediate grindings) and their electrochemical characterization is reported in Figure 5.
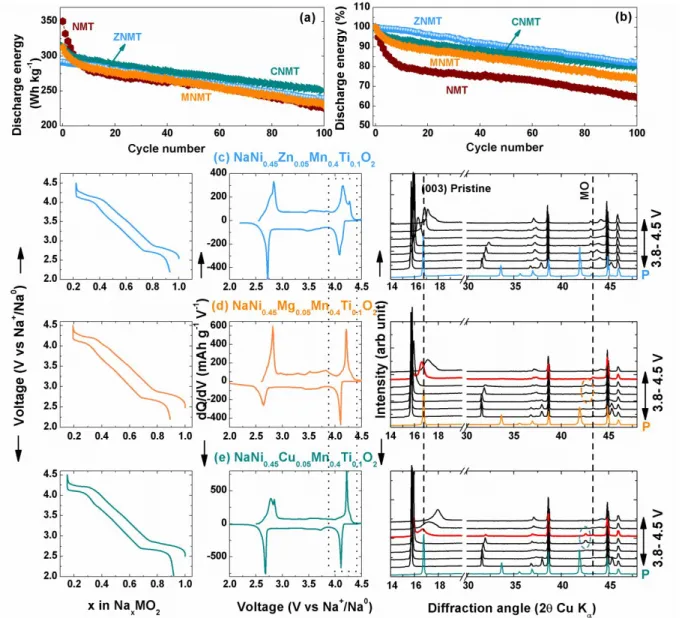
Figure 5: Comparison of Zn2+ (ZNMT), Mg2+ (MNMT) and Cu2+ (CNMT) substituents in stabilizing the high
voltage phase and the cycling stability. (a, b) specific energy and percentage retention plots of substituted with different substituents and bare NMT. The data are collected in Na-ion full cells with the layered oxide positive electrode and hard carbon negative electrode. The cells are cycled at C/10 rate within the voltage window of 1.2- 4.4 V and the energy values are normalized for the total mass of positive and negative electrode active materials. (c, d and e) Composition vs voltage plot (left) with the corresponding derivative plot (middle) and the XRD evolution in the high voltage cycling in comparison with the pristine of ZNMT, MNMT and CNMT
3 4 5 6 7 8 9 10 11 12 13 14 15 16 17 18 19 20 21 22 23 24 25 26 27 28 29 30 31 32 33 34 35 36 37 38 39 40 41 42 43 44 45 46 47 48 49 50 51 52 53 54 55
respectively. The cycling data reported in c, d and e are from Na-metal half-cells and the XRD patterns are derived from operando experiments by cycling the Na-half-cells at C/30 rate.
All the Zn2+/ Cu2+/ Mg2+ substituted materials show better cycling retention (Figure 5a, b) than
bare NMT. Additionally, from their corresponding XRD patterns (Figure 5c, d and e right) we can note a common small shift of the (003) peak between the pristine and fully charged sample, hence implying a small volume change for all of them. Nevertheless, a difference in cycling behavior is observed between Cu/ Zn and Mg as substituents, with CNMT and MNMT materials showing plateau like behavior around 4.2 V corresponding to the sharp redox peak marked by dotted rectangle in the derivative plots in middle. By further exploiting the XRD evolution, we could spot subtle differences in the plateau region (>4 V), where CNMT and MNMT materials show a small biphasic region, as witnessed by the appearance of new peaks around 2= 42° (shown by circles) and also by the XRD pattern in red showing two peaks with different d for (003) reflection. The difference with CNMT could be related with the 1e- redox process of Cu2+
(Cu2+/Cu3+ as observed by EPR analysis in Ref.17) that increases the total amount of Na that can
be removed from the structure (~0.85 for CNMT vs ~0.8 for ZNMT), hence the O1 domains.17
However, with the Mg2+ substitution, which is fully redox inactive alike Zn2+ such a difference is
at first surprising. However, we must bear in mind that Mg2+ (free of d levels) does not similarly
affect the material electronic structure as Zn2+ with full d10 shell, which for instance can enlist -p
bonding with surrounded oxygens. Along that line, one would expect an easier migration of Mg2+
than that of Zn2+ ions. DFT calculations are here sorely needed to confirm our cation migration
and more so how the phase transition to O1 phase at high potential and cation migrations are interrelated. 3 4 5 6 7 8 9 10 11 12 13 14 15 16 17 18 19 20 21 22 23 24 25 26 27 28 29 30 31 32 33 34 35 36 37 38 39 40 41 42 43 44 45 46 47 48 49 50 51 52 53 54 55 56
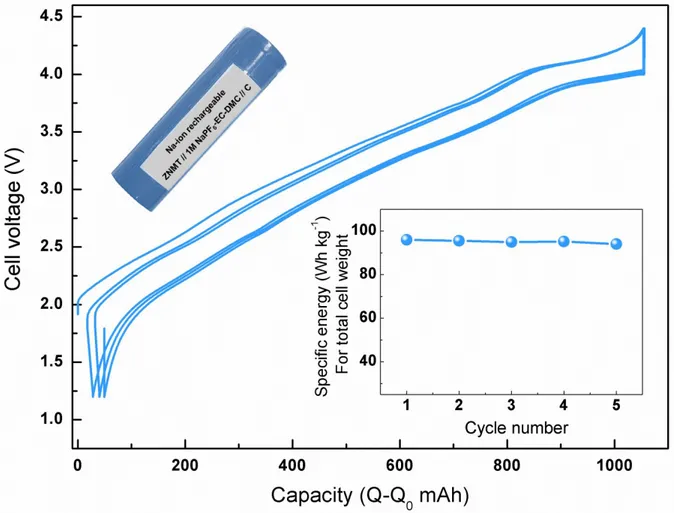
Figure 6: Galvanostatic charge-discharge cycles of NaNi0.45Zn0.05Mn0.4Ti0.1O2/C Na-ion cell in the 18650
cylindrical model. The 3-5 cycles after the first two formation cycles are shown in Figure. The inset shows the image of the assembled 18650 cell (top) and the specific energy normalized for the total cell weight including all cell components (bottom). Refer supplementary note 1 for the complete cell assembly procedure and cycling conditions.
To comfort such a finding practical-wise the ZNMT material was also tested in prototype 18650 cells having a hard carbon negative electrode (Supporting Figure S8) and the initial results even prior the optimization of cell assembly (Supplementary note 1) are very promising with specific energy close to ~100 Wh kg-1 (for the total cell weight) comparable to the state-of-the-art
NVPF/C cells (105- 110 Wh kg-1). Moreover, the material processing is not very demanding due
to the comparable stability of the ZNMT on exposure to moist air (Supporting Figure S18); a property that is not shared by non-substituted NMT materials. The results altogether, provide us with better hope for tuning the electrochemistry of sodium-layered oxides by carefully selecting
3 4 5 6 7 8 9 10 11 12 13 14 15 16 17 18 19 20 21 22 23 24 25 26 27 28 29 30 31 32 33 34 35 36 37 38 39 40 41 42 43 44 45 46 47 48 49 50 51 52 53 54 55
the transition metal ions chemistry (see supplementary note 2 for comparison of different sodium layered oxides), and we believe that the understandings made in the present work will help in designing the suitable sodium layered oxide compounds for the next generation of Na-ion batteries.
Conclusions:
Utilization of full capacity and achieving the theoretical energy of sodium layered oxides has been challenging for some time because of the detrimental aspect upon long term cycling of the high voltage-driven phase transitions. However, through our previous study on Cu substitution and the present one with Zn, we have demonstrated the feasibility to achieve the full capacity of the sodium layered oxides by reducing the phase transitions and the huge changes in unit cell volume during cycling. Indeed, the herein reported O3 type NaNi0.45Zn0.05Mn0.4Ti0.1O2 is found to
exhibit an specific energy equivalent to that of polyanionic compound Na3V2(PO4)2F3, however
with the added advantage of being cheaper and less toxic. Thus, by carefully selecting the transition metal stoichiometry and using the proper substituents especially to stabilize the high voltage phase, it is possible to design sodium layered oxides that out performs the polyanionic compounds for Na-ion battery applications. Our optimism prevails because such reported substitution chemistry is not restricted to Zn but can be extended to other non-redox active M2+
ion such as Cu2+, Mg2+ etc., however, caution has to be taken in selecting the dopant and
optimizing the synthesis conditions to have the best electrochemical performance. Associated Content *S Supporting Information 3 4 5 6 7 8 9 10 11 12 13 14 15 16 17 18 19 20 21 22 23 24 25 26 27 28 29 30 31 32 33 34 35 36 37 38 39 40 41 42 43 44 45 46 47 48 49 50 51 52 53 54 55 56
The Supporting Information containing XRD patterns, crystallographic details and electrochemical analyses is available free of charge on the ACS Publications website.
Acknowledgements:
J.-M.T. acknowledges the funding from European Research Council (ERC) (FP/2014)/ERC Grant-Project 670116-ARPEMA. AICF of Skoltech is acknowledged for granting access to the TEM facilities. XAS experiments were performed on the ROCK beamline (financed by the French National Research Agency (ANR) as part of the “Investissements d’Avenir” program (reference: ANR-10-EQPX-45)) at SOLEIL Synchrotron, France under proposal #20190596. This work used resources of the Advanced Photon Source (11-BM), a U.S. Department of Energy (DOE) Office of Science User Facility operated for the DOE Office of Science by Argonne National Laboratory under Contract No. DE-AC02-06CH11357. The Energy hub, Amiens is acknowledged for granting access to the prototype cell assembly facilities. The Zn substituted sodium layered oxides reported here is patented with the patent application number: 19305827.8-1108
References:
(1) Scrosati, B. Power Sources for Portable Electronics and Hybrid Cars: Lithium Batteries and Fuel Cells. Chem. Rec. 2005, 5 (5), 286–297. https://doi.org/10.1002/tcr.20054.
(2) Dunn, J. B.; Gaines, L.; Kelly, J. C.; James, C.; Gallagher, K. G. The Significance of Li-Ion Batteries in Electric Vehicle Life-Cycle Energy and Emissions and Recycling’s Role in Its Reduction. Energy Environ. Sci. 2015, 8 (1), 158–168. https://doi.org/10.1039/C4EE03029J. (3) Ponrouch, A.; Palacín, M. R. Post-Li Batteries: Promises and Challenges. Philos. Trans.
R. Soc. Math. Phys. Eng. Sci. 2019, 377 (2152), 20180297.
https://doi.org/10.1098/rsta.2018.0297. 3 4 5 6 7 8 9 10 11 12 13 14 15 16 17 18 19 20 21 22 23 24 25 26 27 28 29 30 31 32 33 34 35 36 37 38 39 40 41 42 43 44 45 46 47 48 49 50 51 52 53 54 55
(4) Deng, J.; Luo, W.-B.; Chou, S.-L.; Liu, H.-K.; Dou, S.-X. Sodium-Ion Batteries: From Academic Research to Practical Commercialization. Adv. Energy Mater. 2018, 8 (4), 1701428. https://doi.org/10.1002/aenm.201701428.
(5) A Battery Revolution in Motion- CNRS news by Laure Cailloce (11.27.2015). https://news.cnrs.fr/articles/a-battery-revolution-in-motion. (accessed 30 January, 2020).
(6) Komaba, S.; Murata, W.; Ishikawa, T.; Yabuuchi, N.; Ozeki, T.; Nakayama, T.; Ogata, A.; Gotoh, K.; Fujiwara, K. Electrochemical Na Insertion and Solid Electrolyte Interphase for Hard-Carbon Electrodes and Application to Na-Ion Batteries. Adv. Funct. Mater. 2011, 21 (20), 3859–3867. https://doi.org/10.1002/adfm.201100854.
(7) Xia, L.; Yu, L.; Hu, D.; Chen, G. Z. Electrolytes for Electrochemical Energy Storage.
Mater. Chem. Front. 2017, 1 (4), 584–618. https://doi.org/10.1039/C6QM00169F.
(8) Ponrouch, A.; Monti, D.; Boschin, A.; Steen, B.; Johansson, P.; Palacín, M. R. Non-Aqueous Electrolytes for Sodium-Ion Batteries. J. Mater. Chem. A 2015, 3 (1), 22–42. https://doi.org/10.1039/C4TA04428B.
(9) Bauer, A.; Song, J.; Vail, S.; Pan, W.; Barker, J.; Lu, Y. The Scale-up and Commercialization of Nonaqueous Na-Ion Battery Technologies. Adv. Energy Mater. 2018, 8 (17), 1702869. https://doi.org/10.1002/aenm.201702869.
(10) Li, W.; Han, C.; Cheng, G.; Chou, S.; Liu, H.; Dou, S. Chemical Properties, Structural Properties, and Energy Storage Applications of Prussian Blue Analogues. Small 2019, 15 (32), 1900470. https://doi.org/10.1002/smll.201900470.
(11) Kubota, K.; Kumakura, S.; Yoda, Y.; Kuroki, K.; Komaba, S. Electrochemistry and Solid-State Chemistry of NaMeO2 (Me = 3d Transition Metals). Adv. Energy Mater. 2018, 8 (17),
1703415. https://doi.org/10.1002/aenm.201703415.
(12) Delmas, C.; Fouassier, C.; Hagenmuller, P. Structural Classification and Properties of the Layered Oxides. Phys. BC 1980, 99 (1–4), 81–85. https://doi.org/10.1016/0378-4363(80)90214-4.
(13) Sathiya, M.; Jacquet, Q.; Doublet, M.-L.; Karakulina, O. M.; Hadermann, J.; Tarascon, J.-M. A Chemical Approach to Raise Cell Voltage and Suppress Phase Transition in O3 Sodium Layered Oxide Electrodes. Adv. Energy Mater. 2018, 8 (11), 1702599. https://doi.org/10.1002/aenm.201702599.
(14) Mariyappan, S.; Wang, Q.; Tarascon, J. M. Will Sodium Layered Oxides Ever Be Competitive for Sodium Ion Battery Applications? J. Electrochem. Soc. 2018, 165 (16), A3714– A3722. https://doi.org/10.1149/2.0201816jes. 3 4 5 6 7 8 9 10 11 12 13 14 15 16 17 18 19 20 21 22 23 24 25 26 27 28 29 30 31 32 33 34 35 36 37 38 39 40 41 42 43 44 45 46 47 48 49 50 51 52 53 54 55 56
(15) Sun, Y.; Guo, S.; Zhou, H. Adverse Effects of Interlayer-Gliding in Layered Transition-Metal Oxides on Electrochemical Sodium-Ion Storage. Energy Environ. Sci. 2019, 12 (3), 825– 840. https://doi.org/10.1039/C8EE01006D.
(16) Dai, Z.; Mani, U.; Tan, H. T.; Yan, Q. Advanced Cathode Materials for Sodium-Ion Batteries: What Determines Our Choices? Small Methods 2017, 1 (5), 1700098. https://doi.org/10.1002/smtd.201700098.
(17) Wang, Q.; Mariyappan, S.; Vergnet, J.; Abakumov, A. M.; Rousse, G.; Rabuel, F.; Chakir, M.; Tarascon, J. Reaching the Energy Density Limit of Layered O3‐NaNi0.5Mn0.5O2
Electrodes via Dual Cu and Ti Substitution. Adv. Energy Mater. 2019, 9 (36), 1901785. https://doi.org/10.1002/aenm.201901785.
(18) Yao, H.-R.; Wang, P.-F.; Gong, Y.; Zhang, J.; Yu, X.; Gu, L.; OuYang, C.; Yin, Y.-X.; Hu, E.; Yang, X.-Q.; et al. Designing Air-Stable O3-Type Cathode Materials by Combined Structure Modulation for Na-Ion Batteries. J. Am. Chem. Soc. 2017, 139 (25), 8440–8443. https://doi.org/10.1021/jacs.7b05176.
(19) J. Rodriguez-Carvajal. FULLPROF: A Program for Rietveld Refinement and Pattern Matching Analysis. Abstract of the Satell. Meet. Powder Diffr. XV Congr. IUCr (1990) Toulouse Fr. P. 127
(20) Rodríguez-Carvajal, J. Recent Advances in Magnetic Structure Determination by Neutron Powder Diffraction. Phys. B Condens. Matter 1993, 192 (1–2), 55–69. https://doi.org/10.1016/0921-4526(93)90108-I.
(21) Leriche, J. B.; Hamelet, S.; Shu, J.; Morcrette, M.; Masquelier, C.; Ouvrard, G.; Zerrouki, M.; Soudan, P.; Belin, S.; Elkaïm, E.; et al. An Electrochemical Cell for Operando Study of Lithium Batteries Using Synchrotron Radiation. J. Electrochem. Soc. 2010, 157 (5), A606. https://doi.org/10.1149/1.3355977.
(22) Briois, V.; La Fontaine, C.; Belin, S.; Barthe, L.; Moreno, T.; Pinty, V.; Carcy, A.; Girardot, R.; Fonda, E. ROCK: The New Quick-EXAFS Beamline at SOLEIL. J. Phys. Conf.
Ser. 2016, 712, 012149. https://doi.org/10.1088/1742-6596/712/1/012149.
(23) Ravel, B.; Newville, M. ATHENA , ARTEMIS , HEPHAESTUS : Data Analysis for X-Ray Absorption Spectroscopy Using IFEFFIT. J. Synchrotron Radiat. 2005, 12 (4), 537–541. https://doi.org/10.1107/S0909049505012719.
(24) Singh, S. D.; Poswal, A. K.; Kamal, C.; Rajput, P.; Chakrabarti, A.; Jha, S. N.; Ganguli, T. Bond Length Variation in Zn Substituted NiO Studied from Extended X-Ray Absorption Fine Structure. Solid State Commun. 2017, 259, 40–44. https://doi.org/10.1016/j.ssc.2017.05.002.
3 4 5 6 7 8 9 10 11 12 13 14 15 16 17 18 19 20 21 22 23 24 25 26 27 28 29 30 31 32 33 34 35 36 37 38 39 40 41 42 43 44 45 46 47 48 49 50 51 52 53 54 55
(25) Yan, G.; Mariyappan, S.; Rousse, G.; Jacquet, Q.; Deschamps, M.; David, R.; Mirvaux, B.; Freeland, J. W.; Tarascon, J.-M. Higher Energy and Safer Sodium Ion Batteries via an Electrochemically Made Disordered Na3V2(PO4)2F3 Material. Nat. Commun. 2019, 10 (1).
https://doi.org/10.1038/s41467-019-08359-y.
(26) Komaba, S.; Nakayama, T.; Ogata, A.; Shimizu, T.; Takei, C.; Takada, S.; Hokura, A.; Nakai, I. Electrochemically Reversible Sodium Intercalation of Layered NaNi0.5Mn0.5O2 and
NaCrO2. In ECS Transactions; ECS: Honolulu, HI, 2009; pp 43–55.
https://doi.org/10.1149/1.3112727.
(27) Radin, M. D.; Van der Ven, A. Stability of Prismatic and Octahedral Coordination in Layered Oxides and Sulfides Intercalated with Alkali and Alkaline-Earth Metals. Chem. Mater. 2016, 28 (21), 7898–7904. https://doi.org/10.1021/acs.chemmater.6b03454.
(28) Wang, J.; Zhou, Z.; Li, Y.; Li, M.; Wang, F.; Yao, Q.; Wang, Z.; Zhou, H.; Deng, J. High-rate performance O3-NaNi0.4Mn0.4Cu0.1Ti0.1O2 as a cathode for sodium ion Batteries, J. Alloys
Compd. 2019, 792, 1054-1060. https://doi.org/10.1016/j.jallcom.2019.04.053
(29) Zhang, Y.; Kim, S.; Feng, G.; Wang, Y.; Liu, L.; Ceder, G.; Li, X.The Interaction between Cu and Fe in P2-Type NaxTMO2 Cathodes for Advanced Battery Performance, J. Electrochem.
Soc. 2018, 165 (7), A1184- A1192. https://doi.org/10.1149/2.0171807jes
(30) Singh, G.; Tapia-Ruiz, N.; Lopez del Amo, J-M.; Maitra, U.; Somerville, J-W.; Armstrong, R.; Martinez de Ilarduya, J.; Rojo, T.; Bruce, P-G. High Voltage Mg-doped Na0.67Ni 0.3-xMgxMn0.7O2 (x = 0.05, 0.1) Na-ion Cathodes with Enhanced Stability and Rate Capability,
Chem. Mater. 2016, 28 (14), 5087- 5094. https://doi.org/10.1021/acs.chemmater.6b01935
(31) Zhang, C.; Gao, R.; Zheng, L.; Hao, Y.; Liu, X. New Insights into the Roles of Mg in Improving the Rate Capability and Cycling Stability of O3-NaMn0.48Ni0.2Fe0.3Mg0.02O2 for
Sodium-Ion Batteries, ACS Appl. Mater. Interfaces. 2018, 10, 10819-10827. https://doi.org/10.1021/acsami.7b18226
(32) Mao, Q.; Zhang, C.; Yang, W.; Yang, J.; Sun, L.; Hao, Y.; Liu, X. Mitigating the voltage fading and lattice cell variations of O3-NaNi0.2Fe0.35Mn0.45O2 for high performance Na-ion
battery cathode by Zn doping, J. Alloys Compd. 2019, 794, 509-517. https://doi.org/10.1016/j.jallcom.2019.04.271
(33) Li, H.; Cormier, M.; Zhang, N.; Inglis, J.; Li, J.; Dahn, J. R. Is Cobalt Needed in Ni-Rich Positive Electrode Materials for Lithium Ion Batteries? J. Electrochem. Soc. 2019, 166 (4), A429–A439. https://doi.org/10.1149/2.1381902jes.
(34) Liu, A.; Zhang, N.; Li, H.; Inglis, J.; Wang, Y.; Yin, S.; Wu, H.; Dahn, J. R. Investigating the Effects of Magnesium Doping in Various Ni-Rich Positive Electrode Materials for Lithium
3 4 5 6 7 8 9 10 11 12 13 14 15 16 17 18 19 20 21 22 23 24 25 26 27 28 29 30 31 32 33 34 35 36 37 38 39 40 41 42 43 44 45 46 47 48 49 50 51 52 53 54 55 56
Ion Batteries. J. Electrochem. Soc. 2019, 166 (16), A4025–A4033. https://doi.org/10.1149/2.1101915jes. 3 4 5 6 7 8 9 10 11 12 13 14 15 16 17 18 19 20 21 22 23 24 25 26 27 28 29 30 31 32 33 34 35 36 37 38 39 40 41 42 43 44 45 46 47 48 49 50 51 52 53 54 55
Table of content entry: 3 4 5 6 7 8 9 10 11 12 13 14 15 16 17 18 19 20 21 22 23 24 25 26 27 28 29 30 31 32 33 34 35 36 37 38 39 40 41 42 43 44 45 46 47 48 49 50 51 52 53 54 55 56