HAL Id: hal-02401708
https://hal-mines-albi.archives-ouvertes.fr/hal-02401708
Submitted on 10 Dec 2019
HAL is a multi-disciplinary open access
archive for the deposit and dissemination of
sci-entific research documents, whether they are
pub-lished or not. The documents may come from
teaching and research institutions in France or
abroad, or from public or private research centers.
L’archive ouverte pluridisciplinaire HAL, est
destinée au dépôt et à la diffusion de documents
scientifiques de niveau recherche, publiés ou non,
émanant des établissements d’enseignement et de
recherche français ou étrangers, des laboratoires
publics ou privés.
A Tool-Based Framework to Assess and Challenge the
Responsiveness of Emergency Call Centers
Eva Petitdemange, Franck Fontanili, Elyes Lamine, Matthieu Lauras, Uche
Okongwu
To cite this version:
Eva Petitdemange, Franck Fontanili, Elyes Lamine, Matthieu Lauras, Uche Okongwu. A Tool-Based
Framework to Assess and Challenge the Responsiveness of Emergency Call Centers. IEEE
Trans-actions on Engineering Management, Institute of Electrical and Electronics Engineers, 2020, 67 (3),
pp.568 - 581. �10.1109/TEM.2019.2954013�. �hal-02401708�
A Tool-Based Framework to Assess and Challenge
the Responsiveness of Emergency Call Centers
Eva Petitdemange
, Franck Fontanili, Elyes Lamine, Matthieu Lauras, and Uche Okongwu
Abstract—Emergency call centers (ECCs) are upstream of the
prehospital emergency medical system and the life of many people depends on their effectiveness and responsiveness. This notwith-standing, the way their operations are organized and managed differs from one place to another. Also, depending on the number of incoming calls and available resources, they can operate differently. In the face of these heterogeneous situations, some ECCs do not always meet the expected performance levels: people still wait for too long before their call is answered. Moreover, they may have difficulties in managing an important upsurge of calls, especially in periods of crisis. Therefore, to support ECCs’ organizational improvement steps, this article aims to develop a tool-based frame-work that would enable to make clear and objective diagnoses, especially as regards responsiveness. Our proposal allows consid-ering both nominal (normal days) and exceptional (crisis days) demands. It is based on data science, process mining, and discrete event simulation tools. By experimenting it on a French real case, the results show that such a tool-based framework can be very valuable for improving the performance of ECC organizational setups in both normal and disrupted situations.
Index Terms—Data mining, diagnosis, discrete event simulation
(DES), emergency call centers (ECCs), process mining, responsiveness.
I. INTRODUCTION
P
REHOSPITAL emergencies can be grouped into two cate-gories: formal systems and informal systems (characterized by the absence of organized and planned response to an emer-gency). In this article, we focus on the formal system, which has an access number and a call-taking system and is preponderant in European countries. Emergency call centers (ECCs) constitute the first step in emergency care operations and probably the keystone of the emergency system. Indeed, when people call for help in an emergency case, they often dial the emergency number of their country: 911 in the USA, 112 in all European Union countries, etc. The call is directed to the nearest ECC where it is processed before relief can be dispatched.This work was sup-ported by the Occitanie Region (France). Review of this manuscript as arranged by Department Editor A. Solis. (Corresponding
author: Eva Petitdemange.)
E. Petitdemange, F. Fontanili, E. Lamine, and M. Lauras are with the CGI, IMT Mines Albi, 81000 Albi, France (e-mail: eva.petitdemange@mines-albi.fr; franck.fontanili@mines-albi.fr; elyes.lamine@mines-albi.fr; Matthieu.lauras@ mines-albi.fr).
U. Okongwu is with the Toulouse Business School, 31068 Toulouse, France (e-mail: u.okongwu@tbs-education.fr).
It has been observed that in many countries like France and the USA, the performance of ECCs is not good enough. In other words, when people call an emergency number, they still wait for too long before an answer comes through. In France, national data on the responsiveness of ECCs [1] show that many are not meeting the quality standard requirement, which stipulates that 99% of calls must be answered within 60 s [2]. In the USA, the National Emergency Number Association call-answering quality standard (QS20) recommends that 95% of all 911 calls should be answered within 20s. It should be noted that not only the quality standard requirements are not the same in each country but also the performance level varies from one country to another.
In a nutshell, ECCs are facing a lot of challenges that are related to responsiveness. This is of utmost concern since poor performance in this sector can have a huge impact on the life of people. For ECCs, productivity [3] (the number of calls answered per agent in a given period of time) and responsiveness (the capacity of ECCs to answer calls fast enough with the right answer) are measured with respect to time. To improve their performance, ECCs need to challenge the call-answering service, that is, the way they handle and answer calls. The hetero-geneous nature of these organizations and the specificities of the field of emergency services can be used to explain the variable performance levels under "normal" operating conditions as well as the difficulties in anticipating the organization’s behavior during crisis. The contribution of this article is to partly address this complex challenge.
As we have just mentioned, one critical aspect of this problem is that the organization of ECCs differs significantly, even within the same country. The differences can be discussed along six dimensions: approach, access, platform, focus, queue time, and resources skills.
1) Approach defines the way the ECC responds to the relief need. There are two identified approaches: “scoop and run” (SAR) and “stay and play” (SAP) In the case of SAR, the goal is to take the patient to the hospital as fast as possible, whereas SAP amounts to taking hospital care facilities to the patient and commencing care at the patient’s location.
2) Access defines the manner in which the ECC is reached. It is regarded as universal if the number is unique, and specialized if there are several numbers.
3) For the platform, it can be shared (several types of emer-gencies are handled on the same site) or specific (only one type of emergency is handled on a given site).
Fig. 1. Emergency chain.
4) Queue time refers to the management of calls. Basically, it can be with or without triage. Without triage implies that calls are managed in a first come, first served mode during all the process of the call, whereas with triage means that calls are prioritized after being picked up depending on the severity. This ensures that the most serious calls are treated as a priority. [4]
5) Focus refers to the types of call covered by the call center: whether it deals only with urgent calls or with generalist medicine calls.
6) Resources skills refers to the fact that resources within an ECC can be specialized (for a specific task, call flow, etc.) or multiskilled.
Given that there are two possibilities for each dimension, we have a combinatory of 64 (2∗2∗2∗2∗2∗2). This illustrates well the heterogeneity of ECCs as well as the different possible organizational setups.
Whatever is the organizational setup, the emergency chain is quite the same for all ECCs and can be divided into six main steps which are as follows and as shown in Fig. 1, when an emergency number is dialed:
1) it arrives at the nearest ECC;
2) where a call taker answers the call and transfers it to a call dispatcher for analysis;
3) then, a decision is taken;
4) to send relief or not to the beneficiary;
5) responders are first sent to the beneficiary before (s)he is transferred;
6) and admitted at the hospital.
This article focuses only on the upstream part of the emer-gency chain, that is, from step 1 to step 4, with particular attention to steps 1 and 2, which contribute to the improvement of the ECC’s responsiveness. It does not address downstream issues mostly because a lot of work has been done on this part in extant literature. Moreover, according to the work presented in [5] and [6], studies on the dispatching of vehicles in emergency medical services often neglect the time to process calls because it lasts only a few seconds. But, in emergency operations, seconds mat-ter. It follows that hereafter, the focus will be on the ECC only. In this article, to support improvement initiatives, we develop and propose a tool-based framework that would enable to make an accurate diagnosis of an ECC’s organizational setup with respect to responsiveness. The framework has been designed for both normal (everyday life) and disrupted (crises) events.
In Section II, we start by reviewing the literature on ECCs and the methods used to evaluate them. Then, in Section III
we present the proposed framework before applying it to a real practical case by experimentation and validation in Section IV. Finally, Section V concludes the article.
II. LITERATUREREVIEW
ECCs can be studied (diagnosed) by asking the following three main questions.
1) Is the operational organization of ECCs unique and ho-mogeneous? In other words, what are the different types of ECCs?
2) How should ECCs be evaluated and what key indicators should be used to assess their performance?
3) What methods and tools are used to analyze and improve the performance of ECCs?
The literature review will be done around these three questions and will enable us to present the contribution of this article. A. ECC: Different Types Around the World
The ECCs constitute the first step in dealing with prehospital emergencies. Generally, the more a country (and its healthcare policy and infrastructure) is developed, the more organized and advanced is its emergency service system. Sikka and Margolis [7] proposed an approach to categorize the variety of emergency medical services around the world. They identified two types of emergency medical services: formal and informal. A formal system "includes an access number, a call-taking system, a dis-patch system, response, care, and transportation.” An informal system is characterized by an absence of organized and planned response to an emergency. In this article, we focus on the formal system, which has an access number and a call-taking system.
The call-taking system differs a lot from one country to another. In essence, there are physician-based and nonphysician-based systems. An example of the physician-nonphysician-based system is the French model [8] where the philosophy (often referred to as “stay and play”) is to move the physician to the patient. The specificity of this model is to have a physician at each step of the prehospital care from the call-taking to the hospital. Moreover, there are multiple access numbers according to the need: in France, 112 or 15 for a medical emergency, 18 for a fire emergency, and 17 for the police. Each of these numbers constitutes a first responder, and they all have their own call center, call-takers, and dispatchers.
On the other side, we have the North American model. When people call the 911, their call arrives in a public safety answering point. The call is analyzed by the call-taker and then dispatched to more appropriate first responders. The goal is to move the patient as fast as possible to the hospital (scoop and run). Table I, which shows the difference between the two models, illustrates the heterogenous nature of ECCs. For our use case, we have worked with the French ECC in a SAP mode.
Also, we have identified two modes of operations for ECCs: nominal operations and exceptional operations in the event of a crisis. A crisis can be defined as the sudden moment when a decision is necessary, decisive for an individual or society; it is the moment when structures, values, norms are threatened by a disruption of balance [9]. A crisis in an ECC can be of two kinds – one-off or long-term. One-off crises can be a major accident,
TABLE I
EMERGENCYACCESSNUMBER ANDOPERATIONMANAGEMENT INSEVERALCOUNTRIES
TABLE II
KPISDEFINED IN THELITERATURE TOASSESSECCS
an attack, food poisoning in a public place that will generate a peak call in a short period of time. Long-term crises correspond to a less significant increase in calls but over a longer period. Influenza epidemics are long-term crises for ECCs.
B. Evaluation of ECCs and KPIs Used
According to Gans et al. [10], responsiveness is a key measure for assessing the performance of an ECC. The waiting time before calls are answered is of utmost importance in ECCs especially due to the eventual loss of lives. Therefore, there is the need to have very relevant and effective key performance indicators (KPI).
Table II summarizes the most used KPIs for ECCs. These KPIs are not independent. For example, when the average speed of answer increases, the abandon rate will also increase, and the customer satisfaction and the quality-of-service (QoS) will decrease. Penverne [11] highlighted the link between occupation rate and quality service. These two KPIs are strongly correlated. To assess the responsiveness of an ECC, the most accurate KPI is QoS. The higher the QoS, the lesser the number of calls waiting to be answered. However, it is also interesting to look at the maximum waiting time before picking up. As we are dealing with ECCs, it is not acceptable to have a high maximum waiting time even if it is just an exception because it can cost lives. Considering that, reducing the maximum waiting time before picking up can be a goal to reach in the improvement steps. The QoS is used for different types of ECCs: Avramidis et al.
[12] used it to evaluate a call center in customer service while Penverne et al. [11] used it to evaluate an ECC.
For ECCs, accessibility and time-related KPIs are primordial. As ECCs are the first link in the emergency chain, each second is valuable. It has been demonstrated that the use of ECCs in dispatching a quick response as well as giving advice, guidance, or instructions can be lifesaving [13]. Reducing waiting time (before the picking up of calls) has a positive impact on customer satisfaction [14], [15]. People are less patient waiting in a tele-phone queue than in a physical queue where they can see the line moving (as in a bank or supermarket queue). Moreover, reducing the waiting time in a queue would have a positive impact on the abandon rate. If calls are answered faster, people will be less inclined to leave (abandon) the queue.
The QoS requirements used in ECCs are quite high even though they vary from one country to another. In France, 90% of calls are expected to be taken within 60 s. In the Scandinavian countries, 95% of the calls must be taken within 6 s [11]. In the USA, 90% of calls must be taken within 10 s during the peak periods of the day and 95% of calls must be taken within 20 s the rest of the time [19]. In Montreal, Urgence Santé requires that 95% of the calls must be answered within 6 s. In ECCs, the requirements of high service levels lead to the challenge of improving accessibility and reducing waiting times.
To reduce the waiting time, it is possible to work on staffing. Good management of human resources would enable a call center to answer more calls. In the literature, the staffing problem of ECCs is widely documented. The methods are often assessed based on accessibility to see the impact of the staffing policy. However, aiming to reach the quality requirement just by adding a new agent (without reengineering the process) is not cost effective since workforce management in ECCs is a major cost element [10].
With an ever-increasing demand and the diversification of inbound calls, training all the agents to deal with all types of calls is not cost effective [10]. This is why call centers evolve to become multiskilled. Koole [20] introduced a concept, referred to as skill-based routing or routing, which enables to enhance the assignment of call types to an agent. Also, Wallace et al. [21] developed an algorithm to determine the number of skills an agent must have to improve the overall performance of a center. The purpose of their research work was to find the appropriate combinations through six types of calls and only two skills per agent. To improve the QoS, they added some flexibility in the routing of a call. Here, flexibility is defined as the capability of an agent to handle several types of calls. Another study, on a call center dealing with several types of
inbound calls/e-mails proved the benefits of using multiskilled agents for performances, mainly by looking at the mean sojourn time [22]. A study conducted on real data from an electrical company call center, gave more insight on how to determine which calls must be merged into one specific type [23]. C. Analysis Methods and Tools, and Their Limits
The Erlang C model was often used in the past for solving the staffing problem of a call center. Its results turned out to be quite good and it was easy to apply. This model evolved to include abandoned calls. Garnett et al. [24] created the Erlang-A model, which considers abandoned calls and incorporated the concept of the user’s patience. Their work showed that the less users are patient, the more likely they are to abandon the queue.
Models (such as queuing theory and Erlang models), used to describe call centers, have evolved to reflect real systems. However, they are still based on some strong assumptions and do no longer follow the evolution of call centers. Consequently, the results can be biased. Gans et al. described in detail the usual assumptions that are made when modeling a call center [10]. The principal assumptions are:
1) the inter-arrival process of the call was assumed to be a Poisson process, implying that users are considered to be homogeneous [25] [16], [26];
2) service times are independent, identically distributed and follow mainly a log-normal distribution [25] and in some cases an exponential distribution [27];
3) agents are assumed to be homogeneous and the routing of call is quite simple given that all the resources are identical. In other words, it is assumed that there are many potential callers who are identical and that the probability that they will call at any minute is low. So, the average number of calls arriving at any minute is moderate. Very few studies use real call arrival data [28] (see Aboueljinane’s literature review for more examples [29]).
Further in this article, we will argue that the second assump-tion is not the most suitable in all cases. We note that the third assumption is not true in our case since we have several types of resources.
D. Our Contribution
In a context where the organizational setup of ECCs not only differs from one country to another, but also within the same country, the management of operations forcibly differs. ECCs have a specific high requirement on waiting time and existing analytical models have shown some weaknesses in incorporating real specificities of ECCs. Handling emergencies is the primary mission of ECCs, but the fact that they are occasionally faced with some crises obliges them to develop crisis management policies that enable them to prevent and stabilize their system after a major event.
In this context of huge organizational heterogeneity, the major challenge of ECCs is how to assess their performance and manage their operations both in normal and crisis situations, with special reference to responsiveness. The contribution of this article is to propose a tool-based framework that enables
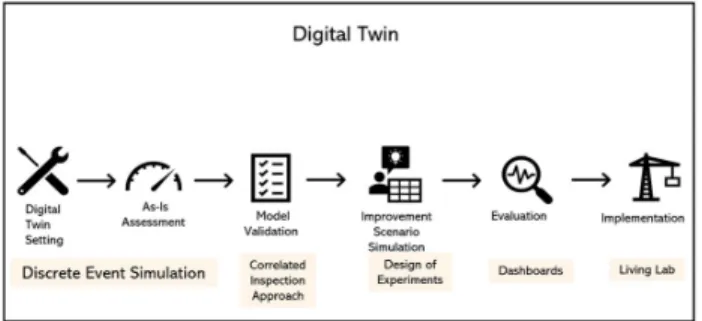
Fig. 2. Steps of the framework in the digital twin.
to address the abovementioned challenge. It follows that the focus of the article is not on the improvement part but on the framework.
In order to justify the relevance of our purpose, we conducted a systematic literature review using these keywords: (Method-ology OR Method OR Method OR Framework OR Tool) AND ("Emergency Call Center" OR "Emergency Contact Center" OR "Emergency Dispatch Center" OR "Public Safety Answering Point") AND (Evaluation OR Diagnosis∗ OR Assess∗) AND (Responsiveness OR Performance OR Efficiency). This request returned 1240 results. Among these results, Gardett et al. (2013) reviews the systematic literature on "emergency dispatch re-search" in which it raises a lack of comparative studies in the field, a universal evaluation framework and a precise description of the protocol used in individual studies. We have therefore reduced our research results to articles published after 2013. After a sorting on titles and abstracts we found ten articles that deal with organization or methodology in ECCs. However, none of them present a detailed overall framework. Part of the detail on the tools used at each step is regularly missing. This is why we believe that the proposal of a tool framework is relevant and adds to the literature both for researchers who want to study call centers and for experts in the field to evaluate their structure.
III. PROPOSAL
Our proposal is a tool-based framework that can be used to diagnose and improve ECCs while taking into account their specificities. This enables us to do a more accurate analysis in view of improving the responsiveness of ECCs. From the real system, the goal is to be able to construct a knowledge model (see Fig. 2.). This model enables to understand and formalize the real system in order to create its digital twin (see Fig. 3.) The real system and the digital twin coupled with the six dimensions already presented in Section II constitute the proposed framework as shown in Fig. 4.
The framework is divided into the following four phases [30]. 1) Data gathering and preparation in order to understand the business process of the real system and extract meaningful data.
2) Interpretation and integration, which enables to transform the data into knowledge.
3) Diagnosis, which will allow us to obtain all the input parameters for the simulation model as well as to analyze the current performance of the call center.
Fig. 3. Steps of the framework in the real system.
4) Improvement, which allows to test new organizational setups and evaluate the impact on the performance of the system.
Each phase is composed of two or three steps that are pre-sented hereafter.
A. Collecting and Cleaning the Data
The complexity of getting event log of data lies in the variety of the data structure, which is different from one organization to another. Given that in step 2 process mining techniques will be used to extract knowledge, data should be prepared according to a given format. Van Dongen and van der Aalst [31] have developed a meta model for process mining data. Each event in the log should have a name, a timestamp, and a trace ID. In our specific case, we will add the resource who performed the activity and the incoming flow of the trace. The structure of our data includes the following elements.
1) Event: the name of the event occurring.
2) Timestamp: the time information of the event–year, month, day, hour, minute, second.
3) ID: a unique key to identify all the events related to one call.
4) Resource: the identification number of the resource per-forming the event.
5) Incoming Flow: the number dialed by the caller to access the call center.
B. Discovering Business Model
The next step of the framework is to understand the business process and obtain more information about the operations of the call center. As previously discussed, ECCs are organized in different ways. One of the difficulties is to capture and under-stand these differences. In this case, we need some information about the resources: First, how many types of resources are used? Second, what are the differences between them? Third, what are the activities realized by each type? We also need some information about the incoming flows such as the number and severity.
Then, we need to understand the data in order to be able to link the ID number of the agent to his/her function, and the identification number of the incoming flow to its category. This implies having a glossary of ID numbers as well as an access to the log of the call center.
C. Merging Models
This step creates the link between event and activity, which allows to determine the duration.
Data from log are composed of traces, which themselves are composed of events. It follows that a trace (a sequence of events) corresponds to a call in the call center. All events are instantaneous. In addition, depending on the resource that is linked to the event, it may be a different activity in the business process. Here, the goal is to determine the duration of each activity for every call using the event log. So, we developed business rules to link events and activities.
In a call, we can record several durations and this enables to describe the type of call in terms of state. A call has two states. 1) Waiting: the call is in a queue, waiting for a resource to
handle it.
2) Online: the call is being handled by a resource.
A call process is a sequence of waiting and online states. The waiting state is optional and two online states can be consecutive. A call can be managed by one or several resources. For example, if there are two resources managing the call, it will have two online durations, one for each resource involved. The duration between events can be calculated easily.
A business process is composed of a sequence of activities. In our case, when several activities are linked by a single resource, we consider this sequence of activities as one single activity. This is possible because activities cannot be interrupted. It follows that one communication time from the event log would be linked to one activity (or a set of activities) performed by one resource. To link business processes and event logs, it takes to identify at least four types of event (see Fig. 5).
1) E1-Ringing: The first event for a call, when it arrives at the call center and is waiting to be picked up by a resource. 2) E2-Established: The call is picked up and the resource is
online.
3) E3-Released: The call is suspended. 4) E4-Held: The call is on hold.
As an example, we consider two patterns of calls from the event point of view and the business process described in Fig. 8. In this business process, there are two possible sequences of activities: i) A0-A2-A3-A4, with all the activities performed by resource R1, or ii) A0-A2-A3-A5, with the first three activities performed by R1 and the last one performed by R2. Since we assume that activities cannot be interrupted, sequence A2-A3-A4 is equivalent to activity A1 and sequence A2-A3 is equivalent to activity A1’. These activities can be described as follows.
1) A0 is not a real activity, it is the presence of a call in the queue.
2) A1 represents the answering of a call by an operator; the severity of the call is assessed and if it does not need to be diagnosed by a physician, the operator will give some advice to the caller.
3) A1’ represents the answering of a call by an operator before it is transferred to a physician.
4) A5 represents the diagnosis of a call by a physician before it is decided to send relief.
The application of Algorithm 1 entails that sequence (i) is related to Pattern 1 (see Fig. 5.) and the duration d0 of a call
Fig. 4. Overview of the proposed framework.
in the queue is the difference between the timestamp of event E2-Established and the first event E1-Ringing. The communi-cation time is the difference between the timestamp of the last event E3-Released and event E2-Established. Algorithm 1 (see Fig. 6.) is also applied to pattern 2 to obtain the duration time that enables us to link the business process duration of activities to the events log.
D. Extracting Knowledge
1) Setting the Severity: In an ECC, calls can be prioritized and it is possible to set a level of severity for each call depending on the set of resources that are handling it. We can prioritize the type of resources: critical resources deal with the most urgent calls while noncritical resources deal with the less urgent calls. For example, in Algorithm 2 (see Fig. 7.) with p= 3, Rt1 is an emergency physician and the most critical resource, Rt2 is a general physician and an intermediate resource, and Rt3 is a call operator (CO) and a noncritical resource. Rt3 receives all the calls. (S)he handles the noncritical calls and transfers the rest to either Rt2 or directly to Rt1. Rt2 transfers to Rt1 calls
that (s)he considers to be very critical. In essence, all the calls transferred to Rt1by Rt2and Rt3are considered to be the most urgent (severe) calls, while those that are handled by Rt2 are considered to be of an intermediate level of severity.
2) Finding the Service Time for the Activities: With the du-ration of the activities, we can find the probability distribution of each activity, or at least the distribution that is the best fit of the data. This enables us to setup the simulation model with more accurate data. In extant literature, service times are assumed to follow a log-normal distribution [32]–[35]. This distribution might fit in specific cases. But, in this article, we hypothesize that this is not necessarily true since the resources and the calls are heterogeneous. Thus, by analyzing the service times collected from real data, we used the fit method from the scipy.stat library for Python. The best distribution is evaluated by the residual sum of squares [36], also known as the sum of squared error (SSE). A small value of SSE indicates a tight fit between the real data and the model.
3) Getting the Profile of Incoming Calls: The profile of calls can be defined according to real data, which are represented in form of a histogram with a class interval of 30 min.
Fig. 5. Business process and examples of event patterns.
Fig. 6. Algorithm 1: How to link event to duration of communication.
E. Setting the Digital Twin
Based on the business process and the data, discrete event simulation (DES) is used to create a model of the call center with the parameters already extracted. Most of the time, call center issues are addressed using queuing theory [10], [20], which is more adapted to a single type of call and agent. But, ECCs have evolved and are now using heterogeneous resources and receiving several types of call. For multisourcing call centers
Fig. 7. How to set the level of severity of a call.
and multiskilled agents, DES seems to be more appropriate as demonstrated by Bhulai [37] and Roubos et al. [38].
The DES model is not only used as a decision tool but also as a management support tool [39]. For this research, it is appropriate to use DES since we want to make a diagnosis and improve complex organizational setups with heterogeneous resources and different incoming flows.
F. Assessing the AS-IS
Using the data, the waiting time to access the call center is determined and used to assess the QoS. The QoS is a measure of the responsiveness of a call center [12]. It is usually determined
Fig. 8. Business process of a call.
as the fraction of calls served under a specified threshold divided by the total number of incoming calls. This KPI is generally used for evaluating call-centers and especially for ECCs [11], [17]. We also took into consideration the maximum waiting time.
This method focuses on the responsiveness of the call center. It is natural to focus on the evaluation of the waiting time before a call is handled. By generating the histogram of the waiting times as well as the whisker plot, we can quickly assess the QoS and the maximum waiting time of the call center.
Depending on the threshold defined by the experts of the real system, we can check whether the quality requirements are met by the ECC. If not, a simulation model is built to test new organizational setups in view of meeting the requirements.
G. Validating the Model
More than 15 validation techniques have been identified in the literature by Sargent [40]. He indicates that the choice of one or more of these techniques is based on multiple objective or subjective criteria. So, we looked at many statistical methods and opted for the “correlated inspection approach” proposed by Law [41]. The reason for making this choice is that the idea is not to validate data that follow time series but rather to have a distribution that enables to reproduce processing times for calls arriving totally randomly following a predefined arrival profile (set by a number of calls per time slot).
The performance of the real ECC should be compared with that of the simulated ECC with respect to the most accurate KPI. The closer the performance of the real ECC is to that of the simulated ECC, the higher the confidence level of the model. Tukey [42] developed several methods that are used to compare univariate series of data. We used three tests – two graphical and one analytical – to assess the validity of our model.
The graphical tests enabled us to compare the distribution of the data using their boxplots and histogram. This method [30] provides us with information on the distribution of the data, the mean value and the extreme values. For the model
Fig. 9. Correlated inspection approach from Law & Kelton (2000).
to be valid, it must have a shape similar to the actual model. We compared the mean value of waiting time according to the correlated inspection approach described in Fig. 9.
Finally, we used the analytical test of Pearson to assess the correlation between the two series. If the test value is superior or equal to 95%, the model is considered to be valid.
To adapt the model parameter setting, we created an ad-justment variable according to the uniform distribution. This adjustment variable applies after each call is answered. We assume that a person has a reaction time between two calls. The uniform distribution has been empirically parameterized to ensure that the model is as close as possible to reality.
H. Simulating Improvement Scenario
With the collection of the data and the information extracted from the logs, a DES is set up to test several scenarios and evaluate the impact on the ECC’s responsiveness.
I. Implementation
If one or several scenarios fulfil the targets of the experts, it can be tested in a secure area as a living lab to evaluate the scenario in real conditions.
IV. EXPERIMENTATION ANDVALIDATION
A. Presentation of the Use Case
To assess our framework, we have worked on one use case with real data from a French ECC. This ECC uses a SAP mode and deals with both emergency and general medicine (GM) calls. There are several numbers to reach the center: 112 and 15 for the emergency, 3966 for the GM. The queue does not use triage. The resources are not multiskilled.
This ECC has two incoming flows: one for emergency and the other for the GM. Some emergency calls can arrive through the GM flow even though the number dialed is different. But, this is unusual.
The data (corresponding to 5330 calls) were recorded over 22 days in 2018. These are the only data that we were able to access. We built and validated the model with the complete dataset. However, the scenarios are simulated only over a period of 24 h.
B. Experimentation: Results and Discussion
As an illustrative example, the framework presented in Section III will be applied to phases 1 to 4. We note that step 4 is not presented simple because we did not have the chance to test the scenario in a living laboratory.
1) Collecting and Cleaning the Data: For this article, we have kept only the incoming calls. The incomplete calls in the log (without a beginning event, or without a final event) were not considered. At the end of this step, we obtained the specified number of calls, that is, 5330.
2) Discovering the Business Model: The process of handling a call has been obtained through an interview-based modeling with an expert. The process is shown in Fig. 8. Five main activ-ities were identified: answering, recording, advising, diagnosis for emergency and diagnosis for general call.
In this ECC, we have two types of resources: COs (who answer the calls and set the level of severity) and physicians. Depending on the type of organization, COs can be multiskilled (if they handle both GM and emergency calls) or specialized (if they are split into two groups: Emergency COs (ECO) for 112 calls and general COs (GCO) for GM calls). Once a call is answered by a CO it is transferred to an emergency physician (EP) or a general physician (GP). Fig. 8 shows in detail the process for one call with a specialized CO.
Calls in this call center can have three different severity levels: S=1 for calls that need a diagnosis by an EP, S=2 for calls that need a diagnosis by a GP, and S=3 for calls that need only a piece of advice.
At this stage, the data are completed with the skill of the resources (ECO, GCO, EP, or GP). The dataset is transformed into a trace log using process mining. All the events linked to one call are gathered under one unique ID.
3) Merging Models: The ECC has several paths of activ-ities: first, answering-recording-advising performed by a CO for low severity calls (S=3) and second, answering-recording-diagnosing for medium severity calls (S=2) as well as for high severity calls (S=1). As described in the framework, we were
Fig. 10. Profile of incoming calls.
able to identify the main events in the logs (Ringing, Established, Held, Released). We linked these events to the activities in order to determine their duration.
4) Extracting Knowledge: In possession of all the data that are required to do the diagnosis, we now need to transform them into knowledge by extracting valuable information from them.
a) Profile of incoming calls: The interarrival time of calls is set up with the real data based on a 30-min timeslot as shown in Fig. 10.
b) Services time: There are several service times to define depending on the incoming flow and the type of activities. The service time of a CO can be for the answering and recording activities, but also for the answering, recording, and advising activities if the call has a low severity level (S=3) and does not need any diagnosis by a physician.
After applying our framework, the best distribution found was compared to the log-normal distribution. The comparison scores were compiled using the SSEs [36]. The closer the value is to 0, the better the distribution is fitted to the data. The results are summarized in Table III. We observe that based on our data, the log-normal distribution is not the best for the CO in all the cases; the best-fit corresponds rather to Johnsons distribution [43]. Fig. 11 shows a graphical view of the various distributions. Looking at this figure, we can see that the log-normal distribution is obviously not the best-fit for our dataset.
c) Incoming flow distribution: With the dataset, it is possi-ble to determine the number of calls in each incoming flow that correspond to each level of severity. The results are summarized in Table IV.
5) Setting the Digital Twin: The simulation model is created using the DES software Witness. The incoming profile of calls and their service time with the agent come from the data analyzed previously. We assume that the duration of calls is independent of the time of the day.
6) Assessing the AS-IS: The boxplot chart [42] of the waiting time of calls for ECCs gives us some insight on the performance of the call center accessibility. Seventy-five percent of the calls are answered within 31 s and there are some outliers calls that waited much longer—461 s, a value that is quite high for an ECC. We note that the waiting time requirement in France is to have 90% of calls answered within 60 s. Yet, this ECC has a QS60 of 88% and a QS20 of 40%
TABLE III
SERVICETIMESDISTRIBUTIONWITHFITSCORE ANDPARAMETERS FORECC-2
Fig. 11. Distribution for the answering–recording activities.
TABLE IV
CALLSEVERITYREPARTITIONBETWEENINCOMINGFLOW
7) Validating the Model: Parameters of the model come from the real dataset and are used to parameterize the model. Then, a simulation is run on the dataset and we compared the waiting times of the model to real values. Our model is considered to be valid enough if with the same parameters, it has the same performance as the reality.
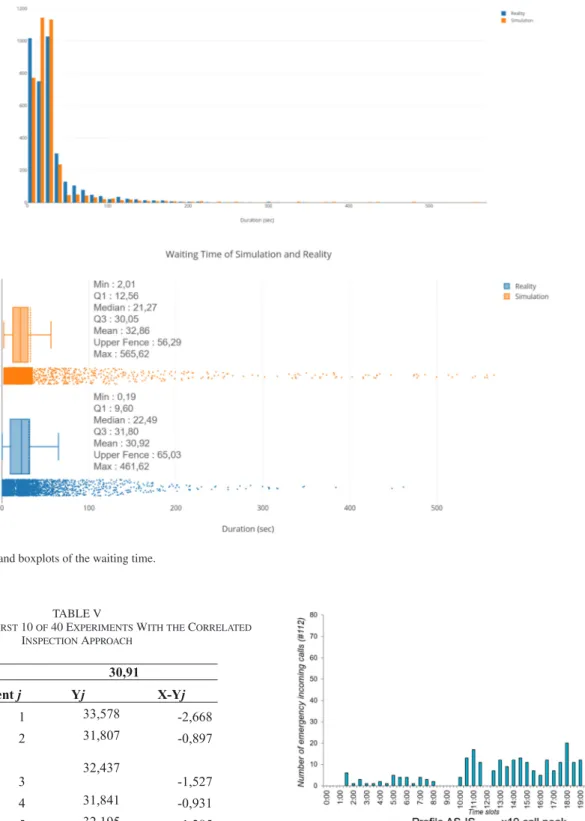
To validate it, the boxplot and the histogram used to compare the two series of waiting time are shown in Fig. 12. The Pearson Test [42] used to assess the correlation between the two series gave an acceptable score of 95%.
Table V presents the results of the correlated inspection ap-proach, with X the mean value of waiting time of the real system, and Y the mean value of waiting time of the model for several experiments.
8) Simulating Improvement Scenario: To assess the conse-quences of a crisis in ECCs, we tested a crisis scenario. A crisis in an ECC can be a sudden upsurge of calls within a short time. Let us take the case of food poisoning in a primary school canteen at noon. The effects of this intoxication will occur later in the evening when all the children have returned home. We presume that all the parents will potentially dial the emergency number, thereby creating an upsurge of calls. Fig. 13 shows the profile of the calls for this scenario. We applied a 10-fold increase in the number of calls over a 30-min period between 8:30 and 9:00 pm. Then, we assessed the impact on the responsiveness of the ECC. We also assessed the time to recover (TtoR) of the system. Dalziell et al. [44] defines the “time to recover” as the adaptive capacity of the system to recover from the crisis.
We ran four scenarios with the simulation model.
1) S1 is an « AS-IS » scenario on 24 h. There are two specialized resources: one ECO for the emergency flow and one GCO for the generalist flow.
2) S2 is a crisis scenario, with the same organization as S1. 3) S3 is the crisis scenario but with multiskilled resources
(two COs instead of one ECO and one GCO).
4) S4 is the crisis scenario with multiskilled resources and one additional resource (that is, three COs).
The results of the simulations are presented in Table V. S1 has poor results with a maximum waiting time of 9 min and 35 s, a QS20 at 61% and a QS60 at 72%. This implies that the current organizational setup is already not very effective. It is not surprising that the performance is further worsened by the crisis. The maximum waiting time reaches 1 h, 5 min and 48 s, while QS20 and QS60 drop to 45% and 54%, respectively. In Fig. 15, which shows the waiting time of each call during the day for S1 and S2, we can see the huge rise during the crisis. The crisis started at 8:30 pm and lasted until 10:37 pm, when the system came back to normal management. The "time to recovery" is therefore 2 h and 7 min.
There is need to improve the situation by changing the or-ganizational setup. In S3, we tested a new organization with multiskilled instead of specialized resources. In this case, COs can pick up calls from both input streams and help each other to smoothen the workload. In Fig. 16, we can see that QS20 improved to reach a value that is greater than 70%. The waiting times for S2, S3, and S4 are shown in Fig. 14. Compared to
Fig. 12. Histograms and boxplots of the waiting time. pt
TABLE V
RESULTS FOR THEFIRST10OF40 EXPERIMENTSWITH THECORRELATED
INSPECTIONAPPROACH
Fig. 13. Profile of the calls during the day.
S2, we notice that S3 significantly improved the waiting time. Table VI shows the results of the simulations; there is a 44-min decrease in the maximum waiting time. Also, the T to R y is reduced by 1 h and the crisis-related disruption disappears after 9:36 pm.
Fig. 14. Waiting time for S2, S3, and S4.
Fig. 15. Waiting time for S1 and S2.
Fig. 16. Evolution of the quality of service.
TABLE VI RESULTS OF THESIMULATION
Finally, S4 is the same as S3 but with an additional CO that enables to evaluate the impact of a new resource on the
management of the crisis. The maximum waiting time dropped to 3 min and 43 s, and the QoS did not fall below 80% while the TtoR y reached 35 min and 30 s.
The simulation could be used more accurately and precisely to improve the operations management of ECCs. More scenarios can be tested to compare the results in order to obtain the most appropriate solution for this call center. However, the purpose of this article is not on improvement and scenario simulation but on the framework to show that it is possible to quickly assess the performance of the ECC.
V. CONCLUSION
Though ECCs have heterogeneous operations management, they share the same goal: save people’s lives. To achieve this, they need to challenge and improve their responsiveness, that is, to be faster and more efficient in answering calls, both in normal and crisis situations. In this article, we focused on the formal system, which has an access number and a call-taking system and was preponderant in European countries. Taking into account the complexity and differences in managing the operations of ECCs, we proposed a tool-based framework to assess and diagnose them and used a French case as an applica-tive example. Working with the real dataset of ECCs enables to build a digital twin with a behavior very close to the real world. Thanks to this digital twin, we can run experiments to
provide a better understanding of the ECC. In the real world, the profile of incoming calls, the service times for each type of resource, and the workforce management are extracted from the data by using process and data mining. The waiting time of calls is evaluated to assess the responsiveness of the ECC. The digital twin enables us to assess some new scenarios in normal and crisis situations, and also to evaluate their impact on the performance of the ECC. These scenarios make it possible to develop new organizational setups to enhance a better anticipation and prepa-ration of crises, with a more adapted planned emergency policy. Consequently, taking into consideration specific characteristics of an ECC allows to provide customized recommendations for improvement.
This framework will help to test new scenarios. Indeed, most of the studies on call centers do not consider the outgoing calls, which increase the complexity of the management of operations. Taking into account outgoing calls will require knowledge of the preemption rule between incoming and outgoing calls. Outgoing calls have an impact on the occupation rate of the resources. This is due to the fact that they take some time to make calls to the first responders or to find out if there are available rooms in the emergency department of hospitals. These calls are important too and need to be added in the process to improve our model validity.
Another interesting perspective would be to evaluate the financial feasibility of the scenarios that are simulated in order to improve the performance of the ECC. Very few studies on ECCs consider this aspect [29]. Furthermore, there will be need to investigate more precisely whether there is a link between the size of the ECC, the management of its operations, the management of its workforce as well as its performance. Study-ing the link between these parameters might enable to identify the best management for an ECC. Of course, the improvement phase must be developed and new scenarios in other parts of the process must be investigated. Also, other performance indicators should be considered to assess ECCs in a more comprehensive way.
Finally, there is no doubt that it would be very interesting to see the impact of access, process, platform and focus on the performance of an ECC. For example, regarding queues, one could imagine setting up a call-filtering system upstream (or even downstream) with an automatic call dispatcher or allowing call interruptions once the preassessment has been done to set aside the least critical calls in order to pick up calls more quickly.
REFERENCES
[1] “Recherche - SAE diffusion,” 2018. [Online]. Available: https://www.sae-diffusion.sante.gouv.fr/sae-diffusion/recherche.htm
[2] J. Claude, “Organisation des Centres 15 : “chaque appel compte, chaque seconde compte”,” MEAH, vol. 710, pp. 61–67, 2008.
[3] G. Robinson and C. Morley, “Call centre management: responsibilities and performance,” Int. J. Serv. Ind. Manag., vol. 17, no. 3, pp. 284–300, May 2006.
[4] E. Lamine, F. Fontanili, M. D. Mascolo, and H. Pingaud, “Improving the management of an emergency call service by combining process mining and discrete event simulation approaches,” in Proc. Risks Resilience
Col-laborative Netw., 2015, pp. 535–546.
[5] J. A. Fitzsimmons, “An emergency medical system simulation model,” in
Proc. 5th Conf. Winter Simul., New York, NY, USA, 1971, pp. 18–25.
[6] S. Su and C.-L. Shih, “Modeling an emergency medical services system using computer simulation,” Int. J. Med. Inf., vol. 72, no. 1, pp. 57–72, Dec. 2003.
[7] N. Sikka and G. Margolis, “Understanding diversity among prehospital care delivery systems around the world,” Emerg. Med. Clin., vol. 23, no. 1, pp. 99–114, Feb. 2005.
[8] T. J. Hodgetts and J. Smith, “Essential role of prehospital care in the optimal outcome from major trauma,” Emerg. Med., vol. 12, no. 2, pp. 103–111, 2000.
[9] E. S. Devlin, Crisis Management Planning and Execution. New York, NY, USA: Auerbach, 2006.
[10] N. Gans, G. Koole, and A. Mandelbaum, “Telephone call centers: Tutorial, review, and research prospects,” Manuf. Serv. Oper. Manag., vol. 5, no. 2, pp. 79–141, Apr. 2003.
[11] Y. Penverne et al., “Key performance indicators’ assessment to develop best practices in an emergency medical communication centre,” Eur. J.
Emerg. Med. Off. J. Eur. Soc. Emerg. Med., May 2017.
[12] A. N. Avramidis, W. Chan, and P. L’Ecuyer, “Staffing multi-skill call centers via search methods and a performance approximation,” IIE Trans., vol. 41, no. 6, pp. 483–497, Apr. 2009.
[13] K. J. Song et al., “Dispatcher-assisted bystander cardiopulmonary resus-citation in a metropolitan city: A before–after population-based study,”
Resuscitation, vol. 85, no. 1, pp. 34–41, Jan. 2014.
[14] R. Zhou and D. Soman, “Looking back: Exploring the psychology of queuing and the effect of the number of people behind,” J. Consum. Res., vol. 29, no. 4, pp. 517–530, Mar. 2003.
[15] B. Cleveland and J. Mayben, Call Center Management on Fast Forward:
Succeeding in Today’s Dynamic Inbound Environment. Berlin, Germany:
ICMI Inc., 1997.
[16] T. R. Robbins, D. J. Medeiros, and P. Dum, “Evaluating arrival rate uncer-tainty in call centers,” in Proc. Winter Simul. Conf., 2006, pp. 2180–2187. [17] C. M. Passmore and J. Zhan, “Determining appropriate staffing adjust-ments in a call center staff group,” in Proc. Int. Conf. Social Comput., 2013, pp. 1046–1053.
[18] J. G. Dai and S. He, “Estimating customer patience-time density in large-scale call centers,” in Proc. 7th Int. Con. Service Syst. Service Manage., 2010, pp. 1–5.
[19] M. Lafond, “Using erlang C to compare PSAPS,” Public Safety
Communi-cations Magazine. Daytona Beach, FL, USA: APCO Int., 2012, pp. 30–38.
[20] G. Koole and A. Mandelbaum, “Queueing models of call centers: An introduction,” Ann. Oper. Res., vol. 113, no. 1–4, pp. 41–59, Jul. 2002.
[21] R. B. Wallace and W. Whitt, “A staffing algorithm for call centers with skill-based routing,” Manuf. Serv. Oper. Manag., vol. 7, no. 4, pp. 276–294, Oct. 2005.
[22] M. Ahghari and B. Balcioˆglu, “Benefits of cross-training in a skill-based routing contact center with priority queues and impatient customers,” IIE
Trans., vol. 41, no. 6, pp. 524–536, Apr. 2009.
[23] A. Jaoua, P. L’Ecuyer, and L. Delorme, “Call-type dependence in multiskill call centers,” Simulation, vol. 89, no. 6, pp. 722–734, Jun. 2013. [24] O. Garnett, A. Mandelbaum, and M. Reiman, “Designing a call center with
impatient customers,” Manuf. Serv. Oper. Manag., vol. 4, no. 3, pp. 208– 227, Jul. 2002.
[25] L. Brown et al., “Statistical analysis of a telephone call center: A queueing-science perspective,” J. Amer. Statist. Assoc., vol. 100, pp. 36–50, 2005.
[26] T. R. Robbins, D. J. Medeiros, and T. P. Harrison, “Does the Erlang C model fit in real call centers?” in Proc. Winter Simul. Conf., 2010, pp. 2853–2864.
[27] N. Gans, N. Liu, A. Mandelbaum, H. Shen, and H. Ye, “Service times in call centers: Agent heterogeneity and learning with some operational consequences,” in Institute of Mathematical Statistics Collections, Beach-wood, OH, USA: Inst. Math. Statist., 2010, pp. 99–123.
[28] R. Aringhieri, M. E. Bruni, S. Khodaparasti, and J. T. van Essen, “Emer-gency medical services and beyond: Addressing new challenges through a wide literature review,” Comput. Oper. Res., vol. 78, pp. 349–368, Feb. 2017.
[29] L. Aboueljinane, E. Sahin, and Z. Jemai, “A review on simulation models applied to emergency medical service operations,” Comput. Ind. Eng., vol. 66, no. 4, pp. 734–750, Dec. 2013.
[30] R. G. Sargent, “Verification and validation of simulation models,” in Proc.
[31] B. F. van Dongen, W. M. P., van der Aalst, J. Castro, and E. Tentiento, “A meta model for process mining data,” in Proc. 2nd Open INTEROP
Work-shop Enterprise Modelling Ontologies Interoperability (EMOI - INTEROP ’05), 2005, pp. 309–320.
[32] V. A. Bolotin, “Telephone circuit holding time distributions,” in Teletraffic
Science and Engineering, vol. 1, J. Labetoulle and J. W. Roberts, Ed. New
York, NY, USA: Elsevier, 1994, pp. 125–134.
[33] R. P. Dwars, R. D. van der Mei, and S. Bhulai, “Capacity planning of emergency call centers,” Ph.D. dissertation, Dept. Centrum Wiskunde en Informatica, VU Univ., Amsterdam, The Netherlands, 2013.
[34] B. B. Zuzakova and G. J. Kommer, “Optimal emergency medical service system design,” M.Sc. thesis, Dept. Stochastics Financial Math., VU Univ., Amsterdam, The Netherlands, 2012.
[35] M. van Buuren, G. J. Kommer, R. van der Mei, and S. Bhulai, “EMS call center models with and without function differentiation: A comparison,”
Oper. Res. Health Care, vol. 12, pp. 16–28, Mar. 2017.
[36] N. R. Draper and H. Smith, Applied Regression Analysis. Hoboken, NJ, USA: Wiley, 2014.
[37] S. Bhulai, “Dynamic routing policies for multiskill call centers,” Probab.
Eng. Inf. Sci., vol. 23, no. 1, pp. 101–119, Jan. 2009.
[38] A. Roubos and O. Jouini, “Call centers with hyperexponential patience modeling,” Int. J. Prod. Econ., vol. 141, no. 1, pp. 307–315, Jan. 2013. [39] A. J. Mason, “Simulation and real-time optimised relocation for improving
ambulance operations,” in Handbook of Healthcare Operations
Manage-ment. New York, NY, USA: Springer, 2013, pp. 289–317.
[40] R. G. Sargent, “Verification and validation of simulation models,” J. Simul., vol. 7, no. 1, pp. 12–24, Feb. 2013.
[41] A. M. Law and D. W. Kelton, Simulation Modeling and Analysis. New York, NY, USA: McGraw·HiII, 2000.
[42] J. Tukey, Exploratory Data Analysis. London, U.K.: Pearson, 1977. [43] N. L. Johnson, “Bivariate distributions based on simple translation
sys-tems,” Biometrika, vol. 36, no. 3/4, pp. 297–304, 1949.
[44] E. P. Dalziell and S. T. McManus, “Resilience, vulnerability, and adaptive capacity: Implications for system performance.” 2004. [Online]. Avail-able: http://www.ifed.ethz.ch/events/Forum04/Erica_paper.pdf