HAL Id: hal-01688116
https://hal.archives-ouvertes.fr/hal-01688116
Submitted on 4 May 2018
HAL is a multi-disciplinary open access
archive for the deposit and dissemination of
sci-entific research documents, whether they are
pub-lished or not. The documents may come from
teaching and research institutions in France or
abroad, or from public or private research centers.
L’archive ouverte pluridisciplinaire HAL, est
destinée au dépôt et à la diffusion de documents
scientifiques de niveau recherche, publiés ou non,
émanant des établissements d’enseignement et de
recherche français ou étrangers, des laboratoires
publics ou privés.
Glycerol and bioglycerol conversion in supercritical
water for hydrogen production
Qian Michelle Yu-Wu, Elsa Weiss-Hortala, Radu Barna, Hélène Boucard, S.
Bulza
To cite this version:
Qian Michelle Yu-Wu, Elsa Weiss-Hortala, Radu Barna, Hélène Boucard, S. Bulza. Glycerol and
bioglycerol conversion in supercritical water for hydrogen production. Environmental Technology,
Taylor & Francis: STM, Behavioural Science and Public Health Titles, 2012, 33 (19), pp.2245-2255.
�10.1080/09593330.2012.728738�. �hal-01688116�
Glycerol and bioglycerol conversion in supercritical water for hydrogen production
Q.M. Yu-Wua, E. Weiss-Hortalaa, R. Barnaa∗, H. Boucardaand S. Bulzab
aRAPSODEE Center, Mines d’Albi, UMR 5302CNRS, Université Toulouse, Toulouse, France; bFacultatea de Chimie Industriala,
Universitatea Politehnica, Timisoara, Romania
Catalytic transesterification of vegetable oils leads to biodiesel and an alkaline feed (bioglycerol and organic residues, such as esters, alcohols. . .). The conversion of bioglycerol into valuable organic molecules represents a sustainable industrial process leading to the valorization of a renewable organic resource. The physicochemical properties in the supercritical domain (T > 374◦C, P > 22.1 MPa) transform water into a solvent for organics and a reactant favouring radical reactions. In this context, the conversion of bioglycerol in supercritical water (SCW) into platform molecules and/or high energetic gases (hydrogen, hydrocarbons) could represent an interesting valorization process. The reported research results concern the conversion of bioglycerol compared to pure glycerol. The experiments have been done in batch autoclaves (5 ml and 500 ml stirred). Solutions of pure (5 or 10 wt%) and crude (3.5 wt%) glycerol have been processed with or without catalyst (K2CO31.5 wt%) in the range of 450–600◦C. The molecular formula of bioglycerol was determined as C4.3H9.7O1.8Na0.1Si0.08. Glycerol was partially decomposed in the batch systems during the heating (42% before reaching 420◦C) and some intermediates (propanediol, ethylene glycol . . .) were quantified, leading to a proposition of a reaction pathway. Acrolein, a valuable platform molecule, was mainly produced in the absence of catalyst. No solid phase was recovered after SCW conversion of pure and bioglycerol in batch reactors. The optimal parameters for gasification were 600◦C, 25 MPa for bioglycerol and 525◦C, 25 MPa, for pure glycerol. In these operating conditions, 1 kg of pure or bioglycerol leads to 15 and, respectively, 10 mol of hydrogen. Supercritical water gasification of crude glycerol favoured the generation of light hydrocarbons, while pure glycerol promoted H2production. SCW conversion of glycerol (pure and crude) allows to obtain simultaneously energetic gases (respectively 2600 and 4000 kcal/kg glycerol) and valuable platform molecules.
Keywords: glycerol; K2CO3; hydrogen; supercritical water; crude glycerol
Introduction
The increase of energy consumption in the world asks for the exploitation of new resources in the context of the lim-itation of new oil sources and global oil production. In parallel, the high consumption of fossil fuels is considered as one of the major factors responsible for climate change, because of the generation and accumulation of more and more important quantities of CO2, one of the significant
greenhouse gases (GHGs). There is an urgent need for the development of new renewable energy sources, in parallel with the implementation of new processes. The biorefin-ery concept is considered to be vbiorefin-ery promising, making good economic sense open to interesting markets, char-acterized by high environmental performance, low impact and technical sophistication. This concept agrees very well with the idea of sustainable development. Its application facilitates the reduction of biomass residues and their val-orization in a more circular economy, by the production of bio-fuels, chemicals (platform molecules), polymers and materials. One of the major biorefinery applications is oilseed processing. The extracted vegetable oil, a complex
∗Corresponding author. Email: [email protected]
mixture of glycerol esters, is industrially transesterifi-cated with the production of biodiesel, which can be used in addition/replacement of transportation fuel (diesel). The process leads to a byproduct, also called bioglycerol or crude glycerol, a mixture composed mainly of glycerol that needs to be better valorized.
Among the different industrial processes proposed to be applied, the hydrothermal conversion of bioglycerol in supercritical water (SCW) presents interesting advantages, due to the simultaneous properties of water: solvent and reactant [1–3]. In fact, the process can be performed with-out the addition of chemical reagents and leads to partial gasification of the organics into highly valuable gases: H2,
low hydrocarbons and CO2. Obtained at high pressure, after
cooling the gas components can be separated based on their different water solubilities: it might be possible to separate a gas phase with high H2content at high pressure from a
liq-uid phase containing predominantly dissolved CO2, issued
from biomass processing. Valuable platform molecules can be separated from the liquid phase and the solid could be reused as a combustible.
The hydrothermal conversion of glycerol in SCW is a complex physicochemical process performed at tempera-tures higher than 374◦C and pressures up to 22.1 MPa. In
the supercritical region, water becomes an interesting sol-vent and reactant, known for its particular properties [1,2]. In fact, water is a unique phase [1] and has a behaviour close to a gas: low density [4], high diffusivity [2] and low viscosity [2]. Its dielectric constant decreases dramatically towards the critical point, leading water to be an excel-lent solvent for organics, but precipitates salts [2,5]. The ionic product of water increases towards the critical point (about a thousand times) and decreases more significantly after [2,6]. Consequently, the water reactivity changes and the role played in the reaction mechanisms also: in the (P,T ) domain before the critical point water favours ionic reac-tions, while after the critical point water promotes radical mechanisms [2,3,7]. Fine tuning of the (P,T ) couple of the hydrothermal system should allow one to orient the reac-tion system toward gasificareac-tion or to reacreac-tions producing platform molecules [8].
The conversion of glycerol solutions in the domain of SCW represents the main goal of our research program. Literature data pointed out the influence of temperature on glycerol degradation [9–13], most experiments being car-ried out in continuous processes. Therefore, we investigated the thermal stability of glycerol solutions with and without a catalyst at normal pressure using calorimetric methods. Because of the observed glycerol ability to partially degrade during the autoclave heating towards the critical tempera-ture, the composition of the contained solution has been also investigated. In fact, Watanabe et al. [14] showed that the addition of H2SO4 enhances the conversion of
glyc-erol into acrolein close to the supercritical point. A more comprehensive study of reaction mechanisms shows that a long reaction time favours gasification rather than acrolein production [10]. Antal et al. [15] showed a quasi-total con-version of glycerol into gas with a carbon-based catalyst, but they noticed an important catalytic effect of the reac-tor surface. Other studies were carried out with various catalysts: Ru/Al2O3 [16], Na2CO3 [17] or Ru/ZrO2 [9];
Ru-based catalysts are efficient in converting glycerol into hydrogen in a short reaction time, but solids are recovered. In the present study, alkali salts were used to promote the water gas shift reaction [18–20] and to model inorganic compounds of a real biomass.
A comparison between the hydrothermal supercriti-cal conversion of solutions containing pure and crude glycerol has also been done. The processes have been performed in batch reactors at two scales, 5 and 500 ml. Preliminary experiments have been done to select the oper-ating parameters. The effect of temperature (450–600◦C),
catalyst (K2CO3) and reaction time (5–120 min) are
pre-sented, while concentrations of glycerol (5 wt% for pure and 3.5 wt% for crude glycerol) and pressure (25 MPa) are kept constant. The collected gaseous and liquid phases have been characterized using specific analytical methods.
The analysis of gas composition as a function of time showed [21] that hydrogen content is quasi constant after 20 min of reaction time whatever the raw material. The increase of the total amount of gas is essentially due to the production of light hydrocarbons, in accordance with the thermodynamic equilibrium [16], since the kinetics improves hydrogen production at the beginning of the conversion. The decrease of the hydrogen amount after 60 min reaction time could be explained by its consumption towards the methanation reaction.
The first part of our work concerns the thermal behaviour of pure glycerol solutions at ambient pressure and during the heating step in a batch reactor, under auto-generated pres-sure. The second part concerns the comparative gasification of pure and crude glycerol solutions in the domain of SCW in order to predict crude glycerol behaviour in supercritical water gasification (SCWG).
Materials and methods
Reagents
Solutions were prepared with pure glycerol (C3H8O3,
100%, Fisher Scientific) or crude glycerol dissolved in ultra-pure water. Crude glycerol (pH = 11.4) was produced in a biodiesel pilot plant at Ecole des Mines de Nantes using methanol and NaOH. Obtained by alkaline transesterifica-tion, it was mainly composed of glycerol, Na glycerate, methanol, Na salts of carboxylic acids, etc. Its equiva-lent molecular formula, C4.3H9.7O1.8Na0.1Si0.08, has been
obtained by an average of four total elemental analyses. The hydrothermal experiments have been conducted with solutions containing pure glycerol (5 or 10 wt%) or crude glycerol (3.5 wt%). Due to a difference in the equivalent molecular formula, the solutions are compared based on the equivalent carbon amount. An alkaline catalyst, K2CO3
(99.0–100.0%, Prolabo), was also used at 1.5 wt%.
Batch reactors
Experiments were carried out in two kinds of batch reac-tors: 5 and 500 ml. The reactors are filled with a precise volume of liquid calculated to attain the desired pressure for the fixed temperature. As a consequence, temperature, con-version and initial load factor (volume solution/volume of reactor) control the final pressure in the autoclave. The final reaction temperature was reached with a known heating rate.
The 500 ml stirred autoclave (Top Industrie) was used to study the effect of the heating process on the compo-sition of pure glycerol solution. This reactor is composed of an Inconel 718 shell, in which a reaction shell in stain-less steel 316 was installed. The reactor can reach 500◦C
and 30 MPa with a maximum heating rate of 20◦C min−1.
An electric resistance insured the heating and the cooling was achieved by injecting cold air around the autoclave.
Stirring and temperature are controlled. Continuous moni-toring and time-dependent recording of temperature, pres-sure and heating power are carried out. A valve allows sampling the reaction media by efficient cooling down and recovery of the liquid. This device was used during the system heating: every 20◦C, between 120◦and 450◦C, the
inner reaction media was sampled to monitor the glycerol concentration.
The mini-autoclaves (5 ml) were in stainless steel 316, with inner and outer diameters of 8.5 and 31.4 mm, respec-tively. The copper seal ensures tightness between the two parts of the autoclave. With the volume being low, each experiment was carried out within five mini-autoclaves, running simultaneously; the reported results are the mean values of the five parallel experiments. The mass of the initial solutions varied from 0.362 (T = 600◦C) to 0.558 g
(T = 450◦C). The estimated final pressure in the autoclaves was in a range from 20 to 28 MPa. The process was con-ducted by placing the five mini-autoclaves in the preheated oven (Nabertherm L5/11/P320). After introduction, a heat-ing time of 10 min was necessary to attempt the desired temperature in the system. We consider that the reaction time is the residence time of the autoclaves in the oven at steady temperature. At the end of the desired reaction time (5–120 min), the autoclaves were removed and cooled down to room temperature (25 ± 2◦C) for about 25 min.
Then the autoclaves were placed in the calibrated sampling system for phase separation and collection. A manome-ter measured the overpressure in the system, which was used to calculate the produced gas volume. Finally, gaseous and liquid outflows were collected and analysed. For all the experiments, no solid was recovered from the 5 ml autoclaves.
Liquid phase analysis
Pure glycerol (C3H8O3) concentration was measured by
proton nuclear magnetic resonance (1H-NMR; Bruker
Avance 500 MHz with Top Spin software). The quantifica-tion was realized with internal calibraquantifica-tion by mixing 500 µl of TSPd4(2.43 mg l−1in D2O) and 100 µl of sample
solu-tions. The single proton used for quantification (in the CH) was referenced at 3.78 ppm.
Liquid samples were also analysed by gas chromatogra-phy (GC; Agilent 6890N, flame ionization detector (FID)) with an HP-Innovax column to quantify intermediates of the reaction: acetaldehyde, propionaldehyde, acrolein, ethanol, allyl alcohol, hydroxyacetone, 1,2-propanediol, methanol, 1-propanol, 2-propanol and ethylene glycol. The internal calibration was also realized using dimethylformamide and butanol.
The total amount of carbon (organic and inorganic) in the liquid phase after the reaction was measured with a total organic carbon (TOC) analyser (Shimadzu TOC-5050). Thermogravimetric analysis (TGA) measurements of glycerol solution were performed under N2at a heating
Table 1. Lower calorific values of some gas recovered in the gaseous phase and glycerol.
Lower calorific value (kcal mol−1)
C2H6 C2H4 H2 CH4 C3H8 CO Glycerol 340.5 315.6 57.1 191.1 487.5 67.5 348.1
rate of 1◦C min−1 from 30 to 320◦C using a TGA-DSC
B111 SETARAM instrument and a platinum crucible.
Gas phase analysis
The collected gas was analysed in a micro-gas chromato-graph (Agilent GC-3000) with four columns and four thermal conductivity detectors (TCDs). It is composed of H2, CO2, CO, CH4, C2H6, C2H4and C3H8.
Presentation of experimental data
Gasification represents the conversion of the initial organic matter from the liquid phase into gas; its efficiency (GE) is defined as follows and expressed as a percentage:
GE =!the mass of organic reagent ×!the mass of gas product 100% (1) Carbon and hydrogen conversions from glycerol to gas (H2,
CO2, CO, CH4, . . .) are expressed as
Xi= mass of C in gas i
mass of C in glycerol × 100% (2) XH2= mass of H in H2
mass of H in glycerol × 100% (3) The lower calorific value (LCV) of the gas produced was also calculated following Equation (4) and using the LCV values of each gas (Table 1):
LCV = PCI × mass glycerol!PCI × n gas i × 100% (4)
Results
Pure glycerol decomposition during the heating phase
Thermal decomposition of glycerol at ambient pressure Prior to the proposed batch hydrothermal experiments (under auto-generated pressure), the thermal sensibility of glycerol was investigated at ambient pressure using a TGA instrument. The heating rate controls glycerol behaviour at ambient pressure: the thermal decomposition of glycerol occurs at 170◦C at low heating rates and/or its
vaporiza-tion starts at 290◦C at high heating rates. The thermograms
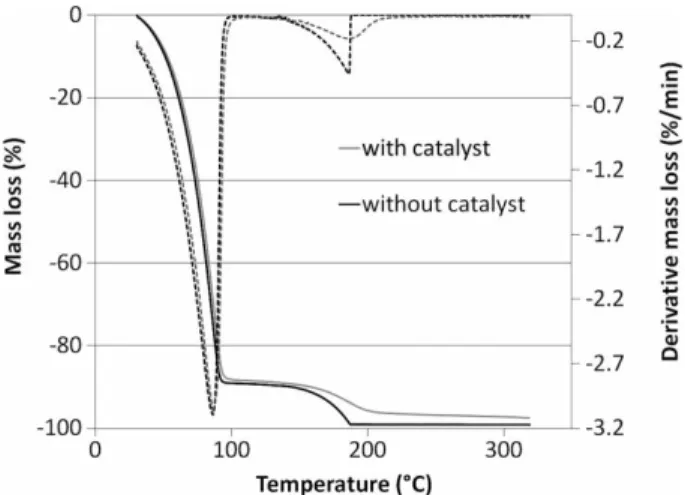
(Figure 1) have been realized under inert atmosphere (nitro-gen) at 1◦C min−1heating rate using a glycerol solution at
Figure 1. Mass loss (full lines) and derivative mass loss (dotted lines) of glycerol solutions with or without a catalyst. Glycerol: 10 wt%, K2CO3: 1 wt%, N2atmosphere, 1◦C min−1, aluminium crucible.
Figure 2. Profile of temperature (full line) and pressure (dotted line) in the reactor versus time during heating, 500 ml autoclave.
10 wt% with or without catalyst. The first mass loss (100◦C)
corresponds to the water evaporation, which represents 90% of the solution. A second low mass loss starts at 130◦C,
cor-responding to the decomposition/volatilization of organic compounds. This mass loss occurs at a lower temperature than that expected (170◦C) [13]. A similar behaviour was
observed by Dou et al. [13] for mixtures of glycerol and water or methanol. In this temperature region, the profile is modified in the presence of the catalyst. In fact, the end of the decomposition is abrupt without the catalyst, while the derivative mass loss is parabolic with the catalyst. The catalyst acts not only on the water gas shift reaction in the supercritical process, but also changes the thermal behaviour of the liquid solution at ambient pressure. Solu-tions with various concentration of glycerol in the presence of the catalyst were compared and the same profiles have been observed. The second remark concerns the value of the second mass loss. In the presence of the catalyst, the mass loss is lower than for the solution with the catalyst. This
slight difference is probably due to an interaction between glycerol molecules and the catalyst. A Fourier transform infrared (FTIR) spectrometer was coupled to the TGA appa-ratus for the detection of the various organic functions in the gas phase during this experiment. Unfortunately, no specific composition was revealed and the behaviour in this temper-ature region cannot be explained through modifications in gas composition.
In conclusion, glycerol decomposition started at a rela-tively low temperature (about 150◦C) under ambient
pres-sure and the reactivity of glycerol should not be neglected during the heating phase of its hydrothermal conversion. Moreover, the presence of a catalyst plays a role in the decomposition of glycerol molecules by enlarging the temperature range of the process.
Evolution of glycerol concentration during the heating step
Literature data showed that glycerol decomposition occurred rapidly in SCW. In fact, May et al. [9] obtained a complete conversion in a short time (8 s) in a con-tinuous reactor at 550◦C and 35 MPa using a Ru-based
catalyst. The main intermediates of glycerol decomposition are propionaldehyde, acrolein, hydroxyacetone, methanol, formaldehyde, . . . [9–12]. In a batch process, the glycerol decomposition can occur during the heating process and the catalyst can affect the kinetics. Two experiments were car-ried out in the batch autoclave of 500 ml with and without a catalyst. The contained glycerol solution at 10 wt% was submitted to the normal process: continuous stirring and heating of the autoclave. Liquid aliquots, sampled every 20◦C during heating from 120 to 450◦C, were analysed by 1H-NMR, GC and TOC analysis to determine the dynamics
of the solution composition. Figure 2 presents the profiles of temperature and pressure in the autoclave during the heat-ing. The heating rate varies from 13◦C min−1(until 170◦C)
to 4◦C min−1. The pressure increases more significantly
in the temperature range from 100 to 200◦C. According
to the results at ambient pressure, conversion reactions of glycerol can occur at this temperature in the presence or not of catalyst. Temperature-dependent composition of the
Table 2. Glycerol and TOC conversion during heating. The glycerol concentration was measured by1H-NMR with inter-nal calibration. The TOC measured with a TOC ainter-nalyser. The glycerol solution was at 10 wt% (1.0875 M), with catalyst (K2CO3).
% of glycerol converted % of TOC converted to liquid, solid and/or to liquid and/or Sample gaseous phase solid phases
120◦C 0 0
380◦C 33 25.6
420◦C 42 33.1
liquid phase is presented in Table 2 for the batch experiment performed with a catalyst.
Glycerol concentration (Table 2) decreases appreciably at 380◦C and 92% of glycerol is removed at the target
temperature of 450◦C. We can correlate the higher
reac-tivity of the system at 380◦C with the overcoming of
the supercritical point of water. Moreover, the increase in glycerol degradation at 450◦C could also be due to
the proximate critical temperature of pure glycerol: 453◦C
and 6.7 MPa. The successive 1H-NMR spectra show the
dynamics of formation/disappearance of various interme-diates. The TOC content in the liquid decreases simultane-ously during heating. The same process realized without a catalyst leads to a slower decrease in glycerol concentration and TOC.
In both cases, TOC removal is lower than glycerol disappearance, meaning that intermediates are formed in the liquid phase and their amounts are not negligi-ble. All the products cited previously were quantified (acetaldehyde, propionaldehyde, acrolein, hydroxyacetone, methanol, 1-propanol, ethylene glycol, allyl alcohol and 1,2 propanediol) in concordance with the literature [9–12].
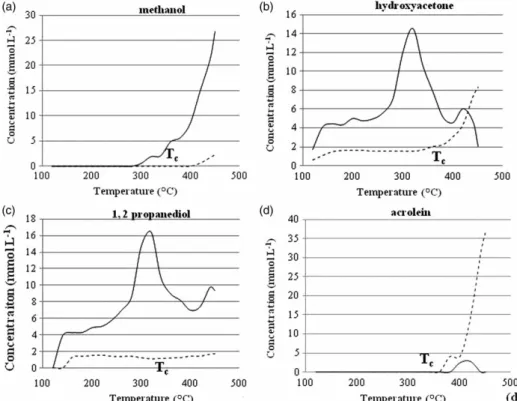
Figure 3 compares the temperature-dependent concen-tration for methanol, hydroxyacetone, 1,2-propanediol and acrolein, in the experiments performed with and without a catalyst. The species have been selected because of their relevance to the reaction mechanisms. The catalyst allows
their quantitative formation (except acrolein) at a lower temperature, before the water critical temperature.
As observed in Figure 3, methanol was formed at a lower temperature in the presence of the catalyst (280◦C
instead of 400◦C). The gap in the appearance temperature
for the other intermediates is lower: 20–30◦C. Although
the compounds have been formed below the critical point, the glycerol concentration decreased slowly. The first com-pounds formed shortly after 100◦C are hydroxyacetone and
1,2 propanediol, and their amounts are higher in the pres-ence of the catalyst. Concentrations of propionaldehyde and acetaldehyde are also higher in the presence of the catalyst. Acrolein, a valuable platform molecule, appears as a main product of glycerol non-catalytic conversion in SCW, while methanol is particularly produced in the presence of the catalyst. Methanol is supposed to be mainly produced by radical reactions [10]. May et al. [9] consider that acrolein is also produced by a radical reaction. Moreover, the authors propose a reaction mechanism by three main radicals that leads to different products [9]. As a consequence, the pres-ence of an alkaline catalyst seems to steer the mechanism pathway towards a radical reaction instead of an ionic one. The separation between the domain of radical and ionic reactions appears less distinct around the critical point of water. It is obvious that the catalyst decreases the activa-tion temperature of the reacactiva-tions. In fact, radical reacactiva-tions are supposed to be improved under supercritical conditions,
Figure 3. Evolution of the concentration of four intermediates versus temperature during the heating step of a glycerol solution (10 w%, 1.0875 M). Sampling every 20◦C in the 500 ml autoclave. Full lines referred to solution with a catalyst, while dotted lines corresponded to solutions without a catalyst.
favoured by the variation of the ionic product of water: Kw
increases from 10−14 to 10−11 towards the critical point
and then decreases dramatically, for example to 10−22 in
supercritical conditions.
The various compositions of the samples were in accor-dance with the colour variation of the solutions (not shown). Without a catalyst, the solution colour becomes slightly yel-low at 450◦C. In catalytic conversion, the solution takes a
slight brown colour in the region of the hydroxyacetone and 1,2 propanediol peaks (around 300◦C), returns to colourless
and takes an intense and troubled yellow colour at 440◦C.
In conclusion, the glycerol solutions processed in a batch autoclave towards the supercritical domain conduct dynamic modification of the liquid composition during the heating. The heating rate is supposed to strongly influence the glycerol decomposition. The next section presents the comparison of gasification efficiency of pure and crude glycerol, based on the carbon repartition and gas production.
Comparison of pure and crude glycerol gasification
The objective of this part is to compare the gasification effi-ciency, the carbon distribution and the composition of the gaseous products from crude and pure glycerol solutions with a view to predicting the crude glycerol gasification. All the operating parameters, such as temperature, reac-tion time, pressure, catalyst and glycerol concentrareac-tions, were studied. We observed that pressure (22–28 MPa) did not influence significantly gasification efficiency and gas composition [21]. The effect of glycerol concentration was relatively similar to the behaviour of other kinds of model molecules (glucose, phenol . . . [22]) and gas composition followed a relatively linear profile versus the concentra-tion [21]. On the contrary, the influence of temperature, reaction time and catalyst revealed interesting results, which are presented in this section. The carbon distribution consid-ers the TOC and IC (inorganic carbon) in the liquid outflow and the composition of the gaseous products. No solids were recovered, but oily phases were observed in some experi-ments. Their analysis and quantification were not realized,
due to small quantities. Therefore, the carbon balance is not looped.
Effect of crude glycerol composition and effect of the catalyst
The following equations represent the total conversion of pure (Equation (5)) and crude (Equation (6)) glycerol in water:
C3H8O3+ 3H2O −→ 7H2+ 3CO2 (5)
C4.3H9.7O1.8+ 3.4H2O −→ 8.25H2+ 4.3CO2 (6)
As a consequence, the amount of gas produced from crude glycerol should be higher, in accordance with the values of gasification efficiency. However, the H2 gas fraction
should be lower in the case of crude glycerol gasification. The gasification efficiency (Equation (1)) was compared for solutions containing crude and pure glycerol with the same initial TOC content. The processes (25 MPa, 5 wt% of pure or 3.5 wt% of crude glycerol, 1 h) have been conducted at different temperatures without a catalyst. The gasifi-cation efficiency increases with the process temperature (Figure 4(a)) and it is in accordance with the literature [23]. Gasification of crude glycerol is quasi achieved at 600◦C
(hydrogen represents 25 mol% in the gas) while GE reaches only 79% for pure glycerol (hydrogen represents 34 mol% in the gas). As expected, the gasification efficiency is higher and the molar percentage of hydrogen is lower than for pure glycerol. Two reasons can explain these different effi-ciencies. On the one hand, the crude glycerol contains ‘naturally’ some alkaline salts from the transesterification process of the oil, particularly Na salts [24]. These alka-line compounds can act as a catalyst, for example for the water gas shift reaction during the supercritical process. On the other hand, the equivalent molecular formula of crude glycerol presents different ratios of C/O and C/H compared to pure glycerol (C3H8O3). In fact, in the crude glycerol
(C4.3H9.7O1.8Na0.1Si0.08) H/O and C/O molar ratios are 5.4
and 2.4, respectively, compared to the pure glycerol: 2.7 and
Figure 4. Gasification efficiency obtained during SCWG of glycerol solution versus reaction temperature (batch reactor of 5 ml, 25 MPa, 1 h): (a) crude (3.5 wt%) and pure (5 wt%) glycerol solutions with similar TOC content, without a catalyst; (b) crude glycerol solution (3.5 wt%) with (0.5 wt%) or without a catalyst.
1, respectively. Crude glycerol contains relatively more car-bon and hydrogen than pure glycerol. The analyses of the gaseous products revealed that no carbon monoxide was produced during the gasification of crude glycerol, while CO appeared only without a catalyst during the gasification of pure glycerol solutions (not shown). As the alkaline cat-alysts improve the water gas shift reaction (and therefore the CO consumption), the alkaline content of crude glyc-erol seems to play a catalytic role. A comparative study of catalyst concentration was also realized (not shown) in the range of 0–5 wt% for crude glycerol and 0–7.5 wt% for pure glycerol (525◦C, 25 MPa, 5 wt% of pure or 3.5 wt% of crude
glycerol during 1 h). The gasification efficiency was maxi-mum for low concentrations of added catalyst whatever the origin of the glycerol and decreased with increasing cata-lyst concentration. Maximum GE values of 84% for pure glycerol solution and 77% for crude solution were reached at 0.5 wt% catalyst and are correlated to maximum TOC removal of 93 and 97%, respectively. The main gases pro-duced during SCWG of pure glycerol solution were CO2,
H2, CH4and C2H6. The CO2yield was slightly higher than
that of hydrogen. The highest hydrogen yield was obtained with 1.5 wt% K2CO3. The yields of each gas varied only
slightly at low concentrations of catalyst.
Concerning the gasification of crude glycerol solu-tions, the hydrogen yield was higher than that of CO2and
increased slightly with increasing K2CO3 amount (0.3–
0.8 wt%), followed by its stabilization. The yields of light hydrocarbons are quasi stable. Contrary to pure glycerol solutions, the CO2yield is reduced significantly with
cata-lyst increase from 0.8 to 5 wt%. This result is both surprising and interesting, since the increase in the amount of cat-alyst could lead to an increase in the total amount of CO2 (gas or dissolved, obtained from K2CO3). However,
the total IC measured in the liquid phase is not negli-gible and the dissolved CO2 is strongly favoured by the
alkaline pH of the liquid. The concentration of K2CO3has
little influence on the production of light hydrocarbons and hydrogen, except at high concentrations in the case of crude glycerol.
Figure 4(b) shows the effect of K2CO3(catalyst) on the
gasification efficiency of crude glycerol solutions. Taking into account the error bars, the catalytic effect of K2CO3is
minimal. The salts contained in the raw material catalyse gasification and the added catalyst has no significant con-tribution. At the same time, the decrease of TOC values is relatively similar for both solutions (not shown).
Effect of temperature on carbon distribution and gas composition
Figure 5 shows the effect of reaction temperature (450– 600◦C) on the carbon distribution from glycerol solutions
between gas and liquid outflows. The experiments were carried out with the following conditions: pure (5 wt%) or crude (3.5 wt%) glycerol, 25 MPa, 1 h and catalyst (1.5 wt% K2CO3). Organic carbon and IC in the liquid phase were
quantified and the contribution of carbonates from the catalyst was deduced from the IC values.
The part of carbon increases in the gas phase with the temperature for the two kinds of glycerol, while the organic carbon is removed from the liquid (Figure 5). At the lowest temperature, the part of organic carbon contained in liquid is higher for crude than for pure glycerol, meaning that gasi-fication is less efficient for crude glycerol solutions. This behaviour can be explained by crude glycerol composition, which is more ‘resistant’ at lower temperatures. Literature data outlines that gasification efficiency of most organic compounds from various biomasses is more efficient above 500◦C [8,19,22]. Up to 600◦C, the part of carbon in the gas
is higher for pure glycerol solutions. A ‘stabilization’ of gasification efficiency occurs after 550◦C for pure glycerol,
also observed by Potic [23] but at higher temperatures with another catalyst.
Figure 5. Carbon distribution versus temperature for pure and crude glycerol gasification in supercritical water (batch autoclaves of 5 ml). Pure (5 wt%), crude (3.5 wt%), 25 MPa, 1 h and catalyst (1.5 wt% K2CO3).
Figure 6. Variation of the gases yields (H2, CO2, CH4 and C2H6) versus temperature for pure and crude glycerol gasification in supercritical water (batch autoclaves of 5 ml). Pure (5 wt%), crude (3.5 wt%), 25 MPa, 1 h and catalyst (1.5 wt% K2CO3).
Figure 7. Carbon distribution between gas and liquid phase (TOC and IC) versus reaction time for pure and crude glycerol gasification in supercritical water (batch autoclaves of 5 ml). Pure (5 wt%), crude (3.5 wt%), 25 MPa and catalyst (1.5 wt% K2CO3).
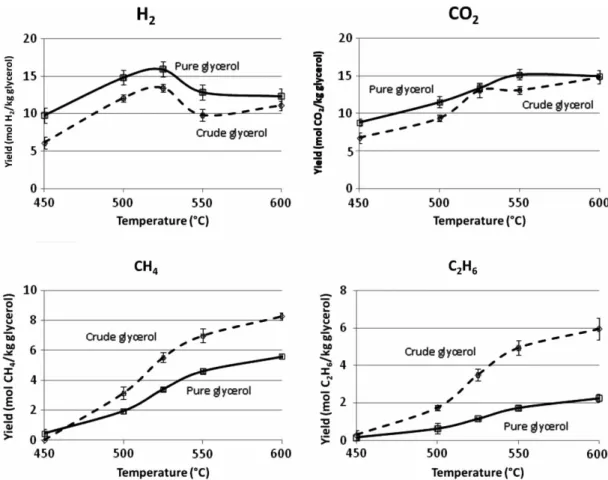
Figure 6 shows the production efficiency (mol/kg glyc-erol) of the main gases (H2, CO2, CH4, C2H6) during the
gasification process. Experiments are performed in parallel series under the same conditions (25 MPa, 5 wt% of pure or 3.5 wt% of crude glycerol, 1 h) but at different reaction
temperatures: 450, 500, 525, 550 and 600◦C. The yields
of the main produced gases follow similar profiles with temperature for both glycerols. The maximum hydrogen yield is obtained at 525◦C for both reactants. The yield
Figure 8. Gas composition versus reaction time for pure and crude glycerol gasification in supercritical water (batch autoclaves of 5 ml). Pure (5 wt%), crude (3.5 wt%), 25 MPa and catalyst (1.5 wt% K2CO3).
significantly higher for crude glycerol, probably due to its composition (incomplete extraction of the fatty acids/esters at the end of the transesterification).
Methane is not detected in the gas produced from crude glycerol solution at 450◦C, explaining the lower carbon
con-tent in the gas phase observed in Figure 5. We note C3H8
production at 500 and 550◦C with pure glycerol solution
and benzene production from crude glycerol solutions at 600◦C.
To resume, for a given temperature, gasification of pure glycerol preferentially produces hydrogen, while crude glycerol favours the generation of light hydrocarbons. The differences in behaviour can be attributed to the mineral and organic compounds contained in the crude glycerol. The highest hydrogen yield for the two kinds of glycerol is observed at 525◦C. However, global gasification efficiency
is higher at 600◦C for crude glycerol due to the
produc-tion of light hydrocarbons. The reacproduc-tion time used for these experiments is relatively long (1 h) and allows to approach thermodynamic equilibrium in the experiments.
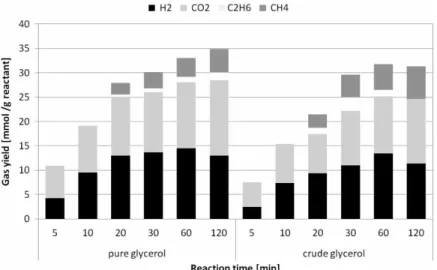
Effect of reaction time on carbon distribution and gas composition
The reaction time is one of the operating parameters con-trolling the gasification of glycerol solutions. Two parallel set of experiments have been performed on pure and crude glycerol solutions (respectively 5 and 3.5 wt%) containing K2CO3 catalyst. The steady parameters of each
experi-ment were temperature (525◦C) and pressure (25 MPa).
Different residence times of the mini-reactors have been tested, from 5 to 120 minutes. The increase of reaction time enhances the gasification efficiency up to 90%, the major part being performed during the first 20 minutes [21]. Figure 7 shows the global distribution of carbon between gas and liquid (TOC and IC) for pure and crude glycerol, while Figure 8 shows the distribution of the main gaseous
products versus the reaction time. The TOC content in the liquid phase decreases rapidly during the first period of the processes (Figure 7), correlated with the observed increase of gasification efficiency. Globally, the gasification of carbon increases with reaction time. In the case of crude glycerol, the formation of oily phases limits the looping of carbon balance. A longer reaction time, over 30 min, does not bring significant contribution to the global efficiency of gasification or to carbon repartition between gas, organic and inorganic phases. However, as observed in Figure 8, hydrogen content decreases slightly after 60 min, compen-sated by the increase of light hydrocarbon content generated by methanation reactions. At higher temperatures and reac-tion times, hydrogenareac-tion/methanareac-tion reacreac-tions become more significant.
The gasification of pure glycerol solutions allows global prediction of bioglycerol gasification behaviour in the same operating conditions. However, direct transposition is lim-ited by variation in crude glycerol composition. Gasification of crude glycerol solution leads to higher hydrocarbon con-tent. The optimal temperatures were 600◦C for bioglycerol
and 525◦C for pure glycerol producing 15 and 10 mol,
respectively, of hydrogen/kg glycerol.
Energetic comparison of the gas phase
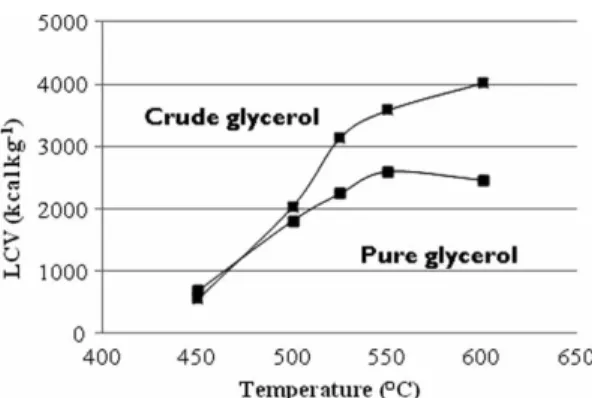
A brief energetic comparison of the gas produced by the gasification of glycerol and crude glycerol at different tem-peratures is proposed in Figure 9. Crude glycerol led to a more energetic gas than pure glycerol. This difference is due to the gas yield and its composition. In fact, hydrocarbons have higher LCV than hydrogen, as reported in Table 1. Taking into account the previous results, the gas produced by crude glycerol is richer in hydrocarbons, while the gas issued from pure glycerol gasification contains relatively more hydrogen. The ‘optimal’ temperature as regards to the highest LCV is 600◦C for crude and 550◦C for pure
Figure 9. Variation of the LCV of gas produced versus temper-ature during SCWG of pure and crude glycerol solutions (batch autoclaves of 5 ml). Pure (5 wt %), crude (3.5 wt%), 25 MPa, 1 h and 1.5 wt% K2CO3.
glycerol, which is not related to the highest H2production
(525◦C). Conclusion
Our research concerns the SCWG of solutions containing pure or crude glycerol. On the one hand, the thermal sta-bility of glycerol solutions has been studied at atmospheric pressure. Glycerol conversion occurs at relatively low tem-perature and the catalyst enlarged the temtem-perature range of its decomposition. On the other hand, the reaction system was sampled during the heating process of the autoclave under auto-generated pressure. The analyses highlighted severe decomposition of glycerol (92% in presence of cat-alyst) and TOC before reaching the fixed temperature in the supercritical domain. Among the intermediates formed, acrolein was favoured in the non-catalytic process while methanol was preferentially produced in the presence of the catalyst.
The gasification behaviour and the composition of the gaseous products were compared for both glycerols. The gasification efficiency increases with temperature and reaction time for both, while being higher for crude glycerol. The contribution of the catalyst to the bioglyc-erol gasification is negligible due to its alkaline con-tent. These organic and mineral compounds favoured the production of light hydrocarbons instead of hydrogen. Specific hydrogen production is higher for pure glyc-erol solutions: 15 mol H2/kg glycerol solution versus
10 mol H2/kg crude glycerol solution, while the LCV
of the gas produced from 1 kg of bioglycerol solution is 4000 kcal (at 600◦C) and 2600 kcal (at 550◦C) for pure
glycerol.
Acknowledgment
The authors thank Ms Maria Paraschiv, Energy Engineering Department of Ecole des Mines Nantes, who furnished the investigated crude glycerol.
The authors thank Mr Stéphane Massou, who analysed the glycerol by NMR at INSA Toulouse.
References
[1] A.A. Clifford, Reactions in supercritical water, Chim. Oggi. 11 (1993), pp. 36–37.
[2] A. Kruse and E. Dinjus, Hot compressed water as reaction
medium and reactant. 1. Properties and synthesis reactions,
J. Supercrit. Fluids 39 (2007), pp. 362–380.
[3] A. Kruse and E. Dinjus, Hot compressed water as reaction
medium and reactant. 2. Degradation reactions, J. Supercrit.
Fluids 41 (2007), pp. 361–379.
[4] P.E. Savage, S.G. Gopalan, T.I. Mizan, C.J. Martino, and E.E. Brock, Reactions at supercritical conditions: Applications
and fundamentals, AIChE 41 (1995), pp. 1723–1778.
[5] R.W. Shaw, T.B. Brill, A.A. Clifford, C.A. Eckert, and E.U. Franck, Supercritical water: A medium for chemistry, Chem. Eng. News 69 (1991), pp.26–39.
[6] J.W. Tester, A. Marrone, M.M. DiPippo, K. Sako, M.T. Rea-gan, T. Arias, and W.A. Peters, Chemical reactions and
phase equilibria of model halocarbons and salts in sub- and supercritical water (200–300 bar, 100–600◦C), J. Supercrit. Fluids 13 (1998), pp. 225–240.
[7] S.E. Hunter and P.E. Savage, Recent advances in acid- and
base-catalyzed organic synthesis in high-temperature liquid water, Chem. Eng. Sci. 22/23 (2004), pp. 4903–4909.
[8] A. Kruse, Hydrothermal biomass gasification, J. Supercrit. Fluids 47 (2009), pp. 391–399.
[9] A. May, J. Salvadó, C. Torras, and D. Montané, Catalytic
gasification of glycerol in supercritical water, Chem. Eng.
J. 160 (2010), pp. 751–759.
[10] W. Bühler, E. Dinjus, H.J. Ederer, A. Kruse, and C. Mas,
Ionic reactions and pyrolysis of glycerol as competing reac-tion pathways in near- and supercritical water, J. Supercrit.
Fluids 22 (2002), pp. 37–53.
[11] S. Adhikari, S. D. Fernando, and A. Haryanto, Hydrogen
pro-duction from glycerol: An update, Energy Convers. Manage.
50 (2009), pp. 2600–2604.
[12] N. Luo, X. Fu, F. Cao, T. Xiao, and P. P. Edwards,
Glyc-erol aqueous phase reforming for hydrogen generation over Pt catalyst – effect of catalyst composition and reaction conditions, Fuel 87 (2008), pp. 3483–3489.
[13] B. Dou, V. Dupont, P.T. Williams, H. Chen, and Y. Ding,
Thermogravimetric kinetics of crude glycerol, Bioresour.
Technol. 100 (2009), pp. 2613–2620.
[14] M. Watanabe, Y. Iida, T.M. Aida, and H. Inomata, Acrolein
synthesis from glycerol in hot-compressed water, Bioresour.
Technol. 98 (2007), pp. 1285–1290.
[15] M.J. Antal, S. Allen, J. Lichwa, D. Schulman, and X. Xu,
Hydrogen production from High-moisture content biomass in supercritical water, U.S. DOE Hydrogen Program
Review, 1999, pp. 1–24.
[16] A.J. Byrd, K.K. Pant, and R.B. Gupta, Hydrogen
produc-tion from glycerol by reforming in supercritical water over Ru/Al2O3catalyst, Fuel 87 (2008), pp. 2956–2960. [17] D. Xu, S. Wang, X. Hu, C. Chen, Q. Zhang, and Y.
Gong, Catalytic gasification of glycine and glycerol in
supercritical water, Int. J. Hydrogen Energy 34 (2009),
pp. 5357–5364.
[18] D. Sutton, B. Kezlleher, and J.R.H. Ross, Review of catalysts
for biomass gasification, Fuel Process. Technol. 73 (2001),
pp. 155–173.
[19] Y. Matsumura, T. Minowa, B. Potic, S. R. Kersten, W. Prins, W.P. van Swaaij, B. van de Beld, D.C. Elliott, G.G. Neuen-schwander, A. Kruse, and M.J. Antal, Biomass gasification
in near- and super-critical water: Status and prospects,
Biomass Bioenergy 29 (2005), pp. 269–292.
[20] J. Yanik, S. Ebale, A. Kruse, M. Saglam, and M. Yüksel, Biomass gasification in supercritical water: II.
Effect of catalyst, Int. J. Hydrogen Energy 33 (2008),
pp. 4520–4526.
[21] Q. Wu, Study of biomass conversion in supercritical water
processes to produce hydrogen: Application to glucose, glycerol and bio-glycerol, Ph.D. diss., Toulouse University,
2012.
[22] E. Weiss-Hortala, A. Kruse, C. Ceccarelli, and R. Barna,
Influence of phenol on glucose degradation during
super-critical water gasification, J. Supercrit. Fluids 53 (2010),
pp. 42–47.
[23] B. Potic, Gasification of biomass in supercritical water, Ph.D. diss., Twente University, 2006.
[24] S. Sinha, A.K. Agarwal, and S. Garg, Biodiesel development
from rice bran oil: Transesterification process optimiza-tion and fuel characterizaoptimiza-tion, Energy Convers. Manage. 49