HAL Id: hal-02431730
https://hal-mines-paristech.archives-ouvertes.fr/hal-02431730
Submitted on 21 Jan 2020
HAL is a multi-disciplinary open access
archive for the deposit and dissemination of
sci-entific research documents, whether they are
pub-lished or not. The documents may come from
teaching and research institutions in France or
abroad, or from public or private research centers.
L’archive ouverte pluridisciplinaire HAL, est
destinée au dépôt et à la diffusion de documents
scientifiques de niveau recherche, publiés ou non,
émanant des établissements d’enseignement et de
recherche français ou étrangers, des laboratoires
publics ou privés.
multiphase material under dry conditions: application to
peridotites
Jean Furstoss, Marc Bernacki, Carole Petit, Julien Fausty, Clément Ganino,
Daniel Pino-muñoz
To cite this version:
Jean Furstoss, Marc Bernacki, Carole Petit, Julien Fausty, Clément Ganino, et al.. Full field and
mean field modeling of grain growth in a multiphase material under dry conditions: application to
peridotites. Journal of Geophysical Research : Solid Earth, American Geophysical Union, 2020, 125
(1), �10.1029/2019JB018138�. �hal-02431730�
Full field and mean field modeling of grain growth in
a multiphase material under dry conditions :
application to peridotites
Jean Furstoss
1, 2*, Marc Bernacki
2, Carole Petit
1, Julien Fausty
2, Clément Ganino
1, Daniel
Pino-Munoz
2Abstract
We present a full field framework based on the level-set (LS) approach, which enables to simulate grain growth in a multiphase material. Our formalism permits to take into account different types of second phases, which can be static or dynamic (i.e. evolving also by grain growth) and reproduce both transient (evolving relative grain sizes) and steady-state structures. We use previously published annealing experiments of porous olivine or olivine and enstatite mixtures to constrain the parameters of the full field model, and then analyse the results of a peridotite-like annealing simulation. The experimental grain growth kinetics is very well reproduced while the simulated microstructure morphologies show some differences with experimental ones. We then propose a mean field model calibrated thanks to the full field simulations, which allow us to predict the mean grain size evolution depending on the simplified peridotite composition (e.g. second phase mean grain sizes, fractions).
Grain growth kinetics, multiphase materials, full field and mean field modelling, level-set, peridotites
1Université Nice côte d’Azur, CNRS, OCA, IRD, Geoazur, France
2MINES ParisTech, PSL Research University, CEMEF-Centre de mise en forme des matériaux, CNRS UMR 7635, France
*Contact: furstoss@geoazur.unice.fr
Contents
1 Introduction 1
2 Physical processes and methods 2
2.1 Smith-Zener drag/pinning . . . 2 2.2 Beyond Smith-Zener pinning. . . 3
3 Full field simulation results 4
3.1 Material parameters . . . 5 3.2 Case of SSP acting as Smith-Zener pinning particles
5
3.3 Case of primary and secondary phases growing simultaneously. . . 6 3.4 Peridotite-like grain growth . . . 7
4 Discussion 7
4.1 Grain growth kinetics and microstructure morpholo-gies. . . . 7
4.2 Mean-field model . . . 8
Smith-Zener pinning drag pressure•Interphase boundary pin-ning drag pressure•Total mean grain size evolution law
4.3 Adequation of mean field models with short and long term annealing experiments . . . 11
5 Conclusion 12
Appendices 12
A Appendix Volume conservation enforcement 12
6 Aknowledgments 13
References 13
1. Introduction
Depending on thermal and mechanical conditions, defor-mation of rocks may involve grain size sensitive (GSS) creep mechanisms [7]. In upper mantle rocks for instance, these phenomena are known to contribute non negligibly to the bulk deformation of the lithosphere [18,14]. Studying the grain size evolution of peridotites at lithospheric depths can there-fore provide important insights into the mechanical behaviour of tectonic plates.
Grain size evolution involves different mechanisms acting at the microscopic scale, from grain boundary migration (GBM) to nucleation and recrystallization (RX). In natural and some experimental conditions, all of these microscopic mechanisms act simultaneously and are often coupled with each other. Their individual effect on the kinetics of microstructures is not completely understood. Hence, it appears important to study these mechanisms separately in order to understand them and their effects on the microdynamics. To this purpose, deciphering the kinetics of grain growth in natural peridotites necessitates understanding GBM first within pure olivine (the principal mineral in upper mantle rocks) aggregates, then
examining how GBM is modified by the presence of second phases (either static or evolving by grain growth).
The full field level-set (LS) approach has demonstrated its capability to model several microstructural evolutions in metallic materials [6,26,36] and was recently used to model isotropic grain growth in pure olivine aggregates [13]. In this paper, we use recent [12] and well established [2,37] tech-niques of the LS framework to take into account the presence of second phases (SP), in order to simulate, using full-field modeling, the grain size evolution of real mantle rocks under dry conditions.
We then compare the full field results obtained with a mean field model based on the work of [4] which describes the grain size evolution as a function of the different SP fractions and is calibrated for the temperatures of the upper mantle.
2. Physical processes and methods
While peridotites are mostly composed of olivine (gen-erally close to forsterite composition with Mg/(Mg+Fe) near 0.9), they display a large variability in terms of mineral com-position, which depends on the nature and proportion of sec-ond phases. Major secsec-ond components are pyroxene (clino and orthopyroxenes, for instance pigeonite and enstatite, re-spectively) which can reach as much as 30% in volume frac-tion. It has been shown experimentally [19] that pyroxene and olivine grains coarsen simultaneously through capillarity-driven olivine/olivine (Ol/Ol) and pyroxene/pyroxene (Px/Px) GBM. In the following, we will designate this type of SP by dynamic second phase (DSP). Other minor SP in mantle rocks are generally alumina phases which can take different forms depending on temperature, pressure and water content (e.g. spinel, garnet, plagioclase). These minor phases are chemically distinct from the olivine and pyroxene, and as we consider dry conditions, their growth can occur only by slow diffusion processes. The aluminium diffusion required for the growth of these second phases has very low diffusion coeffi-cients [41,33]. Thereby, these grains of second phases grow so slowly that we will consider them as static and we will call them static second phase (SSP) in the following. Even present as a few volume percent, they can have a strong influence on grain growth of major phases by impeding the GBM through a Smith-Zener pinning mechanism [40] (figure1). In natural conditions, mantle rocks can also contain very minor minerals (e.g. pyrrhotite, rutile, phlogopite) holding marginal chemical species and for which the grain growth seems unlikely (i.e. they are very long timescale SSP). Finally, peridotites can also contain pores which can be formed by fluid circulation [44] (e.g. from deserpentinization process, partial melting). From the grain growth point of view, their effect can be similar to the one of second phase grains by impeding grain boundary migration [3].
2.1 Smith-Zener drag/pinning
Without stored energy, the interaction between a grain boundary and a SSP can be quantified by the classical mean
field Smith-Zener drag formulation [40]. With this approach, a SSP can block or "pin" a surface by imposing a drag pres-sure (Pdrag) on the moving grain boundary. By approximating the interaction between grains and SSP thanks to an addi-tional driving pressure, Pdrag, the grain boundary velocity is
classically expressed as follows [16] :
~v = M(P − Pdrag)~n = M(−γκ − Pdrag)~n, (1)
where M is the grain boundary mobility expressed through an Arrhenius law (i.e. M = M0e−
Q
RT, with M0the reference
mobility, Q the activation energy, R the gas constant and T the temperature in Kelvin), P = −γκ is the driving pressure due to capillarity with γ the interface energy and κ its mean curvature (curvature in 2D and the sum of the main curvatures in 3D), and ~n is outward unit normal to the boundary. This formulation (with a drag pinning pressure) represents the equilibrium conditions between the particle (γ1P, γ2P) and the
grain boundary energy (γ), which corresponds to Herring’s law [15]. By considering the geometrical model presented in figure1, the drag force exerted by the SSP on the grain boundary can be expressed as :
Fdrag= 2πrγcos(θ )sin(θ + α), (2)
which is equivalent to,
Fdrag= πrγ(sin(2θ + α) + sin(α)), (3)
where r is the radius of the SSP. This expression allows for a coherent or incoherent nature of the SSP in the matrix. In fact, a non null angle α allows to consider γ1P6= γ2P(meaning
generally that the SSP is coherent with one of the grains) while α = 0 implies the isotropy of these interfacial energies meaning, except special cases, that the SSP is incoherent with the matrix. By applying to sin(α) Herring’s law with the different interfacial energies and substituting in eq.(3) we get : sin(α) =γ2P− γ1P γ , (4) Fdrag= πrγ(sin(2θ + α) + γ2P− γ1P γ ). (5)
Thus, the maximum pinning force occurs for θ equal to (45◦−
α
2) which is the effective force considered to compute the Pdrag
effect of a mono-disperse SSP in the Smith-Zener formalism and state-of-the-art mean field models.
The LS framework already presented by [13] is naturally able to take into account the pinning phenomenon [2,37] without any assumption on the expression of the dragging pressure or material parameters calibration. By imposing an
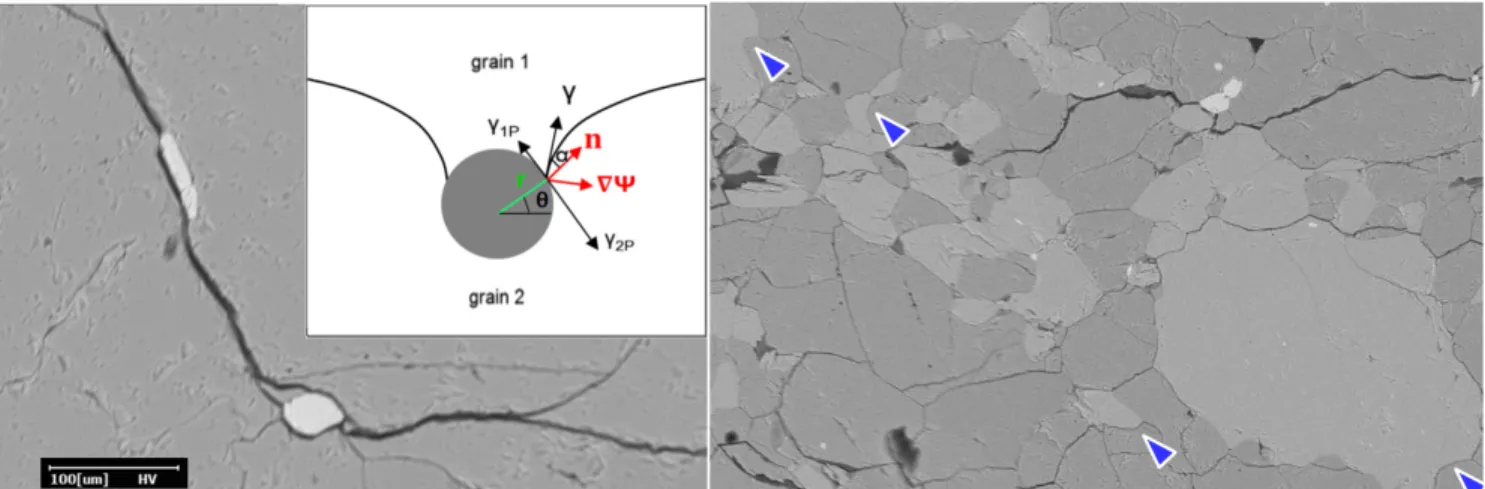
Figure 1.Electron Back Scattered (EBS) - Scanning Electron Microscope (SEM) image of a peridotite from the French Massif Central, left : an Ol/Ol grain boundary pinned by spinel particles and the geometrical model of the interaction between a SSP and a grain boundary from [3], right : the light and dark gray phases are orthopyroxene and olivine respectively, the arrows show some curved interphase boundaries impeded by triple junctions.
angle α, verifying Herring’s law i.e. the left part of Eq.4, when a grain boundary is passing through a SSP, the local mean curvature of the boundary will be adequately modified, naturally inducing pinning. It is important to highlight that this full field approach enables to avoid the introduction of a fictitious Pdragpressure in the kinetics relation as in Eq.(1).
In practice, the SSP are described by voids in the FE mesh and an angle α is imposed by applying boundary conditions along the void boundaries. In this work, these conditions are the ones used by [2], which imposes the orthogonality of grain boundaries with the domain boundaries (and thus SSP bound-aries) implying α = 0. As the different interfacial energies of the aluminium-rich phase (or very minor phase)/olivine sys-tem are not well constrained it seems reasonable to consider the two surface energies γ1Pand γ2Pas similar by imposing a
null angle α. This approach has shown its efficiency for metal-lic materials [3,1], in predicting grain growth kinetics and the possible limiting mean grain size [37]. Those results and others [17,27] show a strong influence of the presence of SSP on microstructural evolution even when they only represent a few percent of the rock volume.
2.2 Beyond Smith-Zener pinning
The classical Smith-Zener pinning mechanism may not be applicable when major and secondary phases have both comparable grain sizes and volume fractions, which can be the case for olivine and pyroxenes in peridotites. Moreover, synthetic peridotites (olivine-like+pyroxene-like) annealing experiments [31,19] show that both olivine and pyroxene grains appear to grow simultaneously. The evolution of the mean grain size of each phase with time follows an inverse power-law relationship (i.e. R ∝ t1n, with R the mean grain
size), with n varying for the two phases with the composition of the sample but are relatively close to each other. It was also
shown by [19] that the migration of an interphase boundary is much slower than that of a grain boundary. Interphase bound-ary migration can be explained by driving pressures resulting from phase transformation and capillarity. The capillarity pressure term, P = −γκ (the notation σ , rather than γ, being often used for phase evolutions), is identical to the capillarity pressure term acting on grain interfaces with of course dif-ferent values of interface energies and mobilities. This term, leading to the balancing of multiple junctions, explains also the Gibbs-Thomson effect in context of phase interfaces and so the Ostwald ripening mechanism (i.e. long range diffu-sion) [23]. In fact, the Ostwald ripening corresponds to a low evolution with competition and equilibrium between small diffusion fluxes at interphase boundaries and capillarity at these interfaces (by keeping constant global phase fractions). In the considering context and following the state of the art [31,19,4], some hypotheses can be done. First, in the absence of fluid (over or under saturated in Si4+ ions) the chemical potential gradient related to phase change in between Px and Ol can be considered as very slight and so volume fraction of the different phases assumed as constant. Thus, migration of the phase interfaces can be considered as driven mainly by the capillarity pressure, i.e. the reduction of interfacial energy, leading to short term migration (multiple junctions balancing) and long term evolution (the interphase energy decreasing being responsible of local composition gradient and volume diffusion affecting the local velocity and leading to the well-known Ostwald ripening mechanism). Thus, under dry conditions, it seems relevant to considerer a low capil-larity pressure as the preponderant mechanism in interphase migration as sometimes considered in the literature [4,5]. A statistical measurement of the different triple junctions of annealed microstructures permits, applying Herring’s law, the approximation of the different interfacial energies. Knowing
the interfacial energy of an Ol/Ol grain boundary (γOl/Ol=
1J.m−2, [9]), [42] found γPx/Px= 0.8J.m−2and γOl/Px= 0.85J.m−2.
These values, which will be considered as constant by phase (no crystallographic dependence), constrain triple junction angles between both phases to be nearly 120◦. Furthermore, as the local curvature of boundaries close to multiple junc-tions is very high, the driving pressure due to capillarity is important enough to allow for the migration of interphase boundaries. Since these boundaries have very slow migration velocities, the equilibration of triple junctions will cause inter-phases to be curved (figure1). This effect has already been noticed by [24] under the name of "surface tension driven phase boundary migration".
Recent developments in the LS framework [12] have per-mitted to consider a non homogeneous interfacial energy throughout the microstructure. This formalism proposes to describe the simulated microstructure by a certain number of LS functions ψi. Each function represents a set of
non-neighboring grains by the signed distance (positive and nega-tive respecnega-tively inside and outside the grain) to the interfaces of the grains. The different grain boundaries are then located at the 0 isovalue of the LS functions and the microstructure evolves through the transport of the these functions. The classical LS transport equation is modified in order to take into account the spatial variation of the interfacial energy. If the metric properties of the LS functions are respected (i.e. k∇ψik = 1) the strong formulation for a pure grain growth
(only driven by capillarity) problem takes the form :
∂ ψi
∂ t + M∇γ∇ψi− γM∆ψi= 0. (6) This formulation ensures that triple junctions respect Young’s equilibrium. It has been shown by [12] that only considering the first and third terms of eq.(6) (i.e. classical strong formu-lation) with an heterogeneous γ field leads to triple junctions equilibrated at 120◦. Taking into account of the second term of eq.(6) permits to respect Young’s law at triple junctions ac-cording to the different interfacial energies in place but also to respect the local γ values in the boundaries kinetics. Of course, if this formalism allows to consider the capillarity pressure in all its complexity for grain and phase interfaces, resulting slight local composition gradient at interphase boundaries and subsequent volume diffusion of Si4+ions is not modeled in the proposed FE framework. This aspect can be seen as an ambitious perspective of the proposed numerical framework in terms of numerical complexity and necessary experimental data. In the proposed framework, this aspect is treated roughly by ensuring the volume conservation of each phase. At each resolution time step, the DSP volume gained or lost is then redistributed throughout the microstructure (see appendixA). To summarize, in order to model the grain growth within a forsterite (Mg rich end-member of olivine) + enstatite (Mg rich end-member of pyroxene) system, we proceed as follows :
• the heterogeneous fields γ and M are defined at the dif-ferent types of interfaces (Fo/Fo, En/En, Fo/En bound-aries, see table1and section3.1).
• These fields are extended and regularised in order to make them differentiable by using the same method as [12].
• The pre-Laplacian term of eq.(6) is calculated using these two heterogeneous fields.
• The pre-convective term of eq.(6) is calculated by using the heterogeneous γ field and a homogeneous M field at a value equal to the one used for the of grain boundaries. • The transport of the LS functions is obtained by solving
eq.(6) through a FE framework (see [12] for details on FE integration procedure).
• The DSP volume gained or lost is then redistributed throughout the microstructure during a last transport step of the LS functions in order to ensure the volume conservation of each phase (see appendixA).
This methodology takes into account both the very slow displacement of the interphase boundaries through a curva-ture driven pressure (described by the third term of eq.(6)), and its movement in order to respect the equilibrium angles at the multiple junctions (described by the second term of eq.(6)). Moreover, the curvature driven motion of the inter-phase boundaries involves to the smaller DSP grains to shrink, and this for the benefit of the larger grains through the vol-ume redistribution step. Thus, the Ostwald ripening is in fact taken into account by considering very precisely the capillar-ity force at each kind of interface and by approximating (by homogenization at the multiphase polycrystal scale) the effect of residual diffusion fluxes.
3. Full field simulation results
Within this section, after having exposed the material parameters used, we present different full field simulation results. First we present simulations of olivine grain growth with SSP, then forsterite plus DSP (enstatite in this case) and finally the case of a peridotite-like (olivine plus enstatite plus SSP) grain growth. All initial microstructures are generated using a Laguerre-Voronoï Dense Sphere Packing (VLDSP) algorithm [20] which permits to respect precisely a grain size distribution in context of initial polygonal grain shapes. In the case of second phase growing simultaneously (i.e. DSP) the volume of second phase is randomly distributed among the generated grains in order to respect an imposed DSP mean grain size. Finally, we use numerical conditions (grain size, temperature, time) compatible with existing experimental data, i.e. a large number of very small grains and relatively short annealing times.
3.1 Material parameters
The different material parameters used for the full field simulations presented in this section are listed in table1. The values of γ are taken from the literature (see section2.2). The mobility value of the Fo/Fo grain boundaries is calibrated on the pure forsterite grain growth experiment of [19] considering the same activation energy than an Ol/Ol grain boundary [13]. The En/En grain boundary mobility (reference mobility and activation energy) is the one determined by [39]. For the inter-phase boundary mobility we took the value that best replicates the experimental results of [19] assuming the activation energy determined by [28] based on forsterite plus enstatite annealing experiments. For the latter mobility we find a value 3 order of magnitude lower than the one of Fo/Fo grain boundary which is consistent with previous study [4].
Table 1.Material parameters used for the full field simulations, from a [13], b present study, c [39], d [9] and e [42].
These parameters have to be carefully considered and in par-ticular the temperature dependence of the mobilities (i.e. acti-vation energies). In fact, the temperature range used for their determination is very small (1473-1573K for QOlfrom [13]
and 1533-1673K for QFo/En from [28]) or even null (only
1633K for QFofrom the present study, see section3.3).
3.2 Case of SSP acting as Smith-Zener pinning par-ticles
In this section, the initial grain size distribution and the ma-terial parameters used are the ones determined in 2D by [13] using the experimental data of [22] for pure olivine. The effect of SSP is studied by introducing different volume frac-tions (0.2, 5 and 10%) of spherical particles with different mean grain sizes (0.25, 0.5, 0.75 and 1 as a fraction of the initial olivine mean grain size) with a small standard deviation (< 0.2µm). The calculation domain size is 0.2x0.2mm, the initial number of grains is approximately 4000 and the tem-perature is 1573K. The mean grain size evolutions are plotted in figure2for an SSP mean size of 0.5 times the initial olivine grain size and for the different SSP volume fractions.
Figure 2.Full field predicted mean grain size evolutions are for an initial grain size distribution similar to the one used by [22]. Grain boundary mobility is calibrated on the 0% static second phase (SSP) fraction grain growth experiment as explained in [13], the SSP and the olivine mean grain size are 0.8 and 1.7µm respectively. The experimental data come from [30] and the mean field predictions (dotted line) are from section4.2.1.
The experimental data plotted in figure2come from an-nealing of porous olivine aggregates [30] where pores are impeding the grain growth. The initial volume fraction and the size of pores are not well constrained but may be esti-mated between 1 and 5% and close to 0.5 times the initial mean grain size respectively, thus our simulations initial con-ditions are comparable with this experiment. [30] noticed an increase of the pore size during annealing, which results in non frozen microstructure, not reaching a limiting mean grain size (see figure2). As the size and number of SSP imposed in the full field simulations do not evolve, the model shows the same trend as in experiments at the beginning of the simula-tion, then quickly reaches a limiting mean grain size. Figure
2shows a significant decrease of the grain growth kinetics when the volume fraction of the SSP increases, and other simulations with different SSP sizes show the same trends. Usually the presence of homogeneously dispersed SSP also imposes a limiting mean grain size [37] which corresponds to a totally pinned microstructure. Figure2shows that for 5 and 10% of SSP volume fraction, the limiting mean grain size is small and rapidly reached. For 0.2% of SSP volume fraction, higher limiting mean grain size is expected, and takes more time to reach (mean field model from section4.2.1predicts a limiting mean grain size near 28µm obtained in 50 hours). The other full field simulations show also that by increasing the SSP volume fraction, the limiting mean grain is lower and is reached faster.
We then try to estimate the effect of the SSP size for a given SSP volume fraction on the grain growth kinetics. In fact, for the same SSP volume fraction the microstructure where the SSP size is the lowest has the lowest limiting mean
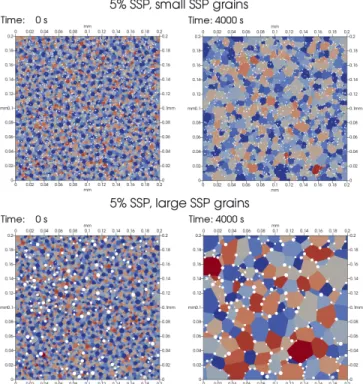
Figure 3.Left, initial microstructures with 5% of static second phase (SSP) fraction for SSP mean grain size equal to 0.5 (top) and 1 (bottom) time the initial olivine mean grain size. Right, microstructures after 4000s annealing at 1573K. The grain colors are related to the index of the global level set function which describes the considered grain [38].
grain size and the slowest grain growth kinetics (figure3). This is due to the fact that for a similar volume, the cumulated surface of the pores interacting with the crystalline matrix is more important when the pores (or SSP) are small and dispersed.
3.3 Case of primary and secondary phases grow-ing simultaneously
We then performed full field simulation of grain growth in a biphase material where the two phases grow simultaneously, using the method presented in section2. We compare the predicted mean grain size evolutions with the ones obtained experimentally by [19] during an annealing treatment of dif-ferent forsterite and enstatite mixtures. As the major phase is forsterite, we cannot use the material parameters of natural olivine as in the previous section. Thus we used the same methodology as in [13] to obtain, from the pure forsterite annealing experiment, the 2D grain boundary mobility. How-ever, as the data from [19] have been obtained only for one annealing temperature, we cannot determine the activation energy, which describes the temperature dependence of the grain boundary mobility. Thus, the activation energy will be considered equal to that of a natural olivine (Fo 92%) grain boundary. Nevertheless, the obtained grain boundary mobility after calibration is 4.9 · 10−4mm4.J−1.s−1, which is valid at
1633K whereas the natural olivine 2D grain boundary mobil-ity at this temperature was 4.9 · 10−2mm4.J−1.s−1. The initial mean grain sizes for each phase are the ones given by [19] which permits a direct comparison with the experimental re-sults in terms of total mean grain size (figure4) or mean grain size for both phases (figure5).
Figure 4.Total mean grain size evolution during
experimental (dots from [19]), simulated (solid lines) and predicted by the mean field model (dashed lines, see section
4.2.2) annealing treatments at 1633K for different dynamic second phase (DSP) fractions
Figure 5.Mean grain size evolution for each phase during experimental (dots from [19]), simulated (solid lines) and predicted by the mean field model (dashed lines, see section
4.2.2) annealing treatments at 1633K for the 3% and 9% dynamic second phase (DSP) fraction systems.
The grain size evolutions predicted by the full field LS approach are in very good agreement with experimental data (figures4and5), excepted for the pure forsterite case for which we calibrated the Fo/Fo grain boundary mobility. The simulated grain size evolution for 0% DSP fraction show a quasi linear trend while the experimental one tends to a limit mean grain size. For this case (pure forsterite) we suspect the presence of a small amount of SSP, this point is discussed in
the section4.3.
The ratio between the major phase (forsterite) mean grain size and the DSP mean grain size is not constant over the simulation durations at least for DSP fractions ≤ 15% (figure
6). However for 24% of DSP fraction, this ratio seems to be constant during all the simulation, which suggests that this ratio could be taken into consideration only if a steady-state is reached between the main phase and the DSP particles.
Figure 6.Plot of the major phase mean grain size depending on the DSP mean grain size and fraction for : natural mantle rocks (ultramylonites) from [25] (dashed lines), forsterite plus enstatite mixture from [43] (solid lines) and for the simulation of the present study (dots from section3.3).
As for the pure olivine case in presence of SSP (see previ-ous section), the DSP fraction has an effect on grain growth kinetics : increasing the DSP fraction decreases the average growth rate. The simulated and experimental microstructure morphology after two hours of annealing for the 9% enstatite sample are presented in figure7.
Figure 7.Simulated (left) and experimental (right) from [42] microstructure, at the same scale, with 24% of dynamic second phase (DSP) fraction after 2h annealing at 1633K. The blue and red colours correspond to enstatite and forsterite respectivelly.
While the predicted grain sizes are consistent with the experimental ones, the simulated microstructure morphology, and particularly the DSP grain shape, shows some differences : in the experiments, DSP grains are either polygonal, concave or convex while in the simulation they are mostly concave and sometimes polygonal depending on the local configuration
(see figure7). These results show that our scheme reproduces experimental results even if the mobility of interphase bound-aries is not precisely constrained. Indeed, the main factor that impedes grain growth here is the pinning of grain boundaries by triple junctions which have an interphase boundary.
3.4 Peridotite-like grain growth
In this section, we seek to model the grain growth within a system which may represent a natural peridotite at least in terms of phase composition. We used phase proportions com-parable to those of a Lherzolite [34] which could be encoun-tered, for instance, within a peridotite xenolith. The major phase, representing olivine, accounts for 78% volume frac-tion, the DSP, which may be ortho/clino-pyroxene is taken as 19% volume fraction and the SSP, which could be aluminium phases or pores represent 3% of the volume. The initial grain size distributions for the three phases are identical.
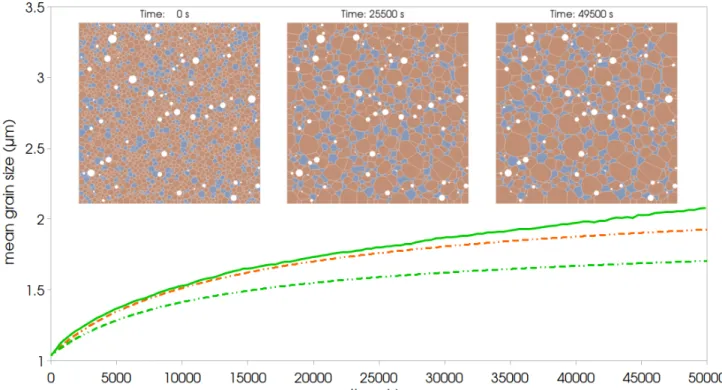
The predicted mean grain size evolution and the microstruc-ture morphology at different stages of the annealing are plot-ted in figure8. The grain growth rate is slower than the ones predicted in pure olivine + SSP or DSP aggregates (figure3
and4). The DSP grain shapes are, as for the full field simula-tions presented in section3.3, mostly concave or polygonal depending on the local morphology of the microstructure.
4. Discussion
4.1 Grain growth kinetics and microstructure mor-phologies
Our results show that grain growth kinetics in peridotites is strongly impacted by the presence of SSP and DSP. In fact, even few percent of SSP significantly reduces the growth rate and imposes a limiting mean grain size (figure3). The decrease of the SSP size for a same SSP volume fraction decreases both the growth kinetics and the limiting mean grain size (figure4). This may be explained by the reduction of the mean interparticle distance and thus the increase of the number of contact points between grain boundaries and SSP. For the same reasons, the increase of the SSP volume fraction for a same SSP size results in a decrease of the growth rate and the limiting mean grain size. In the same way, increasing the DSP volume fraction decreases the growth rate (figure4). This may be explained by the impeding of the grain boundaries by the slower interphase boundaries whose density increases with increasing DSP volume fraction, at least for the fractions considered in this work. The results of experimental annealing of forsterite and enstatite microstructure are well reproduced by our full field formalism in terms of total mean grain size evolution (figure4) and mean grain size evolution for each phase (figure5). In experimental mixtures and natural mantle rocks, the Zener relationship which fixes the ratio between the major phase and the DSP mean grain size seems to be achieved [25,43] (see figure6).
The simulated mean grain size evolutions do not show a perfect linear trend and particularly for the smaller DSP frac-tions (figure6). In fact, the achievement of Zener relationship
Figure 8.Simulation of a peridotite-like annealing at 1633K. The full field predicted mean grain size evolution is represented by the solid line while the dotted lines show the non-corrected (green) and corrected (orange) mean field predictions (see section4.2.3). The full field simulated microstructure is represented a the top of the figure at different stages, and the calculation domain size is 10x10µm.
assumes in addition to the classical Smith-Zener assumptions (see section4.2.1) that the microstructure is at equilibrium (i.e. has reached the maximum mean grain size as long as the DSP grains do not grow). However, this equilibrium is not necessarily reached at the first evolution stages and espe-cially for small DSP fractions for which grain growth without pinning can still occur. Nevertheless, for larger grain sizes the numerical results are within the range of ratios defined by experimental and natural rock samples.
The morphology of the simulated microstructures does not change from a monophase system by considering only SSP : grains are polygonal in shape (figure4). By introducing DSP, the microstructure shows significant difference in terms of grain shapes, and in particular some DSP grains do not have straight interphase boundaries. In experimental data, these boundaries can be straight or curved either inward or outward of the DSP grains. However, the full-field simulation repro-duces only straight or inward curved interphase boundaries (figure7and8). This may be due to two numerical aspects: i. the number of dimensions used to simulate the grain growth; indeed the capillarity force should take into account the 3 di-mensional nature of the interface curvature, which is naturally done in experimental conditions but not in the considered 2D full field model and ii. our treatment for conserving volume phase fractions which act to phase interfaces and which is,
topologically, a rough approximation of the slight diffusion mechanism due to Gibbs-Thomson effect.
4.2 Mean-field model
A mean field model describing the mean grain size evo-lution taking into account the presence of SSP, DSP or both can be proposed by describing, statistically, the driving and dragging pressure exerted on the grain boundaries of the mi-crostructure. In fact, considering that the velocity of a grain boundary is equivalent to the evolution of the mean grain size
¯
R, eq.(1) can be rewritten as :
d ¯R
dt = M(P −
∑
Pdrag). (7) In order to be consistent with the present full field sim-ulations, the driving pressure will be taken as the capillarity pressure and will be approximated by γp ¯Rp−1 [35] where γ is
the interfacial energy of the major phase and p the growth exponent generally taken to be 2 [21].
4.2.1 Smith-Zener pinning drag pressure
Using the same strategy than in the classical Smith-Zener framework [40], we make the hypotheses that each SSP exerts the maximal possible force on the grain boundaries. The
dragging force from eq.(5) becomes FdragSSP= π ¯RSSPγ (for
incoherent SSP) with ¯RSSP the mean SSP radius. By also
considering that the number of SSP at the interfaces (nGB)
corresponds to a random distribution of volume fraction fSSP
over the domain, this number can be expressed as nGB=
nv2 ¯RSSPwith nv=4π ¯3 fRSSP3 SSP
the number density of spherical SSP of mean radius ¯RSSP. Those two equations give the pressure
exerted by the SSP on the grain boundaries as :
PdragSSP= FdragSSP· nGB=
3γ fSSP
2 ¯RSSP
. (8)
This expression can be modified in order to take into ac-count the possible deviations from the assumptions mentioned above, for instance, due to the variations of SSP radii around the mean radius or to the non-perfectly random distribution of the SSP. Then eq.(8) is rewritten as :
PdragSSP=
3γ fmSSP
SSP
2KSSPR¯SSP
, (9)
where KSSPand mSSPare mean-field parameters which have to
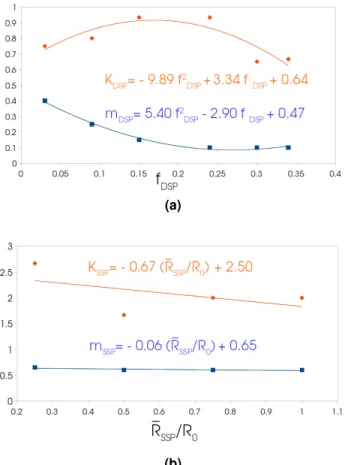
be calibrated on experimental or full field simulation results. In all cases, relation (9) shows that for a given SSP radius or a given SSP volume fraction, a large volume fraction or respectively a small SSP radius, where the corresponding mean interparticles distance is small (figure3) will result in a large pressure on the moving grain boundaries. By using this expression in eq.(7), the mean grain size evolution can be computed knowing the initial mean grain size. The mean field parameters are used to fit the different full field simulation results presented in section3.2(figure2) and are then plotted against the ratio R¯SSP
R0 as illustrated in figure9a.
This mean field model predicts the grain growth kinetics taking into account the presence SSP without the use of full field models except for the initial calibration. However, as the mean field parameters may depend also on other system characteristics (i.e. grain size distribution, shape of the SSP) this calibration should be used with care and considered valid only for the exact conditions used to calibrate it.
4.2.2 Interphase boundary pinning drag pressure
In experimental or simulated annealed biphase microstruc-tures, grains of the minor phase are generally separated from each other, occupying the multiple junctions of the other phase (figure4). Thus the number of multiple junction involving interphase boundaries increases which act as blocking barriers to the grain boundary migration, and so impede grain growth. At the contact zone between grain boundary and interphase boundary, the formed triple junction exerts a force resisting growth comparable to the pinning force. This force can be expressed by considering a single spherical grain of the DSP surrounded by grains of the major phase with triangular ridge at the triple junction (geometrical model already exposed
(a)
(b)
Figure 9.Best fit mean field parameters K (orange) and m (blue) for static second phase (SSP) (9a) : plotted as a function ofR¯SSP
R0 where R0is the initial mean grain size and
for dynamic second phase (DSP) (9b) : plotted as a function of fDSP.
by [4]) :
FdragDSP= (2γIBcos(θ ) − γ)π ¯RDSP, (10)
where γIBis the interphase boundary interfacial energy, ¯RDSP
is the equivalent mean radius of the DSP grain and θ is the half-angle formed by the ridge (i.e. the half of the triple junc-tion angle located inside the DSP grain). This expression is consistent with the Smith-Zener pinning force equation (5), and also translates the inhibition of grain growth by the pres-ence of DSP.
By considering a 2D space, the number of ridges developed around a DSP grain surrounded by grains of other phases is the 2D coordinence of the grain. Thus, making the hypothesis that the DSP grains are non agglomerated (consistent if the DSP does not represent a large volume fraction) the number of ridge per unit surface can be expressed as :
nridge=
fDSPC¯DSP
where fDSPand ¯CDSPare respectively the volume fraction
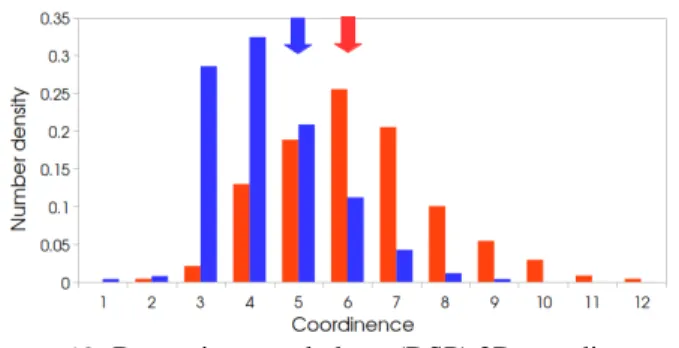
and the mean 2D coordinence of the DSP. The latter can be easily extracted from the full field simulations and plotted as shown in figure10.
Figure 10.Dynamic second phase (DSP) 2D coordinence distribution of, the 9% volume fraction DSP (without static second phase, SSP) simulated microstructure after 10000s annealing at 1633K (red), and the peridotite-like (the SSP grains are not taken into account for the coordinence) simulated microstructure after 45000s annealing at 1633K (blue). The arrows indicate the mean coordinence,
¯
CDSP= 6.2 for simulation without SSP and ¯CDSP= 5.3 for
the simulation with SSP.
The driving pressure exerted by the ridge onto the grain boundaries of the principal phase can then be estimated as :
PdragDSP= FdragDSP· nridge=
(2γIBcos(θ ) − γ) fDSPC¯DSP
¯ RDSP
. (12) As for the dragging pressure of the SSP, the expression of the dragging pressure for the DSP is generalized according to :
PdragDSP=
(2γIBcos(θ ) − γ) fDSPmDSPC¯DSP
KDSPR¯DSP
, (13) where KDSPand mDSPare the mean field parameters, which
able to predict a consistent dragging pressure for cases quite distant from the above mentioned hypotheses (i.e. when the DSP fraction is large the number of ridges is not equivalent to the 2D DSP coordinence). Equation (13) requires computing the DSP grain size evolution in a mean field way, which can be simulated using a generalized Burke and Turnbull law [8,10] :
¯
R2DSP− R2
DSP0= αMDSPγDSPtn, (14)
where RDSP0 is the initial DSP mean grain size, MDSP and
γDSPare the mobility and interfacial energy between two DSP
grains respectively, and α and n are the Burke and Turnbull parameters which, by fitting the DSP grain size evolution, are
0.6 and 0.284 respectively. By using the expression of the dragging pressure in eq.(7) and eq.(14) to compute the DSP mean grain size, the grain growth kinetics within a biphase material can be predicted. The mean field parameters are used to fit the different full field simulation results presented in section3.3(figure4) and are then plotted as a function of
fDSPas shown in figure9b.
As with the SSP dragging pressure mean field model pre-sented in the precedent section, this model should be used with caution, being aware that its validity is limited to the conditions used to calibrate it.
4.2.3 Total mean grain size evolution law
By using the expressions of the dragging pressures devel-oped above with eq.(7), we can estimate the mean grain size evolution of a microstructure as a function of DSP and SSP fraction as : d ¯R dt = M( γ 2 ¯R− 3γ fmSSP SSP 2KSSPR¯SSP −(2γIBcos(θ ) − γ) f mDSP DSP C¯DSP KDSPR¯DSP ). (15) By replacing the material parameters with that of forsterite and enstatite, the mean field parameters by their calibrations and the others known values this expression becomes :
d ¯R dt(mm.s −1) = 4 · 10−4e−1.85·105 RT ( 1 2 ¯R − 3 f −0.06RSSP¯R0 +0.65 SSP (−0.67R¯SSP R0 + 2.5)2 ¯RSSP (16) − 0.23 f 5.40 f2 DSP−2.90 fDSP+0.47 DSP (−9.89 f2 DSP+ 3.34 fDSP+ 0.64) ¯RDSP ).
Using this equation and the DSP grain size evolution law (eq.(14)), the mean grain size evolution of a peridotite-like sample (see section 3.4) during an annealing treatment is underestimated but essentially reproduced (figure8) without needing to calibrate other parameters. This underestimation can be explained and corrected by considering that a certain number of SSP grains are in contact with DSP grains which decreases the number of ridges and SSP grains effectively pinning the grain boundaries. The DSP mean coordinence
¯
CDSPwithout counting the SSP grains is then lower (figure10),
5.3 instead of 6.2, and a corrective coefficient of5.36.2 can be applied to the second term of equation (15) or (17) to account for this configuration. Taking into account these corrections, the predicted mean grain size evolution of a peridotite-like is more consistent with the full field simulation (figure8). In a geodynamical perspective, the remaining underestimation of grain growth kinetics should not be highly problematic despite the timescale involved, because temperatures may be lower (d ¯dtR∝ e−
Q
experiments. For instance, with the activation energy used in this study, the timescale of the peridotite-like annealing (figure
8) will be 100 years at 900K instead of 50000s at 1633K. Furthermore, for this type of extrapolation, the activation energy has a first order importance, although estimates from the literature appear to be very different (ranging from 160 to 600kJ/mol, after [11]). When using an activation energy of 300kJ/mol, the timescale of the peridotite-like annealing (figure8) will be 100000 years at 900K, compared to 50000s at 1633K.
The conditions used for these mean field modelings are close to the ones which served to their calibrations (e.g. grain size distribution, SSP size, DSP volume fraction, temperature) but have necessitated an interpolation of the mean field parame-ters. The mean field prediction gives consistent mean grain size evolution even interpolated within the range of calibra-tion. However, far from these conditions, or extrapolated, the mean field model will need to be tested carefully and probably recalibrated. Moreover, particular caution should be taken on the temperature dependance of our models while the activation energy gets a first order influence (see the above paragraph) and because no multi temperature simulations has been performed with experimental comparison.
4.3 Adequation of mean field models with short and long term annealing experiments
In two recent papers, [29,28] (NH2018) published the results of long term (500h) experiments for grain growth and deformation in an enstatite-forsterite synthetic aggregate for a DSP proportion of 20%, at different temperatures. Unfortu-nately, only the results after 500h of annealing are available, but these results allow us to evaluate the performance of our mean field model at large time scales. In comparison, the experiment presented in [19] (H2010) paper that was used to calibrate our model was conducted for a single temperature of 1360◦C(1633K), but with different proportions of DSP and tracked the grain size evolution through time. The de-scription of grain boundary diffusion-controlled grain growth in NH2018 is based on the formulation proposed by Ardell (1972) for the rate of growth of the DSP (e.g., enstatite), such as:
dt_En4 − d4 0_En=
8γcδ DGB_growthVm_growth2 ν
3GRT t, (17) where d0_En=0.3 µm and dt_Enare the initial and final
en-statite sizes respectively, γ is the surface energy (0.85J.m−2), δ is the grain boundary width (1nm), DGB_growthis the grain
boundary diffusivity for grain growth, Vm_growthis the molar
volume for grain growth (3.61 · 10−5m3.mol−1), ν depends on the proportion of DSP (ν = 0.47 for fDSP= 24%), G is a
geometric factor (0.34) and R is the gas constant.
We first use the results of NH2018 to estimate the grain boundary diffusivity at 1360◦Cand find DGB_growth≈ 1.76 ·
10−13m2.s−1. Similarly, we estimate the mean sizes of en-statite and forsterite grains at 1360◦Cafter 500h based on
(a)
(b)
Figure 11.Mean grain size evolution for 24% DSP annealing at 1633K, (11a) : comparison of mean field models after [29] (NH2018), [4] (BR2012) and this study with experiments of [19] and [29], (11b) : comparison between experiments and mean field model developed in this study taking into account in addition to the 24% DSP, 0.1% of SSP with different SSP size.
NH2018’s results at 1.4 and 2.4 µm, respectively. The ratio of forsterite versus enstatite radii is 1.65 according to NH2018. If we draw the growth of enstatite and forsterite grains with time according to the theoretical curve described in equation17, we find that it explains the grain size of both phases after 500h, but fails to capture the grain size evolution during the first 50h of the experiment, during which grains grow much faster than predicted (figure11a). Conversely, our mean field model (equation17) performs slightly better during the first 10h (al-though the predicted grain size is a little too large) but fails to explain the latest stages of the experiment in the absence of SPP. Indeed, after 50-100h grain growth seems to slow down of even stop completely, whereas both mean-field models pre-dict continuous grain growth. This slowing down cannot be explained unless we consider the possible presence of a small fraction of SSP in NH2018 experiments, which could be tiny
pores or impurities. If we try to adjust our mean field model taking into account SPP, we find that a very small fraction of SPP (0.1%) of extremely small size (≈ 60nm) better ex-plains the long- and short-term experimental results (figure
11b). This issue has already been raised by [4] where these authors suggest the presence of small (< 1%) proportion of SPP in H2010’s experiments, based on an analytical solution of two-phase grain growth with SPP. Based on these results, we suggest that short-term (< 50h) annealing experiments can help calibrating full-field or mean-field models such as those presented in this study because they have a lower sensitivity to the presence of small SPP than long-term ones. Conversely, our mean-field and/or full-field models could be used to better constrain the initial conditions of long-term experiments and in particular infer the presence of undetectable SPP.
5. Conclusion
The grain growth of a multiphase material is largely im-pacted by the presence of secondary phases. In this study, we focused on grain growth kinetics of mantle peridotites at litho-spheric depth conditions. Generally, increasing fraction of secondary phases reduces the growth rate. Two aspects of mul-tiphase material evolution were modelled here: the occurrence of static secondary phases that block or pin a surface (for in-stance spinel or other rare phases which compositions are very different from olivine and even more static than spinel) and the occurrence of evolving secondary phases (pyroxenes ver-sus olivine in peridotites). The interphase boundary migration occurring by Ostwald ripening is taken into consideration in our model by accounting for capillarity force and approximat-ing the effect of residual diffusion fluxes by a homogenized numerical treatment. This assumption could be avoided in a future work by the implementation of small-scale diffu-sion fluxes in the numerical model. Anyway, the full field LS framework presented here precisely reproduced different grain growth experiments within multiphase peridotite ana-logues and may allow accessing to geologically relevant time and space scales and especially for natural microstructures for which the grain sizes involve timescales out of reach for laboratory experiments. Based on the full field model, we then propose a mean field model with the aim to calculate the grain size evolution upon the presence of different type of secondary phases using minimal computational resources. We explain how the mean field model proposed here can be recalibrated on experimental or full field data as long as the initial conditions are fixed (e.g. SSP or DSP fraction and size, grain size distribution). Such mean field models might be of peculiar importance within large-scale geodynamic models where grain size sensitive creep has to be considered.
Appendices
1. Volume conservation enforcement
The artificial volume conservation through the use of an-other LS functions transport step is not only needed in order to respect the hypothesis, made in section2.2, that the phase fractions remain constant. In fact, the computational domain can also be considered as an open domain where chemical compounds, such as silica, may enter and exit through diffu-sion, which may cause variations in the volume fraction of the different phases. However, in order to estimate the effect of the proportion of DSP on grain growth kinetics, we have to keep this proportion constant throughout the simulation. Using periodic boundary conditions or enlarging the computa-tional domain could have been other solutions to treat or limit this border domain aspect but the first is not implemented (due to remeshing operations) and the second would have been too computer time consuming.
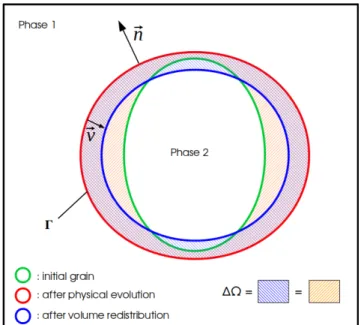
Therefore, at each timestep the signed DSP volume varia-tion ∆Ω is tracked and uniformly redistributed by applying the following velocity to the interphase boundaries of the microstructure as schematized in figure12:
~v = −∆Ω
Γ∆t~n (18)
where Γ is the interphase boundary surface where the velocity is applied and ∆t is the timestep.
Figure 12.Representation of the volume conservation enforcement, the green grain is the initial dynamic second phase grain, the red grain is the one obtained after the physical LS function transport step and the blue one is obtained after the volume redistribution transport step.
By using this methodology, already tested within a LS context [32], the volume change over the all simulation does not exceed 0.01% while without this redistribution step the
DSP fraction generally increases up to full the calculation domain after a long simulation time. As shown in figure12
this phase redistribution step does not change the shape of the DSP grain since the homogeneous velocity field is applied along and through the normal of the interface. It is important to notice that this method is not mass conserving in the tradi-tional sense (e.g. no species conservation equation). Moreover the DSP volume is not locally redistributed though realistic local composition gradient because all of the loss or win vol-ume is homogeneously redispatched on each DSP grain of the microstructure. A perspective of this treatment consists to consider a more realistic redistribution by considering, at each time step, the velocity of Eq.18as locally dependant of the size of the considering second phase grain comparatively to the second phase mean grain size. The idea being to reproduce more closely Ostwald Ripening effects.
6. Aknowledgments
We greatly acknowledge the two reviewers whose con-structive comments have moved us forward in our understand-ing.
We wanted to thank Sylvie Demouchy and Andrea Tommasi for the constructive discussions that have advanced this work. This work was supported by CNRS INSU 2018-programme TelluS-SYSTER.
The supports of the French Agence Nationale de la Recherche (ANR), ArcelorMittal, FRAMATOME, AS-COMETAL, AUBERT&DUVAL, CEA, SAFRAN through the DIGIMU Industrial Chair and consortium are gratefully acknowledged.
Data supporting figures 2 to 8 are available at https://osf.io/guqyv/
References
[1] Andrea Agnoli, Marc Bernacki, Roland Logé,
Jean-Michel Franchet, Johanne Laigo, and Nathalie Bozzolo. Selective growth of low stored energy grains during δ sub-solvus annealing in the inconel 718 nickel-based su-peralloy. Metallurgical and Materials Transactions A, 46(9):4405–4421, 2015.
[2] Andrea Agnoli, Marc Bernacki, Roland E Logé,
Jean-Michel Franchet, Johanne Laigo, and Nathalie Bozzolo. Understanding and modeling of gain boundary pinning in inconel718. In Superalloys 2012: The 12th International Symposium on Superalloys, pages p–73, 2012.
[3] Andrea Agnoli, Nathalie Bozzolo, Roland Logé,
Jean-Michel Franchet, Johanne Laigo, and Marc Bernacki. Development of a level set methodology to simulate grain growth in the presence of real secondary phase particles and stored energy–application to a nickel-base superalloy. Computational Materials Science, 89:233–241, 2014.
[4] David Bercovici and Yanick Ricard. Mechanisms for the
generation of plate tectonics by two-phase grain-damage and pinning. Physics of the Earth and Planetary Interiors, 202:27–55, 2012.
[5] David Bercovici and Yanick Ricard. Plate tectonics,
dam-age and inheritance. Nature, 508(7497):513, 2014.
[6] Marc Bernacki, Héba Resk, Thierry Coupez, and
Roland E Logé. Finite element model of primary re-crystallization in polycrystalline aggregates using a level set framework. Modelling and Simulation in Materials Science and Engineering, 17(6):064006, 2009.
[7] AM Boullier and Y Gueguen. Sp-mylonites: origin of
some mylonites by superplastic flow. Contributions to Mineralogy and Petrology, 50(2):93–104, 1975.
[8] JE Burke and D Turnbull. Recrystallization and grain
growth. Progress in metal physics, 3:220–292, 1952.
[9] RF Cooper and DL Kohlstedt. Rheology and structure
of olivine-basalt partial melts. Journal of Geophysical Research: Solid Earth, 91(B9):9315–9323, 1986.
[10] Ana Laura Cruz-Fabiano, R Logé, and Marc Bernacki.
Assessment of simplified 2d grain growth models from numerical experiments based on a level set framework. Computational Materials Science, 92:305–312, 2014.
[11] B Evans, J Renner, and G Hirth. A few remarks on the
kinetics of static grain growth in rocks. International Journal of Earth Sciences, 90(1):88–103, 2001.
[12] Julien Fausty, Nathalie Bozzolo, Daniel Pino Muñoz,
and Marc Bernacki. A novel level-set finite element formulation for grain growth with heterogeneous grain boundary energies. Materials & Design, 160:578–590, 2018.
[13] Jean Furstoss, Marc Bernacki, Clément Ganino, Carole
Petit, and Daniel Pino-Muñoz. 2d and 3d simulation of grain growth in olivine aggregates using a full field model based on the level set method. Physics of the Earth and Planetary Interiors, 283:98–109, 2018.
[14] Lars N Hansen, Yong-Hong Zhao, Mark E Zimmerman,
and David L Kohlstedt. Protracted fabric evolution in olivine: Implications for the relationship among strain, crystallographic fabric, and seismic anisotropy. Earth and Planetary Science Letters, 387:157–168, 2014.
[15] Conyers Herring and WE Kingston. The physics of
pow-der metallurgy. WE Kingston, Edition: McGraw Hill, New York, 1951.
[16] Marco Herwegh, Jolien Linckens, Andreas Ebert, Alfons
Berger, and SH Brodhag. The role of second phases for controlling microstructural evolution in polyminer-alic rocks: A review. Journal of Structural Geology, 33(12):1728–1750, 2011.
[17] Mats Hillert. Inhibition of grain growth by second-phase
[18] Takehiko Hiraga, Tomonori Miyazaki, Miki Tasaka, and
Hidehiro Yoshida. Mantle superplasticity and its self-made demise. Nature, 468(7327):1091, 2010.
[19] Takehiko Hiraga, Chihiro Tachibana, Naoki Ohashi,
and Satoru Sano. Grain growth systematics for forsterite±enstatite aggregates: Effect of lithology on grain size in the upper mantle. Earth and Planetary Science Letters, 291(1-4):10–20, 2010.
[20] Karim Hitti and Marc Bernacki. Optimized dropping
and rolling (odr) method for packing of poly-disperse spheres. Applied Mathematical Modelling, 37(8):5715– 5722, 2013.
[21] Masanori Kameyama, David A Yuen, and Hiromi
Fuji-moto. The interaction of viscous heating with grain-size dependent rheology in the formation of localized slip zones. Geophysical Research Letters, 24(20):2523–2526, 1997.
[22] SI Karato. Grain growth kinetics in olivine aggregates.
Tectonophysics, 168(4):255–273, 1989.
[23] I.M. Lifshitz and V.V. Slyozov. The kinetics of
precip-itation from supersaturated solid solutions. Journal of Physics and Chemistry of Solids, 19(1):35 – 50, 1961.
[24] Jolien Linckens, Rolf HC Bruijn, and Philip Skemer.
Dy-namic recrystallization and phase mixing in experimen-tally deformed peridotite. Earth and Planetary Science Letters, 388:134–142, 2014.
[25] Jolien Linckens, Marco Herwegh, Othmar Müntener, and
Ivan Mercolli. Evolution of a polymineralic mantle shear zone and the role of second phases in the localization of deformation. Journal of Geophysical Research: Solid Earth, 116(B6), 2011.
[26] Ludovic Maire, Benjamin Scholtes, Charbel Moussa,
Nathalie Bozzolo, D Pino Muñoz, and Marc Bernacki. Im-provement of 3d mean field models for capillarity-driven grain growth based on full field simulations. Journal of materials science, 51(24):10970–10981, 2016.
[27] Nele Moelans, Bart Blanpain, and Patrick Wollants.
Phase field simulations of grain growth in two-dimensional systems containing finely dispersed second-phase particles. Acta Materialia, 54(4):1175–1184, 2006.
[28] T Nakakoji and T Hiraga. Diffusion creep and grain
growth in forsterite+ 20 vol% enstatite aggregates: 2. their common diffusional mechanism and its consequence for weak-temperature-dependent viscosity. Journal of Geophysical Research: Solid Earth, 123(11):9513–9527, 2018.
[29] T Nakakoji, T Hiraga, H Nagao, S Ito, and M Kano.
Diffusion creep and grain growth in forsterite+ 20 vol% enstatite aggregates: 1. high-resolution experiments and their data analyses. Journal of Geophysical Research: Solid Earth, 123(11):9486–9512, 2018.
[30] Steven J Nichols and Stephen J Mackwell. Grain growth
in porous olivine aggregates. Physics and Chemistry of Minerals, 18(4):269–278, 1991.
[31] Tomohiro Ohuchi and Michihiko Nakamura. Grain
growth in the forsterite–diopside system. Physics of the Earth and Planetary Interiors, 160(1):1–21, 2007.
[32] D Pino-Munoz, Julien Bruchon, Sylvain Drapier, and
François Valdivieso. Sintering at particle scale: an eule-rian computing framework to deal with strong topological and material discontinuities. Archives of Computational Methods in Engineering, 21(2):141–187, 2014.
[33] Qing Qian, Hugh St C O’Neill, and Jörg Hermann.
Com-parative diffusion coefficients of major and trace elements in olivine at 950° c from a xenocryst included in dioritic magma. Geology, 38(4):331–334, 2010.
[34] Michael F Roden, Anthony J Irving, and V Rama Murthy.
Isotopic and trace element composition of the upper man-tle beneath a young continental rift: results from kil-bourne hole, new mexico. Geochimica et Cosmochimica Acta, 52(2):461–473, 1988.
[35] Antoine Rozel, Yanick Ricard, and David Bercovici.
A thermodynamically self-consistent damage equation for grain size evolution during dynamic recrystalliza-tion. Geophysical Journal International, 184(2):719–728, 2011.
[36] Benjamin Scholtes, Romain Boulais-Sinou, Amico
Set-tefrati, Daniel Pino Muñoz, Isabelle Poitrault, Aurore Montouchet, Nathalie Bozzolo, and Marc Bernacki. 3d level set modeling of static recrystallization considering stored energy fields. Computational Materials Science, 122:57–71, 2016.
[37] Benjamin Scholtes, D Ilin, Amico Settefrati, Nathalie
Bozzolo, Andrea Agnoli, and Marc Bernacki. Full field modeling of the zener pinning phenomenon in a level set framework- discussion of classical limiting mean grain size equation. In Superalloys 2016, pages 497–503. John Wiley, 2016.
[38] Benjamin Scholtes, Modesar Shakoor, Amico Settefrati,
Pierre-Olivier Bouchard, Nathalie Bozzolo, and Marc Bernacki. New finite element developments for the full field modeling of microstructural evolutions using the level-set method. Computational Materials Science, 109:388–398, 2015.
[39] Philip Skemer and Shun-ichiro Karato. Effects of solute
segregation on the grain-growth kinetics of orthopyrox-ene with implications for the deformation of the upper mantle. Physics of the Earth and Planetary Interiors, 164(3-4):186–196, 2007.
[40] CS Smith. Grains, phases, and interphases: An
interpre-tation of microstructure: Transactions of the american institute of mining and metallurgical engineers, v. 175. 1948.
[41] Carl Spandler, H St C O’Neill, and Vadim S
Kamenet-sky. Survival times of anomalous melt inclusions from element diffusion in olivine and chromite. Nature, 447(7142):303, 2007.
[42] Miki Tasaka and Takehiko Hiraga. Influence of mineral
fraction on the rheological properties of forsterite+ en-statite during grain-size-sensitive creep: 1. grain size and grain growth laws. Journal of Geophysical Research: Solid Earth, 118(8):3970–3990, 2013.
[43] Miki Tasaka, Takehiko Hiraga, and Katsuyoshi
Michibayashi. Influence of mineral fraction on the rheo-logical properties of forsterite+ enstatite during grain size sensitive creep: 3. application of grain growth and flow laws on peridotite ultramylonite. Journal of Geophysical Research: Solid Earth, 119(2):840–857, 2014.
[44] David A Wark, Charles A Williams, E Bruce Watson, and
Jonathan D Price. Reassessment of pore shapes in mi-crostructurally equilibrated rocks, with implications for permeability of the upper mantle. Journal of Geophysical Research: Solid Earth, 108(B1), 2003.
![Table 1. Material parameters used for the full field simulations, from a [13], b present study, c [39], d [9]](https://thumb-eu.123doks.com/thumbv2/123doknet/12137618.310688/6.918.476.826.104.338/table-material-parameters-used-field-simulations-present-study.webp)
![Figure 6. Plot of the major phase mean grain size depending on the DSP mean grain size and fraction for : natural mantle rocks (ultramylonites) from [25] (dashed lines), forsterite plus enstatite mixture from [43] (solid lines) and for the simulation of th](https://thumb-eu.123doks.com/thumbv2/123doknet/12137618.310688/8.918.113.419.262.485/figure-depending-fraction-natural-ultramylonites-forsterite-enstatite-simulation.webp)
![Figure 11. Mean grain size evolution for 24% DSP annealing at 1633K, (11a) : comparison of mean field models after [29]](https://thumb-eu.123doks.com/thumbv2/123doknet/12137618.310688/12.918.472.840.105.620/figure-mean-grain-evolution-annealing-comparison-field-models.webp)