HAL Id: hal-01386170
https://hal.archives-ouvertes.fr/hal-01386170
Submitted on 23 Oct 2016
HAL is a multi-disciplinary open access
archive for the deposit and dissemination of
sci-entific research documents, whether they are
pub-lished or not. The documents may come from
teaching and research institutions in France or
abroad, or from public or private research centers.
L’archive ouverte pluridisciplinaire HAL, est
destinée au dépôt et à la diffusion de documents
scientifiques de niveau recherche, publiés ou non,
émanant des établissements d’enseignement et de
recherche français ou étrangers, des laboratoires
publics ou privés.
Perceived dynamic range of HDR images
Vedad Hulusic, Giuseppe Valenzise, Edoardo Provenzi, Debattista Kurt,
Frédéric Dufaux
To cite this version:
Vedad Hulusic, Giuseppe Valenzise, Edoardo Provenzi, Debattista Kurt, Frédéric Dufaux.
Per-ceived dynamic range of HDR images.
QoMEX 2016, Jun 2016, Lisboa, Portugal.
pp.1 - 6,
Perceived Dynamic Range of HDR Images
Vedad Hulusic
∗, Giuseppe Valenzise
∗, Edoardo Provenzi
†, Kurt Debattista
‡and Frederic Dufaux
∗∗LTCI, CNRS, T´el´ecom ParisTech, Universit´e Paris-Saclay, Paris, France
Email: [email protected]
†Sorbonne Paris Cit´e, Laboratoire MAP5 (UMR CNRS 8145), Universit´e Paris Descartes, Paris, France
‡WMG, University of Warwick, Coventry, UK
Abstract—Although high dynamic range (HDR) imaging has gained great popularity and acceptance in both the scientific and commercial domains, the relationship between perceptu-ally accurate, content-independent dynamic range and objective measures has not been fully explored. In this paper, a new methodology for perceived dynamic range evaluation of complex stimuli in HDR conditions is proposed. A subjective study with 20 participants was conducted and correlations between mean opinion scores (MOS) and three image features were analyzed. Strong Spearman correlations between MOS and objective DR measure and between MOS and image key were found. An exploratory analysis reveals that additional image characteristics should be considered when modeling perceptually-based dynamic range metrics. Finally, one of the outcomes of the study is the perceptually annotated HDR image dataset with MOS values, that can be used for HDR imaging algorithms and metric validation, content selection and analysis of aesthetic image attributes.
I. INTRODUCTION
High dynamic range (HDR) technology [1] enables the capture, store and display of a wide range of colors and luminous intensities of real-world scenes when compared to traditional low dynamic range (LDR) imaging. In recent years, HDR has gained more and more popularity in the multimedia community, where it is expected to provide a greatly improved Quality of Experience (QoE) for emerging multimedia ser-vices. A core feature of HDR, from the QoE point of view, is its capability to reproduce very bright and very dark portions of a scene concurrently. The span between these extrema in the brightness scale is commonly referred to as the dynamic
range of a picture.
Conventionally, dynamic range is computed as the ratio between the maximum and minimum pixel brightness of an image, which we refer to as pixel-based dynamic range in this paper. Nevertheless, this measure does not capture the complex behavior of the human perception of lightness and its intrin-sic content-dependency [2]. Assessing the perceived dynamic range of HDR content remains an unexplored phenomenon. This has a number of potential applications and fallouts in different fields: it can be used to optimize and evaluate inverse tone mapping operators [3], [4], [5], HDR compression methods and HDR reproduction systems [6]; it is an important attribute in the formation of aesthetic judgments [7]; it provides objective means to select source contents in HDR subjective studies [8]; and in general it would help to advance the understanding of lightness perception, by extending studies on the anchoring problem [2] to complex stimuli and HDR conditions.
To the authors’ knowledge, this work is the first attempt to assess the perception of dynamic range in HDR images
through a psychophysical experiment. To this end, we designed and carried out a subjective study, using a set of 36 HDR images with different characteristics and content semantics, including indoor/outdoor scenes, natural/man-made scenes and other variations. Dynamic range is generally measured based only on the brightness of a picture. However, well-known color appearance phenomena such as Hunt or Helmholtz-Kohlrausch effects [9] tend to question this assumption and rather lean towards the hypothesis that dynamic range perception changes from grayscale to color. In this work we decided to focus on the perception of dynamic range for luminance images only, and to leave the study of the color case as future work.
This paper has three main contributions. First, we construct a subjectively annotated dataset with perceived dynamic range, using complex stimuli and HDR viewing conditions (using a HDR display). This database is available upon request to the authors. Second, given the lack of standardized approaches to measure this kind of perceptual attribute, we propose a novel test methodology for gauging perceived dynamic range, which is somewhat inspired by the subjective assessment methodology for video quality (SAMVIQ) [10]. Third, based on the results of the study, we analyze the correlations between mean opinion scores (MOS) and three image features, i.e., pixel-based dynamic range, image key and spatial information. The rest of the paper is organized as follows. In section II related work is discussed, followed by the details about the experimental design (Section III). The obtained subjective scores are analysed and compared with the objective metrics in Section IV. Finally, the results are further discussed (Section V) and several conclusions are drawn in Section VI.
II. RELATED WORK
The perception of dynamic range is closely related to that of image lightness, which has been widely studied in perceptual psychology. Lightness is defined as the relative brightness of objects in a scene. According to anchoring models [2], the perception of lightness is determined by the brightest patch of the scene. The human visual system then scales the rest to this maximum, generating an internal, scene-dependent scale of light and dark. As a consequence, the perception of dynamic range depends on the ratio between the lightest and darkest part of the picture. Li and Gilchrist [11] observed that anchoring is affected by the relative area of the brightest patch. The Retinex theory [12] arrives indirectly to the same conclusion through a probabilistic formulation, by averaging luminance values along paths of pixels originating from each point of the picture [13]. This also takes into account the relative distance between patches of different brightness.
Unfortunately, most of these psycho-perceptual theories lack of a sufficient validation with complex stimuli, and have never been tested in HDR conditions.
The perception of dynamic range has been sometimes entangled with that of image contrast. While both have an aesthetic meaning, they correspond to very different phenom-ena [7]. Global contrast measures [14], [15] model image sharpness, which is a fine-scale image feature, as the perceptual experiments in [16] clearly display. On the other hand, the perceived dynamic range is similar to the “tone” aesthetic attribute defined in [7]. However, in that work the tone is basically computed as a variation of the pixel-based dynamic range and does not take into account other perceptual factors. Our subjective experiment aims at measuring the tone attribute with HDR viewing conditions.
Perceived dynamic range and overall image quality are highly related, i.e., between two versions of the same image observers generally prefer the higher dynamic range one [17]. Assessing the perceived dynamic range of HDR pictures and video then plays a key role in the design and evaluation of inverse tone mapping (expansion) operators [3], which aim at displaying LDR content on a HDR display. So far, the approaches to enhance the perception of dynamic range have been mainly heuristic. Meylan et al. [18] showed that, in expanding the dynamic range of LDR content, specular highlights have to be allocated a significant range; similarly, Rempel et al. [4] and Banterle et al. [3] proposed to boost the brightest parts of LDR pixels in order to “approximate the visceral response associated with the higher contrast and overall brightness in the original scene” [4]. The subjective experiment conducted in this paper provides a groundtruth for designing more perceptually meaningful dynamic range metrics.
Assessing dynamic range is useful in HDR source content selection in subjective studies and to test HDR processing algorithms, as pointed out by Narwaria et al. [8]. However, in that work the proposed objective measure is tailored to a dynamic range reduction task, such as in the case of tone mapping evaluation. Moreover, no formal subjective evaluation is proposed to verify the perceptual relevance of that method.
III. SUBJECTIVE EVALUATION
The aim of our study is to investigate how the dynamic range of grayscale images is perceived on an HDR screen. In this section the design, participants, apparatus, stimuli and the experimental procedure will be described.
A. Design
In the study, the perceptual responses of participants were evaluated in a pseudo randomized design. The image content was the independent variable. The dependent variable was the rating of the perceived dynamic range of the image. In order to avoid confusion between contrast and dynamic range, and possibly other similar properties, this attribute was described to the participants as the overall impression of the difference between the brightest and the darkest part(s) in the image.
When designing the experiment, three possible methods of evaluation were considered: paired comparison, ranking and
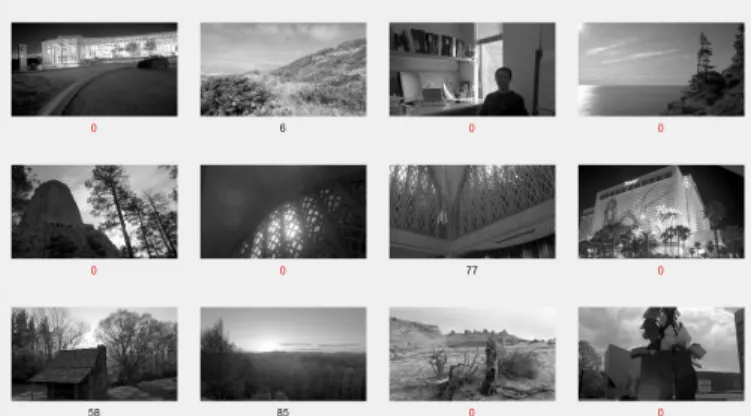
Fig. 1: The appearance of the test framework with a subset of 12 image thumbnails.
rating. Paired comparison is impractical for large data sets, and was thus ruled out. The efficient pair comparison techniques [19] can be used under certain assumption, which were in our case violated due to multidimensionality and non-deterministic DR appearance, as observed in the pilot study. The ranking method is straightforward, and quick to conduct, but since the ordinal scale is used, there is no information on the magnitude of the differences. Rating was therefore selected as it permits a direct comparison of the differences between subjective scores. However, our proposed method allows for multiple viewings and comparisons of the test stimuli, see Figure 1. This follows the Subjective Assessment Methodology for Video Quality (SAMVIQ) [10] but redesigned for images.
The dataset contained 36 images, with a significant vari-ance in image statistics, as described in section III-D. Each session consisted of three parts, and each part contained a subset of 12 pseudo-randomly selected images in a fully randomized order. Each subset was displayed on a 3 by 4 grid, with the corresponding user score below each image thumbnail. The scores were initially set to zero and displayed in red until being changed by the user rating, as shown in Figure 1. The tone mapped thumbnails were used as an image/score reference, and the users were explicitly asked not to make judgments based on them, but rather on full screen image views. Tone mapped reproductions were employed since the images were too small (422 × 238 px) to be well perceived in HDR.
Viewers had unlimited time for each evaluation, and were permitted to re-evaluate each image as many times as needed. This allowed observers to rate while comparing across images. The rating was performed on a vertical continuous scale ranging from 0 to 100, divided into five equal intervals with corresponding semantic labels: very low, low, medium, high and very high, included for general guidance.
B. Participants
20 people, 15 male and 5 female, aged between 23 and 49, with an average age of 30, volunteered for the experiment. All of them reported normal or corrected-to-normal visual acuity. 11 participants wore correction glasses.
Image 0 10 20 30 40 Dynamic range (DR) 1 2 3 4 5 6 7 Image 0 10 20 30 40
Image key (IK)
0.2 0.3 0.4 0.5 0.6 0.7 0.8 Image 0 10 20 30 40
Spatial information (SI)
0.01 0.02 0.03 0.04 0.05 0.06
Fig. 2: Image statistics (left to right): pixel-based DR, IK and SI, all sorted by pixel-based DR.
C. Apparatus
The experiments were conducted in a dark, quiet room, with the ambient illumination of the room at 2.154 lux and the luminance of the screen when turned off at 0.03
cd/m2. The stimuli were presented on a calibrated HDR SIM2
HDR47ES4MB 47” display with 1920×1080 pixel resolution,
peak brightness of 4000 cd/m2, used in DVI+ mode [20].
The distance from the screen was fixed to three heights of the display, with the observers’ eyes positioned zero degrees horizontally and vertically from the center of the display [21]. D. Stimuli
33 of the images were taken from the Fairchild’s HDR Pho-tographic Survey [22]. The “Market” image was a frame from the HDR sequence proposed in MPEG by Technicolor [23] and the “Carousel” and “Bistro” images were frames from sequences in the Stuttgart HDR Video Database [24]. The last three images were selected to increase the difference in scene semantics, as most of the images in the Fairchild data set are photographs of nature. All landscape oriented images were downsized to the smaller high definition (HD) resolution and, if necessary, the rest cropped to a 1920 × 1080 px resolution. The portrait oriented images were downsized to the 1080 px width, and the top, middle and the bottom part of the images cropped to HD resolution. This was done in order to avoid padding around the images, which could influence the user ratings. Each RGB image was converted to grayscale (assuming BT.709 primaries to compute relative luminance [25]) before showing it to observers.
A scene selection was based on the image statistics and the pilot study, so that the dynamic range (DR), image key (IK), spatial perceptual information measure (SI) and image content vary and are evenly distributed across the data set, as described in Section IV-A and reported in Figure 2. The image selection for the subsets of 12 images of each session was constrained so that each subset contained two randomly selected images with very low dynamic range and two with very high dynamic range, based on the objective DR scores. This was done in order to preserve the consistency of scores among the subsets. E. Procedure
Prior to the experiment, the participants were asked to read the instructions and they were verbally explained the experi-mental procedure and how to rate the dynamic range. Inspired
by the study by Aydin et al. [7], the abstraction from Figure 3 was used to illustrate the attribute being evaluated. After being satisfied with the participants’ understanding of the nature and the purpose of the experiment, they were shown three sample images and told that these are the examples representing the very low, medium and very high value of the attribute to be evaluated. Participants were not told the exact corresponding values for the presented images. In the second part of the training session, they were asked to evaluate another three images themselves to confirm that they understood the task. This further helped to stabilize their opinion and adjust to the magnitude of the effect, and to further familiarize themselves with the experimental framework. During the training session they were asked to rate the overall impression of the difference between the brightest and the darkest part(s) in each image.
The participants could evaluate images in any order. Once the thumbnail was clicked on, a full screen image was dis-played. There were no time constraints for the image obser-vation before evaluating it. When the participant was ready to give a score, she/he had to click anywhere on the image to bring up the rating widget. Once displayed, it was positioned on the far right side of the screen. After the corresponding score was assigned, the thumbnail preview was re-displayed with the updated score for the rated image. Upon completion of the evaluation, the experimenter had a short structured discussion about the test with all the participants.
Your task is to evaluate the overall impression of the difference between the darkest and the brightest part(s) of the presented images.
Fig. 3: The abstraction of the attribute to be evaluated.
IV. RESULTS
The null hypotheses in the study were that there is no effect of pixel-based DR scores, spatial perceptual information (SI) or image key (IK) on the dynamic range perception. Our research
ElCapitan_b
OCanadaNoLights_b
BloomingGorse(1)
BigfootPass
TupperLake(1)
DelicateFlowers URChapel(2)_b GoldenGate(1) NorthBubble PaulBunyan HancockKitchenOutside PeckLake URChapel(2)_m BandonSunset(1) WillySentinel_b 507 SequoiaRemains_t WillySentinel_m JesseBrownsCabin
WillyDesk LabBooth Flamingo Zentrum
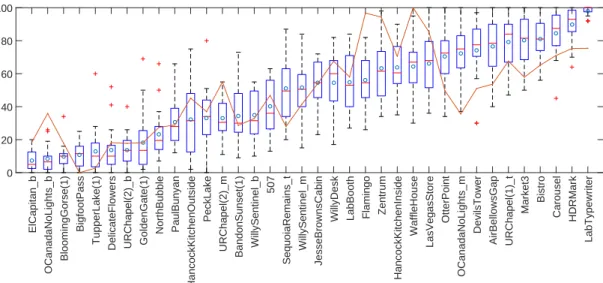
HancockKitchenInside WaffleHouse LasVegasStore OtterPoint OCanadaNoLights_m DevilsTower AirBellowsGap URChapel(1)_t Market3 Bistro Carousel HDRMark LabTypewriter 0 20 40 60 80 100
Fig. 4: An extended boxplot diagram. Blue circles = MOS; Red horizontal lines = median values; Blue boxes = the interquartile
ranges; Whiskers = adjacent values; Red crosses = outliers; Red line: pixel-based DR values (scaled as DR = max(DR)DR · 100).
hypotheses were that there is a direct relationship between perceived DR and DR computed as in equation (1), and that both the spatial image complexity (SI) and image key (IK) affect the perceived DR. In addition, some particular cases were further examined in order to better understand the nature and magnitude of these effects, if found.
Spearman’s correlation coefficient for ranked data (rs)
and Kendall’s coefficient of concordance (W ) where used to
analyze the data. Both Kendall’s W and Spearman’s rs have
ranges limited between 0 (no agreement between participants) and 1 (complete agreement between participants).
A. Objective Measures
Three measures were used for the image selection in the preparation of the study: DR, SI and IK, reported in Figure 2. These were kept as diverse as possible, except for the DR, where a few pairs of images with the same DR were grouped, so that further examination of the cause for the potentially disparate subjective scores can be performed.
1) Pixel-based dynamic range (DR): The DR was
calcu-lated using the first and the ninety-ninth percentile, in order to make the method robust against outliers, as:
DR = log10(Lmax/Lmin), (1)
where the Lmin and Lmax were the minimum and maximum
relative luminance values of the image respectively, computed after excluding 1% of darkest and brightest pixels.
2) Spatial perceptual information (SI): The SI indicates the
amount of spatial details of an image, where a higher value represents a more spatially complex image. It is calculated as the standard deviation over the output of the Sobel-filtered
pixel values of the tone mapped image [26]. The tone
mapping operator (TMO) used for the generation of the low-dynamic range (LDR) content was Reinhard’s photographic tone reproduction operator [27].
3) Image key (IK): The IK ∈ [0, 1], is a measure of the
average image brightness, defined as:
IK = log Lavg− log Lmin
log Lmax− log Lmin
, (2)
where the Lavg is computed as log Lavg =
Σijlog(L(i, j) + δ)/N , δ is a small value (typically
10−5) used to avoid the singularity occurring for the black
pixels, and N is the number of pixels in the L(i, j) image
[28]. Both Lmin and Lmax are calculated robustly, after
excluding the 1% of the darkest and the brightest pixels, as described in section IV-A1.
B. Perceived Dynamic Range
Kendall’s coefficient of concordance (W) showed high cor-relation in ranking across participants (W = .812, p < .001) for the perceived dynamic range. The boxplot in Figure 4 depicts the dispersion of the perceived DR scores, the extreme cases and the pixel-based DR. The outliers (red crosses on the plot) were neither removed nor adjusted in order not to corrupt the data and will be carefully investigated in future work. The image DR values are plotted on the same diagram (red line) for visual comparison of the scores.
C. Comparison
In order to compare between the perceived dynamic range and the objective measures, the consistency of the rating and the correlation with the image statistics were calculated. Figure 5 reports scatter plots for each of the objective measure. The one-tailed Spearman’s correlation test showed a sig-nificant correlation between the perceived and pixel-based DR
(rs = .788, p < .001). This indicates that the probability of
the first null hypothesis being true is extremely low, which goes in favor of the research hypothesis about the pixel-based DR.
Dynamic range (DR)
0 2 4 6 8
Mean opinion score (MOS) 0
20 40 60 80 100
Image key (IK)
0.2 0.4 0.6 0.8
Mean opinion score (MOS) 0
20 40 60 80 100
Spatial perceptual information (SI)
0.01 0.02 0.03 0.04 0.05 0.06
Mean opinion score (MOS) 0
20 40 60 80 100
Fig. 5: MOS across the three metrics: pixel-based DR(left), IK(middle) and SI(right).
The two-tailed Spearman’s correlation test between the MOS and the SI showed no evidence of correlation between the
two variables (rs= .037, p = .830). This is in accordance with
our qualitative analysis, where no users reported any effect of image complexity on the subjective scores.
The same test showed the significance in correlation
be-tween the MOS and the IK (rs = −.671, p < .001). The
correlation coefficient is negative, which means that the higher the IK, the lower the subjective score is assigned.
V. DISCUSSION
The results of the Kendall’s coefficient of concordance (W) test showed that image ranking pattern was consistent among participants, which means that the proposed methodology is suitable, and that the obtained MOS values are valid. Further-more, while the results of this study show that, in many cases, pixel-based dynamic range is a good predictor of the perceived dynamic range, there are clear counterexamples where this objective measure fails in predicting human scores. Figure 4 shows higher variance in subjective scores of certain images, which indicates that those images were more difficult to rate. Following the results from the Spearman’s correlation between the MOS and pixel-based DR, a closer observation was made at several particular cases, where the differences between these scores were the highest, see Table I. These images were first divided into two groups: those that were rated higher (MOS>DR) and those that were rated lower than the pixel-based DR (MOS<DR). One noticeable feature of all the scenes in the first group is that they all have a relatively large area of very high luminance, which perceptually dominates over the, not so dark, rest of the image. On the contrary, all the scenes in the second group have a visible but relatively small light source (sun or a light bulb/lamp), except for the “OCanadaNoLights b” image, that had a small portion of the sky in the top left corner, which perceptually could have had the same effect as light sources in the other images.
In addition, the four images with the highest pixel-based DR scores were rated significantly lower, while some of the images perceived as the ones with the lowest and highest DR had relatively higher and lower pixel-based DR scores respectively, as reported in Figure 4. Furthermore, there were some cases where a significant variation in subjective scores existed between some images with almost identical pixel-based DR, end even inverse correlation between the subjective (MOS) and pixel-based DR scores, as observed in Table II.
TABLE II: The examples with high variations in MOS.
Image name MOS DR NorthBubble 23.25 2.5761 SequoiaRemains t 51.10 2.6030 OCanadaNoLights b 8.35 2.9939 OCanadaNoLights m 72.35 2.9810 LabTypewriter 98.10 4.9485 WaffleHouse 64.40 6.1637
Based on the observations collected from test participants, we observe that these discrepancies between the MOS and pixel-based DR values are often related to the influence of geometric characteristics of the scene, such as the relative surface of the brightest area(s), as predicted by anchoring theories [2], or the distance between bright and dark areas, described by Retinex theory [12].
The inverse correlation between the subjective scores and the image key, i.e. higher perceived DR scores for darker images, might be predicted by Weber-Fechner law [9], but this hypothesis has too be further investigated.
VI. CONCLUSION ANDFUTUREWORK
While pixel-based dynamic range measure might be suit-able in some cases, there are situations where it is perceptually inaccurate. This can happen either due to pixel outliers with extreme values or image noise, but is also a result of the
TABLE I: Ten images with the highest difference between MOS and pixel-based DR values (DR = max(DR)DR · 100).
MOS 76.55 74.15 70.50 98.10 80.15 72.35 8.35 56.00 64.40 63.15 DR 62.84 60.71 59.69 80.28 66.21 48.36 48.57 97.40 100.00 95.41
complexity of the human visual system and related processes involved in the extraction of this attribute from complex stimuli. Therefore, a dataset with perceptually-based dynamic range scores is desirable.
In this paper a new subjectively annotated HDR image dataset was presented, which can be used in future HDR image-related algorithm or metric validation studies, aesthetic attribute analysis and HDR source content selection. This is, to the best of our knowledge, the first measure of perceived DR using complex stimuli and HDR conditions.
The subjective study was conducted using a newly de-signed methodology, inspired by the SAMVIQ methodology for subjective video assessment, which proved to be efficient and precise for subjective evaluations.
The results showed that there are particular features in the images with the highest variance in subjective scores, that are significantly relevant to dynamic range evaluation. These features, if harnessed correctly, could be used as a guidance in designing new, perceptually based, objective metrics.
In the future, we plan to further analyze the obtained results, and try to formalize the observed patterns in perceived dynamic range evaluation, by proposing an objective percep-tual DR metric. In addition, we are currently conducting a similar study using chromatic information of the images from the same dataset. The results from this study will be used to investigate the effect of this added dimension on the DR perception and used for proposing a metric for the analysis of aesthetic attributes. Finally, we are interested in extending this work to video content and investigating the temporal aspects.
ACKNOWLEDGMENT
The authors would like to thank all the volunteers that participated in the subjective study. The work presented in this document was supported by Region Ile de France, in the framework of the FUI 4EVER2 project. Debattista is partially supported by a Royal Society Industrial Fellowship.
REFERENCES
[1] F. Banterle, A. Artusi, K. Debattista, and A. Chalmers, Advanced high dynamic range imaging: theory and practice. CRC Press, 2011. [2] A. Gilchrist, C. Kossyfidis, F. Bonato, T. Agostini, J. Cataliotti, X. Li,
B. Spehar, V. Annan, and E. Economou, “An anchoring theory of lightness perception.” Psychological review, vol. 106, no. 4, p. 795, 1999.
[3] F. Banterle, P. Ledda, K. Debattista, and A. Chalmers, “Inverse tone mapping,” in Proc. of the 4th International Conference on Computer Graphics and Interactive Techniques in Australasia and Southeast Asia, ser. GRAPHITE ’06. New York, NY, USA: ACM, 2006, pp. 349–356. [Online]. Available: http://doi.acm.org/10.1145/1174429.1174489 [4] A. G. Rempel, M. Trentacoste, H. Seetzen, H. D. Young, W. Heidrich,
L. Whitehead, and G. Ward, “LDR2HDR: On-the-fly reverse tone mapping of legacy video and photographs,” in ACM SIGGRAPH 2007 Papers, ser. SIGGRAPH ’07. New York, NY, USA: ACM, 2007. [Online]. Available: http://doi.acm.org/10.1145/1275808.1276426 [5] F. De Simone, G. Valenzise, P. Lauga, F. Dufaux, and F. Banterle,
“Dynamic range expansion of video sequences: A subjective quality assessment study,” in IEEE Global Conference on Signal and Informa-tion Processing. IEEE, 2014, pp. 1063–1067.
[6] C. Mantel, J. Korhonen, S. Forchhammer, J. Pedersen, and S. Bech, “Subjective quality of videos displayed with local backlight dimming at different peak white and ambient light levels,” in 7th Int. Work. on Quality of Multimedia Experience. IEEE, 2015, pp. 1–6.
[7] T. O. Aydin, A. Smolic, and M. Gross, “Automated aesthetic analysis of photographic images,” Visualization and Computer Graphics, IEEE Transactions on, vol. 21, no. 1, pp. 31–42, 2015.
[8] M. Narwaria, C. Mantel, M. Perreira de Silva, and P. Le Callet, “An objective method for High Dynamic Range source content selection,” in 6th Int. Work. on Quality of Multimedia Experience, 2014, pp. 13–18. [9] M. D. Fairchild, Color appearance models. John Wiley & Sons, 2013. [10] J.-L. Blin, “SAMVIQ - Subjective assessment methodology for video
quality,” Rapport technique BPN, vol. 56, p. 24, 2003.
[11] X. Li and A. L. Gilchrist, “Relative area and relative luminance com-bine to anchor surface lightness values,” Perception & Psychophysics, vol. 61, no. 5, pp. 771–785, 1999.
[12] E. H. Land and J. J. McCann, “Lightness and retinex theory,” JOSA, vol. 61, no. 1, pp. 1–11, 1971.
[13] E. Provenzi, L. De Carli, A. Rizzi, and D. Marini, “Mathematical definition and analysis of the retinex algorithm,” Journal of the Optical Society of America A, vol. 22, no. 12, pp. 2613–2621, December 2005. [14] K. Matkovic, L. Neumann, A. Neumann, T. Psik, and W. Purgathofer, “Global contrast factor-a new approach to image contrast.” Computa-tional Aesthetics, vol. 2005, pp. 159–168, 2005.
[15] E. Peli, “Contrast in complex images,” JOSA A, vol. 7, no. 10, pp. 2032–2040, 1990.
[16] A. M. Haun and E. Peli, “24.1: Measuring the perceived contrast of natural images,” in SID Symposium Digest of Technical Papers, vol. 42, no. 1. Wiley Online Library, 2011, pp. 302–304.
[17] A. O. Aky¨uz, R. Fleming, B. E. Riecke, E. Reinhard, and H. H. B¨ulthoff, “Do hdr displays support ldr content?: a psychophysical evaluation,” in ACM Transactions on Graphics (TOG), vol. 26, no. 3. ACM, 2007, p. 38.
[18] L. Meylan, S. Daly, and S. Susstrunk, “The reproduction of specular highlights on high dynamic range displays,” in Proc. of the 14th Color Imagining Conference, 2006.
[19] D. A. Silverstein and J. E. Farrell, “Efficient method for paired comparison,” Journal of Electronic Imaging, vol. 10, no. 2, pp. 394– 398, 2001.
[20] E. Zerman, G. Valenzise, F. De Simone, F. Banterle, and F. Dufaux, “Effects of display rendering on hdr image quality assessment,” in SPIE Optical Engineering+ Applications. International Society for Optics and Photonics, 2015, pp. 95 990R–95 990R.
[21] ITU, “ITU-R BT.710-4 Subjective assessment methods for image quality in high-definition television,” International Telecommunication Union, Tech. Rep., 1998.
[22] M. D. Fairchild, “The hdr photographic survey,” in Color and Imaging Conference, vol. 2007, no. 1. Society for Imaging Science and Technology, 2007, pp. 233–238.
[23] S. Lasserre, F. LeL´eannec, and E. Francois, “Description of HDR se-quences proposed by technicolor,” ISO/IEC JTC1/SC29/WG11 JCTVC-P0228, IEEE, San Jose, USA, 2013.
[24] J. Froehlich, S. Grandinetti, B. Eberhardt, S. Walter, A. Schilling, and H. Brendel, “Creating cinematic wide gamut hdr-video for the evaluation of tone mapping operators and hdr-displays,” 2014. [Online]. Available: http://spiedigitallibrary.org
[25] M. Anderson, R. Motta, S. Chandrasekar, and M. Stokes, “Proposal for a standard default color space for the internetsrgb,” in Color and imaging conference, vol. 1996, no. 1. Society for Imaging Science and Technology, 1996, pp. 238–245.
[26] G. Valenzise, F. De Simone, P. Lauga, and F. Dufaux, “Performance evaluation of objective quality metrics for hdr image compression,” in SPIE Optical Engineering+ Applications. International Society for Optics and Photonics, 2014, pp. 92 170C–92 170C.
[27] E. Reinhard, M. Stark, P. Shirley, and J. Ferwerda, “Photographic tone reproduction for digital images,” in ACM Transactions on Graphics (TOG), vol. 21, no. 3. ACM, 2002, pp. 267–276.
[28] A. O. Aky¨uz and E. Reinhard, “Color appearance in high-dynamic-range imaging,” Journal of Electronic Imaging, vol. 15, no. 3, pp. 033 001–033 001, 2006.