HAL Id: hal-01632406
https://hal.archives-ouvertes.fr/hal-01632406
Submitted on 20 Oct 2018
HAL is a multi-disciplinary open access
archive for the deposit and dissemination of
sci-entific research documents, whether they are
pub-lished or not. The documents may come from
teaching and research institutions in France or
abroad, or from public or private research centers.
L’archive ouverte pluridisciplinaire HAL, est
destinée au dépôt et à la diffusion de documents
scientifiques de niveau recherche, publiés ou non,
émanant des établissements d’enseignement et de
recherche français ou étrangers, des laboratoires
publics ou privés.
Synthesis of calcium hydroxyapatite from calcium
carbonate and different orthophosphate sources: A
comparative study
Doan Pham Minh, Nathalie Lyczko, Haroun Sebei, Ange Nzihou, Patrick
Sharrock
To cite this version:
Doan Pham Minh, Nathalie Lyczko, Haroun Sebei, Ange Nzihou, Patrick Sharrock.
Synthesis
of calcium hydroxyapatite from calcium carbonate and different orthophosphate sources: A
com-parative study.
Materials Science and Engineering: B, Elsevier, 2012, 177 (13), pp.1080-1089.
Synthesis of calcium hydroxyapatite from calcium carbonate and different
orthophosphate sources: A comparative study
Doan Pham Minh
a,∗, Nathalie Lyczko
a, Haroun Sebei
a, Ange Nzihou
a, Patrick Sharrock
baUniversité de Toulouse, Mines Albi, CNRS, Centre RAPSODEE, Campus Jarlard, F-81013 Albi cedex 09, France bUniversité de Toulouse, SIMAD, IUT Paul Sabatier, Avenue Georges Pompidou, 81104 Castres, France
Keywords:
Calcium hydroxyapatite Calcium carbonate Orthophosphates
Ambient temperature synthesis
a b s t r a c t
The synthesis of calcium hydroxyapatite (Ca-HA) starting from calcium carbonate and different orthophosphate sources, including orthophosphoric acid, potassium, sodium and ammonium dihydrogen orthophosphates, was investigated under ambient conditions. The reaction started with calcium carbon-ate dissolution in an acid medium, followed by rapid precipitation of calcium cations with orthophosphcarbon-ate species to form calcium phosphate based particles which were in the size range of 0.4–1 !m. These parti-cles then agglomerated into much larger ones, up to 350 !m in diameter (aggregates). These aggregates possessed an unstable porous structure which was responsible for the porosity of the final products. The highest specific surface area and pore volume were obtained with potassium dihydrogen orthophos-phate. On the other hand, orthophosphoric acid led to the highest dissolution of calcium carbonate and the complete precipitation of orthophosphate species. Under ambient conditions, calcium phosphate based solid products of low crystallinity were formed. Different intermediates were identified and a reaction pathway proposed.
1. Introduction
Calcium hydroxyapatite (Ca-HA) continues to attract much attention owning to its many potential applications in fields such as medicine, wastewater treatment, and catalysis. For example, syn-thetic Ca-HA particles are used for coating metallic implants or bone grafts[1,2]. In heterogeneous catalysis, Ca-HA was found to be active in different reactions: oxidative dehydrogenation of light alkanes, water gas shift reaction, total oxidation of CO, photode-composition of organic pollutants, etc.[3–6]. Ca-HA also possesses very good retention capacities for heavy metals or organic pollu-tants in aqueous effluents[7–11]which confers a potential role for this calcium phosphate in environmental processes.
A great deal of effort has been devoted to the synthesis of Ca-HA and other apatitic products[12–16]. The genesis of carbonate apatites was first described by Ames[17], then by Krajewski[18]
using calcium carbonate as insoluble calcium source. Carbonate apatites were also made using soluble salts as starting materials
[19]. For Ca-HA, the standard synthesis calls for the use of soluble calcium salts[20,21]. The practically complete precipitation of cal-cium phosphate results from mixing the homogeneous solution of reactants. However, the use of soluble calcium salts requires the viscous Ca-HA precipitate to undergo a further purification step, so
∗ Corresponding author. Tel.: +33 563493258; fax: +33 563493043. E-mail address:doan.phamminh@mines-albi.fr(D. Pham Minh).
as to eliminate the associated anions. An alternate route for Ca-HA synthesis is the acid–base neutralization method using orthophos-phoric acid and lime solutions as starting materials which contain not counter ions[22–24]. Calcium carbonate is also a good can-didate for calcium source, thanks to its low cost, wide availability and the absence of interfering anions. Nevertheless, when it was used previously as a starting material, it was usually transformed into calcium oxide by a thermal treatment or into water soluble calcium salt by dissolution in an acid solution, prior to the Ca-HA synthesis[25,26].
In the present work, a comparative study of the synthesis of Ca-HA from calcium carbonate and different orthophosphate sources was investigated. The main purpose of this study was to com-pare the dissolution of calcium carbonate, the precipitation of orthophosphate and the formed solids when different orthophos-phate sources were used. Different characterization techniques were used for the analysis of the resulting solid products. The dis-solution of calcium carbonate was highest with orthophosphoric acid but could not yield a complete, quantitative and stoichio-metric Ca-HA precipitate after a long reaction time (48 h) at ambient temperature. Nevertheless, this pathway presents inter-esting industrial outlets.
2. Materials and methods
A fine powder of calcium carbonate (CaCO3, 98%, Fisher
orthophosphate (NH4H2PO4, 99%, Fisher Scientific), potassium
dihydrogen orthophosphate (KH2PO4, 99%, Fisher Scientific),
sodium dihydrogen orthophosphate (NaH2PO4, ≈100%, Fisher
Sci-entific) and orthophosphoric acid (H3PO4, 85 wt.% in water, Merck)
were used as orthophosphate sources without further modification. Ca-HA synthesis was carried out in a 1.2 liter (L) U-form glass reactor (i.d.: 10 cm, length: 15 cm), equipped with a vertical stirrer. In each synthesis, 0.6 mol of orthophosphate salts or orthophos-phoric acid and 500 mL of water were fed into the reactor and homogenized under stirring. Then 1.0 mol of calcium carbonate were added to the orthophosphate solution at a rate of 2.5 g min−1,
to avoid the overflowing of the liquid due to strong acid attack on calcium carbonate particles at low pH. These reactant quantities corresponded to the Ca/P molar ratio of 1.67, which is the theoreti-cal Ca/P molar ratio of Ca-HA. The reaction was kept under stirring (400 rpm) for 48 h under ambient conditions (25◦C, atmospheric
pressure). The pH of the reaction was monitored continuously throughout the reaction. During the reaction, samples were with-drawn from the reactor and filtered on a 0.45 !m filter paper to separate liquid and solid phases. The solid was washed with per-muted water and dried overnight in an oven at 105◦C under air
atmosphere.
Thermogravimetric analysis (TG) was carried out with a TA Instruments SDTQ600 analyzer. Heat-flow and weight changes associated with transitions and reactions in the products over the temperature range ambient to 1000◦C (heating rate of 5◦C min−1)
under air atmosphere (100 mL min−1) were measured
simultane-ously. X-ray diffraction (XRD) data were collected using a Phillips Panalytical X’pert Pro MPD diffractometer with a Cu K" (1.543 ˚A) radiation source and a nickel filter to suppress the Cu K# ray. Scanning electron microscopy coupled with energy dispersive spectroscopy (SEM-EDX) measurement was performed on a Philips XL30 ESEM apparatus (FEI Company). The particle size distribution of solid powders was measured by laser scattering in a Mastersizer 2000 (Malvern Instruments Ltd., Malvern, UK) in the range from 0.020 to 2000 !m. The specific surface area of the solids was mea-sured by nitrogen adsorption following standard vacuum drying at 105◦C, using the BET method (MICROMETRICS Gemini Vacprep
061). The adsorption–desorption isotherm was determined with a MICROMETRICS ASAP 2010 using nitrogen as gas adsorbate with the data collection from relative pressure (P/P◦) of 0.03–0.99.
Ele-mental analysis of the liquid phase was carried out using inductive coupled plasma atomic emission spectroscopy (ICP-AES) with a HORIBA Jobin Yvon Ultima 2 apparatus. The species distribution of orthophosphoric acid was computed using the solEq software (Academic Software, Yorks, UK) and the IUPAC stability constants database of 2004.
3. Results and discussion
3.1. pH evolution
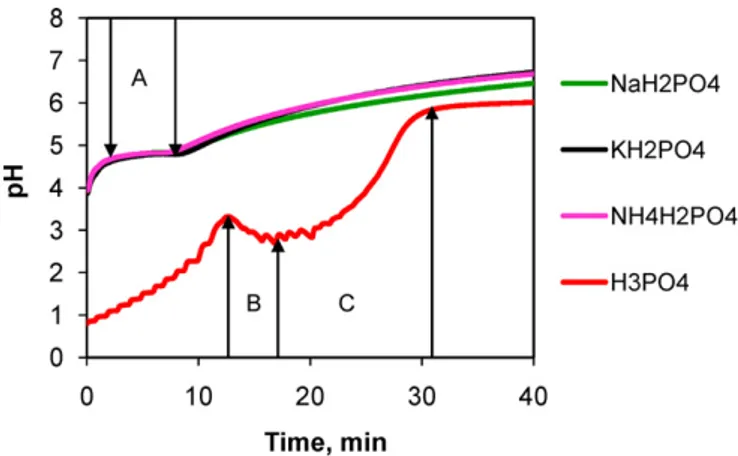
All four initial orthophosphate solutions had acid pH values. When calcium carbonate was added, it reacted immediately with the acid solutions, liberating carbonic gas. Taking into account the amount and addition rate of calcium carbonate into the acid solu-tions, the time taken for the complete addition of CaCO3was 40 min. Fig. 1shows the evolution of recorded pH values during this period where most notable changes in pH evolution were observed.
All three orthophosphate salts showed similar pH profiles. They had the initial pH of ca. 3.9 which increased rapidly in the first min-utes, accompanied by strong release of carbonic gas. This release was due to the acid attack on the calcium carbonate powder (Eq.(1)) where calcium cations were formed and protons were consumed. In
Fig. 1. pH evolution during the first fourteen min of the reaction using orthophosphoric acid (red); sodium dihydrogen orthophosphate (green); potassium dihydrogen orthophosphate (black) and ammonium dihydrogen orthophosphate (pink). (For interpretation of the references to color in this figure legend, the reader is referred to the web version of this article.)
the presence of different orthophosphate species, calcium cations were then rapidly precipitated (Eq.(2)).
2H++ CaCO3→ Ca2++ H2O + CO2 (1)
Ca2++ orthophosphates → calcium orthophosphates (2) Fig. 2recalls the distribution of orthophosphate species as a function of pH in the range 0–14 in aqueous solution.
At the pH of 3.9 corresponding to the initial pH of aqueous solutions of orthophosphate salts, the species distribution was 2.46%, 97.46%, 0.05% and 0% for H3PO4, H2PO4−, HPO42−, and
PO43−, respectively. With the presence of H2PO4− as the major
orthophosphate anion in the solution, mono-calcium phosphate monohydrate (MCPM, Ca(H2PO4)2·H2O) was expected to
precip-itate at this early stage[27]. Eqs.(1) and (2)can be combined as follows:
2H++ 2H2PO4−+ CaCO3→ Ca(H2PO4)2·H2O + CO2 (3)
After the initial increase, the pH stabilized during the contin-ued addition of calcium carbonate powder into the reactor (zone A,Fig. 1). This pH plateau could be explained by the formation of a second intermediate – dicalcium phosphate dihydrate (DCPD, CaHPO4·2H2O) or brushite (Eq.(4)). The formation of DCPD
accom-panied the release of protons H+. So the equilibrium between the
formation of protons H+in Eq.(4)and the consumption of protons
H+ in Eq.(1) led to the pH plateau in zone A (Fig. 1). After this
pH plateau, the pH increased gradually to about 6.7 after 40 min
Fig. 2. Distribution of orthophosphate species in aqueous solution as a function of pH.
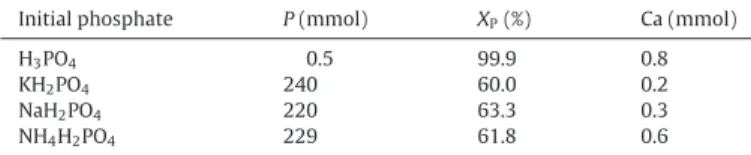
Table 1
Elementary analysis of soluble phosphorus and calcium in the liquid phase after 48 h of synthesis; XP: conversion of initial soluble phosphorus into solid calcium phosphate products.
Initial phosphate P(mmol) XP(%) Ca (mmol)
H3PO4 0.5 99.9 0.8
KH2PO4 240 60.0 0.2
NaH2PO4 220 63.3 0.3
NH4H2PO4 229 61.8 0.6
of reaction, which can be explained by the continuous acid con-sumption (Eq.(1)) and the evolution of MCPM and DCPD into other calcium phosphates.
Ca(H2PO4)2·H2O + Ca2++ 3H2O → 2[CaHPO4·2H2O] + 2H+ (4)
In the case of orthophosphoric acid, the initial pH was 0.8. At this pH, the species distribution was the following: 96.81%, 3.19%, 0% and 0% for H3PO4, H2PO4−, HPO42−, and PO43−, respectively. The
first increase in pH (before zone B,Fig. 1) was due to the consump-tion of protons H+(Eq.(1)) and the time-length of this increase was
longer than that of orthophosphate salts. So the quantity of MCPM formed was logically more than that from orthophosphate salts. After this first increase, the pH decreased (zone B,Fig. 1) despite the addition of calcium carbonate powder into the reactor. This drop in pH could also be attributed to the release of protons H+
coming from the transformation of MCPM into DCPD (Eq.(4)) at a rate higher than that of the consumption of protons H+in Eq.(1).
This phenomenon was also observed by Kim et al. in the synthesis of Ca-HA from Ca(OH)2 and orthophosphoric acid[28]. After the
decrease in zone B, the pH increased in zone C (Fig. 1) explained by the fact that in zone C, the transformation of MCPM into DCPD (Eq.(4)) reached equilibrium while protons H+were still
continu-ously consumed by Eq.(1). After zone C, the pH increased slightly indicating the slow evolution of MCPM and DCPD into other calcium orthophosphates. From 40 min to 48 h of reaction, the pH increased continuously and stabilized to about 8 for orthophosphate salts and 6.8 for orthophosphoric acid.
3.2. Elemental analysis of the liquid phase
Much work has been done on the synthesis of Ca-HA but the liq-uid phase has usually not been analyzed although it is indispensable to evaluate the performance of the synthesis process.
Table 1reports the contents of soluble phosphorus and calcium in the liquid phase, obtained by ICP-AES analysis. In all cases, the content of soluble calcium was very low after 48 h of reaction. So, most calcium existed in the solid state under either calcium phosphate products or non-dissolved calcium carbonate. The sol-uble phosphorus initially introduced in the reactor was 600 mmol. After 48 h of reaction, orthophosphoric acid led to a complete precipitation of soluble phosphate species into solid calcium phos-phates. On the other hand, all three orthophosphate salts resulted in lower yields of precipitation of orthophosphate species which never exceed 64%. Probably the presence of K+, Na+ and NH
4+
cations in the reaction mixtures caused this incomplete precip-itation of orthophosphate species. In fact, after 48 h of reaction using orthophosphate salts, the concentration of OH−was of ca.
10−6mol L−1because the final pH was of ca. 8. This concentration
of OH−anions was very small in comparison with that of K+, Na+and
NH4+cations. During the reaction, the initial solid carbonate was
essentially transformed into carbonic gas by acid attack (Eq.(1)). Thus, the contents of HCO3−and CO32−in the final liquid phase
must also be low. Logically in the synthesis using orthophosphate salts, some of initial orthophosphate species had to be present in the liquid phase as counter ions of K+, Na+or NH4+cations. Under
the present synthetic conditions, 36–40% of initial orthophosphate
Table 2
Evolution of calcium carbonate content remaining in the solid product calculated from the results of TG analysis.
Reaction time (h) CaCO3content (%)
H3PO4 NaH2PO4 KH2PO4 NH4H2PO4 1 27 54 50 52 3 25 50 45 45 7 25 48 43 43 24 23 43 43 43 31 20 41 41 41 48 18 34 34 35
salts could not be converted into solid calcium phosphate products. This demonstrated the interest of the use of orthophosphoric acid instead of orthophosphate salts.
3.3. TG analysis
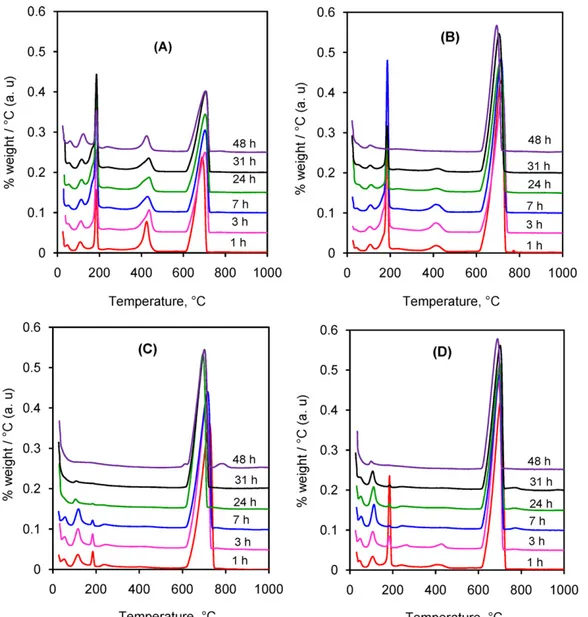
To better understand the evolution of intermediates during the reaction, solid samples withdrawn from the reaction mixture were washed, dried and then analyzed by different techniques.Fig. 3
shows the derivative thermogravimetry (DTG) curves in the tem-perature range from 25◦C to 1000◦C.
In this section, DTGmaxindicates the temperature
correspond-ing to the maximum of the DTG signal. InFig. 3(A), all samples had a small weight loss at the temperature lower than 100◦C, which
was attributed to the elimination of physically absorbed surface moisture. The second weight loss occurred at the DTGmaxof 110◦C,
which was due to the dehydration of MCPM (Eq. (5)). The next weight loss, much more abrupt, took place at the DTGmaxof 186◦C
and could be attributed to the dehydration of DCPD to form dical-cium phosphate anhydrous – DCPA (Eq.(6)). This last product was later condensed at the DTGmaxof 430◦C into calcium
pyrophos-phate (Eq.(7))[27]. The last and largest weight loss at the DTGmaxof
705◦C was due to the decomposition of the remaining calcium
car-bonate, according to reaction (Eq.(8)). The intensity of peaks related to calcium carbonate decomposition decreased progressively with the reaction time, indicating the continuous advancement of the reaction consuming the solid carbonate (Table 2).
Ca(H2PO4)2·H2O → Ca(H2PO4)2+ H2O (5)
CaHPO4·2H2O → CaHPO4+ 2H2O (6)
2CaHPO4→ Ca2P2O7+ H2O (7)
CaCO3→ CaO + CO2 (8)
Fig. 3(B) illustrates the DTG curves when sodium dihydrogen orthophosphate was used. MCPM was present in all samples in very small amounts while DCPD and DCPA decreased with the reaction time and had almost disappeared after 48 h of reaction. On the other hand, calcium carbonate was found at higher levels in compari-son to those inFig. 3(A), as was also observed forFig. 3(C) and (D) corresponding to the use of potassium and ammonium dihydro-gen orthophosphates. As illustrated inFig. 1, the initial pH of the starting aqueous solution of orthophosphoric acid was lower than those of orthophosphate salts. Thus, orthophosphoric acid had a stronger acid attack on the calcium carbonate powder. InFig. 3(C) and (D), all intermediates were present at low contents and had almost disappeared after 48 h of reaction.
From the results of TG analysis, the amount of remaining cal-cium carbonate in the solid samples was calculated (Table 2). As expected, orthophosphoric acid led to a higher dissolution of cal-cium carbonate than any of the three orthophosphate salts. In all cases, after a rapid acid attack during the first hour of reaction, in which 46–73% of the calcium carbonate was dissolved, the reac-tion rate decreased notably. Calcium phosphate precipitates, which
Fig. 3. DTG curves (arbitrary units) of the solid powders in the synthesis using orthophosphoric acid (A), sodium dihydrogen orthophosphate (B), potassium dihydrogen orthophosphate (C) and ammonium dihydrogen orthophosphate (D) as orthophosphate sources.
were formed during the first reaction period, might coat the sur-face of the calcium carbonate particles to form a biphasic structure, as observed in previous work[29]. Calcium phosphate layers of low solubility limit the contact between the calcium carbonate and soluble orthophosphate reactants, slowing the reaction rates.
All weight losses inFig. 3were endothermic so the correspond-ing DSC curves were not shown in this report.
3.4. XRD characterization
XRD patterns of the solid samples withdrawn at different time intervals are presented in Fig. 4. Remaining calcium carbonate showed the clearest crystalline phases in all cases. As expected, different calcium phosphate based products were identified. DCPD and DCPA were mostly present in all samples using orthophos-phoric acid or sodium dihydrogen orthophosphate (Fig. 4(A) and (B)). They reached the highest contents at 24 h for orthophospho-ric acid and at 7 h for sodium dihydrogen orthophosphate. Then their amount decreased, confirming their transformation into other products. On the other hand, DCPD and DCPA appeared only at the beginning of the reactions with potassium and ammonium dihy-drogen orthophosphates, which is coherent with the results of TG
analysis. In no cases could MCPM be detected which was in accord with its very low quantity in these solid products.
In addition to the intermediates identified by TG analy-sis, XRD results allowed the identification of low crystallinity Ca-HA and other apatitic compounds such as octacalcium bis(hydrogenphosphate) tetrakis(phosphate) pentahydrate (OCP, Ca8(HPO4)2(PO4)4·5H2O) and B-type calcium carbonate-apatite
(CAP). OCP could be formed because calcium carbonate was not totally consumed after 48 h of reaction, leading to a deficiency of available soluble calcium to construct the complete stoichiometric hydroxyapatite structure. The hydrolysis of the DCPD, which was the main intermediate in these syntheses, could also lead to the for-mation of OCP[30]. For the formation of CAP, the evolved carbonic gas saturated the solution with the increase in pH and participated in forming carbonate-apatite by the substitution of PO43−groups
by CO32−groups (B-type substitution)[31–33]. This was confirmed
by IR analysis of the solid products obtained after 48 h of reaction (Section3.5).
The low crystallinity of the solid products, as shown by weak broad peaks of apatitic structure, was due to the low reaction tem-perature of synthesis, ca. 25◦C. Higher temperatures are required
Fig. 4. XRD patterns of the solid powders in the syntheses using orthophosphoric acid (A), sodium dihydrogen orthophosphate (B), potassium dihydrogen orthophosphate (C) and ammonium dihydrogen orthophosphate (D) as orthophosphate sources. Principal diffractions of calcium carbonate (A); DCPD (o); DCPA (!); apatite structure ("). the largest dissolution of calcium carbonate by orthophosphoric
acid, the resulting solid product after 48 h of reaction was calcined at 900◦C for 1 h under air atmosphere. Its XRD pattern is presented
inFig. 5.
In Fig. 5, all peaks could be attributed to the diffractions of beta-tricalcium phosphate (#-TCP) and Ca-HA, which were both well-crystallized. Some active lime (CaO) also appeared in small amounts. In fact, the solid product from the reaction of calcium car-bonate and orthophosphoric acid contained exactly the Ca/P molar ratio of 1.67 (Table 1). However, some of initial calcium carbonate was not dissolved as verified above by TG results. This remain-ing calcium carbonate decomposed under thermal treatment and resulted in the formation of active lime. Most of this active lime reacted with the intermediates such as MCPM, DCPD, DCPA to form
TCP which is considered as the precursor of Ca-HA. The effect of temperature on the crystallinity of calcium phosphate based prod-ucts and the formation of TCP was already observed[36–38].
3.5. IR study
Fig. 6presents IR spectra of the solid products obtained after 48 h of reaction. In the wavelength range of 4000–1700 cm−1, only
a weak broad peak at about 3600–3000 cm−1, which was attributed
to water or OH−groups in apatitic channel, was observed (results
not shown).
In the wavelength region of 1700–500 cm−1, residual calcium
carbonate was characterized by its main peaks at 711 cm−1 and
Fig. 5. XRD patterns of the calcined solid powders after 48 h of synthesis using orthophosphoric acid. Diffraction of TCP (♦); Ca-HA ("); CaO ($).
to the presence of B-type carbonate-apatite[39]which confirmed again XRD results. The intensity of these peaks decreased in the following order: KH2PO4> NH4H2PO4> NaH2PO4> H3PO4. This was
in accord with the observation of pH evolution. The highest pH after 48 h of reaction was obtained with KH2PO4 which was the
most favorable for the formation of carbonate anion in solution and therefore for the formation of B-type carbonate-apatite. Peaks in the wavelength ranges of 650–500 cm−1and 1200–900 cm−1could
be attributed to different calcium phosphates present in these solid products[39,40].
3.6. Specific surface area measurement
From the point of view of the potential applications of Ca-HA based materials for the environmental or catalysis fields, specific surface area is an important parameter to consider.Table 3 sum-marizes the results obtained.
In all cases, SBETincreased with the reaction time, indicating the
evolution of the reaction at ambient conditions, which correlated with the change of calcium carbonate content inTable 2. The ini-tial calcium carbonate used in this investigation had a very low SBET
(<2 m2/g−1). Despite the lower elimination level of calcium
carbon-ate, all three orthophosphate salts led to higher SBETin comparison
to orthophosphoric acid. The solid product from the synthesis using
Fig. 6. IR spectra of the solid products obtained after 48 h of reaction.
Table 3
Specific surface area measured by BET method of the solid products after washing and drying.
Reaction time (h) Specific surface (SBET) (m2/g)
H3PO4 NaH2PO4 KH2PO4 NH4H2PO4
3 12 5 17 13
24 14 23 68 21
48 27 44 105 75
potassium dihydrogen orthophosphate showed the highest SBETof 105 m2/g after 48 h of reaction.
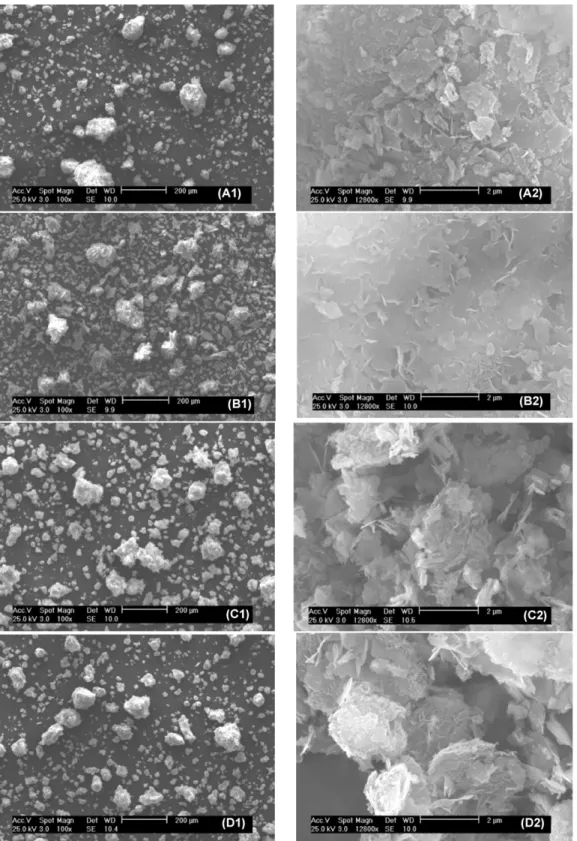
3.7. SEM-EDX analysis
The solid products obtained after 48 h of reaction were exam-ined by SEM-EDX and some examples are presented inFig. 7. On the left-hand side (200 !m scale), different groups of particles were present with a high occurrence of small particles. On the right-hand side (2 !m scale), the surfaces of big particles are presented with the same enlargement. Particles of the solid products formed from orthophosphoric acid (A2) and sodium dihydrogen orthophos-phate (B2) had a compact appearance with some sheet structure that could be due to the presence of DCPD in these solids[41]. On the other hand, particles formed from potassium dihydrogen orthophosphate (C2) and ammonium dihydrogen orthophosphate (D2) appeared much more porous and the primary platelets form-ing the aggregates could be clearly observed.
EDX analysis was also performed and in all cases, we observed the presence of Ca, P, O and C corresponding to calcium phos-phate based products. The presence of carbon was partly due to the carbonic gas in air and CAP, but could also be due to the remaining calcium carbonate. On the other hand, no traces of potassium, sodium or nitrogen were detected. Thus, there was no incorporation of these elements into the first surface lay-ers of calcium phosphates and simple washing prevented the possible inclusion of these elements on the surface of the solid products.
3.8. Particle size distribution and adsorption–desorption isotherm measurements
To confirm the results of SBET and SEM analysis, particle size
distribution and isothermal adsorption–desorption measurements were investigated.Fig. 8shows the particle size distribution of the initial calcium carbonate powder which could be considered as a Gaussian-like type for both volume and number distributions.
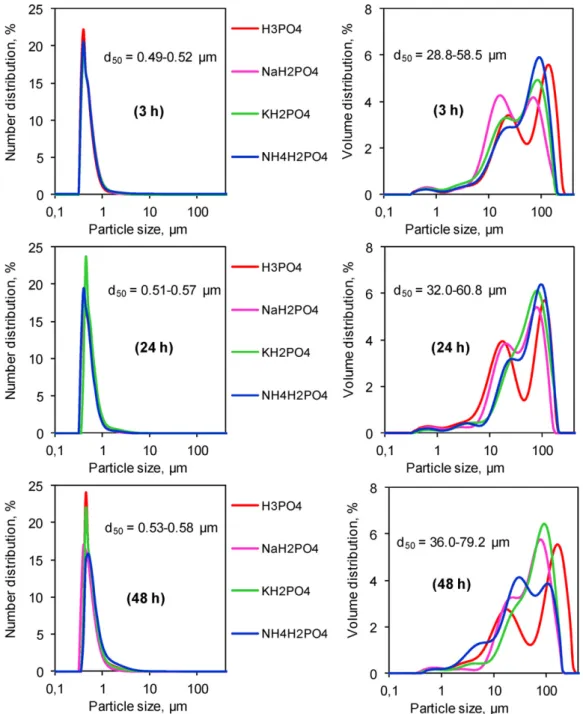
Fig. 9shows the comparison of number (left) or volume (right) distributions for the solid products obtained at different reaction times. The number distributions revealed that most particles were present in the range from 0.4 to 1 !m with more than 97% of the cumulative total. At each reaction time (3 h or 24 h or 48 h), there was very little difference between the four orthophosphate sources used. On the other hand, the volume distributions showed that more than 98% of accumulative volume belonged to the larger particles category (>1 !m).
For the family of particles smaller than 1 !m, the median diam-eter (d50) increased slightly with the reaction time indicating their
slow growth in the present reaction conditions. For the larger par-ticles family (>1 !m), in most cases, we observed the formation of three groups as follows: 1–10 !m, 10–80 !m and 80–350 !m. The common tendency of these groups was the increase in volume of the 80–350 !m group and the decrease in volume of the 1–10 !m and 10–80 !m groups during the course of the reaction.
Generally, the specific surface area of a material is attributed to both the external surface of particles and the internal surface of
Fig. 7. SEM analysis of the solid products after 48 h of reaction using orthophosphoric acid (A1, A2), sodium dyhydrogen phosphate (B1, B2), potassium dihydrogen phosphate (C1, C2) and ammonium dihydrogen phosphate (D1, D2).
pores if the material is porous. From the results of the particle size distribution analysis inFig. 9, the differences in the specific surface areas (SBET) inTable 3must be predominantly due to the porosity
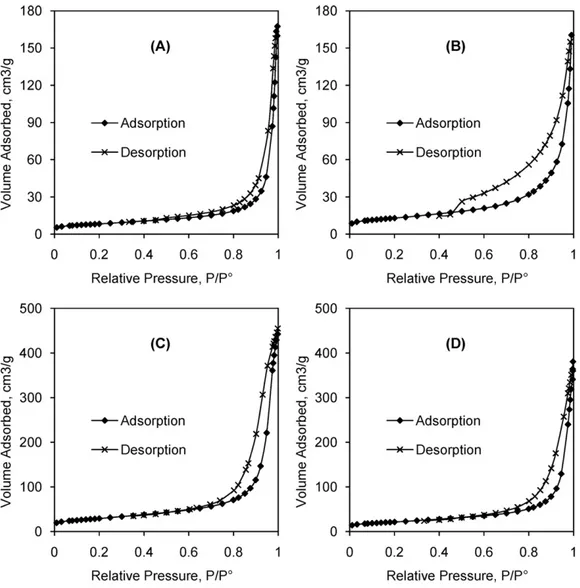
of the solids. Thus adsorption–desorption isotherms were carried out for four solids obtained after 48 h of reaction (Fig. 10).
All isotherms could be attributed to Type II solids with a hys-teresis loop of Type H3 in the IUPAC classification of physisorption isotherms[42].
Using the BJH method[43]for both adsorption and desorption branches of isotherms, the porous volume (Vp), calculated specific
surface area (Sc) and pore mean diameter (Dp) could be derived.
They are presented inTable 4.
For each solid product, the calculated specific surface area from the desorption branch (Sdes
c ) was higher than the specific surface
area (SBET). This result was characteristic of an unstable porous
Fig. 8. Particle size analysis of the initial calcium carbonate powder; (1) and (2): particle number and volume distribution, respectively.
which modify their pore volumes under the effect of high relative pressure. The pore mean diameters were all in the mesoporous range.
3.9. Reaction pathway
The formation of a large majority (97%) of small calcium phos-phate particles (<1 !m) from an initial calcium carbonate of much larger particle size confirmed the arguments in favor of dissolution of calcium carbonate to release calcium cations (Eq.(1)) and the formation of different calcium phosphate precipitates from these dissolved calcium cations and orthophosphate species (Eq.(2)). A reaction pathway could be proposed for the evolution of the reac-tion as given inScheme 1.
First, calcium carbonate powder was dissolved in acid solu-tion to form soluble calcium casolu-tions. These casolu-tions were then
Fig. 9. Number (left) and volume (right) distribution as a function of particle size of the solid products at different reaction times and pure CaCO3; particle size is in base 10 logarithmic scale.
Fig. 10. Isotherm plots of the solid products obtained at 48 h of reaction from (A) orthophosphoric acid; (B) sodium dihydrogen orthophosphate; (C) potassium dihydrogen orthophosphate and (D) ammonium dihydrogen orthophosphate.
precipitated with orthophosphate anions to form MCPM and DCPD as the first intermediates. MCPM evolved to DCPD by the reaction with more calcium cations. DCPD was then transformed into DCPA as another intermediate. These intermediates had the Ca/P molar ratio of 0.5/1 or 1/1. With the on-going reaction, calcium carbon-ate continued to be dissolved, accompanying the increase in pH by the consumption of protons. Under these conditions, DCPD and DCPA developed an apatitic composition. This transformation was slow and depended on the orthophosphate source. The presence
of carbonic gas or (bi)carbonate anions in the reaction mixture led to the formation of CAP in parallel with the formation of Ca-HA as the final product. Throughout the reaction, the agglomeration phenomenon of primary particles led to the formation of agglom-erates with sizes up to 350 !m. The final solid product after 48 h of reaction contained principally a mixture of Ca-HA, CAP and some left over CaCO3. Other intermediates including MCPM, DCPD and
DCPA could also be present, depending on the initial orthophos-phate source. Finally, the calcination at 900◦C for 1 h of the solid
Table 4
Results calculated from the isotherms of the solid products at 48 h of reaction: (A) orthophosphoric acid; (B) sodium dihydrogen orthophosphate; (C) potassium dihydrogen orthophosphate and (D) ammonium dihydrogen orthophosphate.
Product SBET(m2/g) Results from the adsorption Results from the desorption Vads
p (cm3/g) Sadsc (m2/g) Dadsp (nm) Vpdes(cm3/g) Sdesc (m2/g) Ddesp (nm)
(A) 27 0.25 25 39 0.26 32 32
(B) 44 0.24 39 25 0.25 83 12
(C) 105 0.68 98 28 0.65 136 19
(D) 75 0.52 69 30 0.49 94 20
product issue from the dissolution of calcium carbonate in the solu-tion of orthophosphoric acid resulted in the formasolu-tion of a biphasic mixture of well-crystalline TCP and Ca-HA.
4. Conclusion
For the first time, a comparative study on the direct syn-thesis of Ca-HA from calcium carbonate powder and different orthophosphates was undertaken. Orthophosphoric acid was the most interesting orthophosphate source since it was the most effi-cient for the dissolution of calcium carbonate and was the only reactant leading to complete consumption by precipitation of start-ing orthophosphate species within 48 h.
Porous solid products were formed with all orthophosphate reactants. The porosity of the products was due to the forma-tion of large aggregates which had an unstable porous structure. The difference in the porosity explained the difference in the specific surface area (SBET) of the solid products. On the other hand, particle size distributions were relatively similar to each other.
Using TG and XRD characterizations, different intermediates and their evolution during the reaction could be identified. A reac-tion pathway could be proposed.
Future work will focus on the improvement of the dissolution of calcium carbonate using orthophosphoric acid, for example at higher reaction temperature, together with TEM observations to confirm a simple one-step production route to economical Ca-HA. Acknowledgments
The authors gratefully acknowledge financial support from Solvay Group. Our gratitude goes to colleagues at RAPSODEE Cen-ter, Christine Rolland, Sylvie Del Confetto, Philippe Accart and Denis Marty for their technical help.
References
[1] R.Z. Legeros, S. Lin, R. Rohanizadeh, D. Mijares, J.P. Legeros, Journal of Materials Science Materials in Medicine 14 (2003) 201–209.
[2] S.V. Dorozhkin, M. Epple, Angewandte Chemie International Edition 41 (17) (2002) 3130–3146.
[3] A. Venugopal, M.S. Scurrell, Applied Catalysis A: General 245 (2003) 137–147. [4] C. Boucetta, M. Kacimi, Applied Catalysis A: General 356 (2009) 201–210. [5] M.I. Dominguez, F. Romero-Sarria, M.A. Centeno, J.A. Odriozola, Applied
Catal-ysis B: Environmental 87 (2009) 245–251.
[6] H. Nishikawa, S. Kato, T. Ando, Journal of Molecular Catalysis A: Chemical 236 (2005) 145–148.
[7] J.A. Gomez del Rio, P.J. Morando, D.S. Cicerone, Journal of Environment Man-agement 71 (2004) 169–177.
[8] W. Lemlikchi, P. Sharrock, M.O. Mecherri, M. Fiallo, Waste and Biomass Val-orization,in press.
[9] A. Nzihou, P. Sharrock, Waste Management 22 (2002) 235–239.
[10] I. Smiciklas, A. Onjia, S. Raicevic, Ð. Janackovic, M. Mitric, Journal of Hazardous Materials 152 (2008) 876–884.
[11] K. Lin, J. Pan, Y. Chen, R. Cheng, X. Xu, Journal of Hazardous Materials 161 (2009) 231–240.
[12] P. Koutsoukos, Z. Amjad, M.B. Tomson, G.H. Nancollas, Journal of the American Chemical Society 102 (1980) 1553–1557.
[13] K.S. TenHuisen, P.W. Brown, Biomaterials 19 (1998) 2209–2217.
[14] S. Jinawath, D. Pongkao, W. Suchanek, M. Yoshimura, International Journal of Inorganic Materials 3 (2001) 997–1001.
[15] W. Kim, F. Saito, Ultrasonics Sonochemistry 8 (2001) 85–88.
[16] D.M. Liu, T. Troczynski, W. Tseng, Journal of Biomaterials 23 (2002) 1227–1236. [17] L.L. Ames, Economic Geology and the Bulletin of the Society of Economic
Geol-ogists 54 (1959) 829–841.
[18] K.P. Krajewski, Sedimentology 31 (1984) 443–470.
[19] N. Nassif, F. Martineau, O. Syzgantseva, F. Gobeaux, M. Willinger, T. Coradin, S. Cassaignon, T. Azais, M.M. Giraud-Guille, Chemistry of Materials 22 (2010) 3653–3663.
[20] E. Hayek, H. Newesely, Inorganic Syntheses 7 (1963) 63–65.
[21] J.K. Lee, D.S. Song, K.H. Hwang, D.S. Seo, Key Engineering Materials 342–343 (2007) 661–664.
[22] A. Osaka, Y. Miura, K. Takeuchi, M. Asada, K. Takahashi, Journal of Materials Science Materials in Medicine 2 (1991) 51–55.
[23] J.F. Conn, L. Jessen, United States Patent 4,324,772 (1982).
[24] L. Bernard, M. Freche, J.L. Lacout, B. Biscans, Chemical Engineering Science 55 (2000) 5683–5692.
[25] V. Stanica, S. Dimitrijevic, J. Antic-Stankovic, M. Mitric, B. Jokic, I.B. Plecas, S. Raicevic, Applied Surface Science 256 (2010) 6083–6089.
[26] M.C. Chang, Journal of Materials Science Materials in Medicine 19 (2008) 3411–3418.
[27] J.C. Elliott, Studies in Inorganic Chemistry 18: Structure and Chemistry of the Apatites and Other Calcium Orthophosphates, Elsevier, Amster-dam/London/New York/Tokyo, 1994, pp. 9–29.
[28] D.W. Kim, I.S. Cho, J.Y. Kim, H.L. Jang, G.S. Han, H.S. Ryu, H. Shin, H.S. Jung, H. Kim, K.S. Hong, Langmuir 26 (1) (2010) 384–388.
[29] C. Verwilghen, M. Chkir, S. Rio, A. Nzihou, P. Sharrock, G. Depelsenaire, Materials Science and Engineering C 29 (2009) 771–773.
[30] W.E. Brown, J.R. Lehr, J.P. Smith, A.W. Frazier, Journal of the American Chemical Society 79 (19) (1957) 5318–5319.
[31] F. Yao, J.P. LeGeros, R.Z. LeGeros, Acta Biomaterialia 5 (2009) 2169–2177. [32] T.I. Ivanova, O.V. Frank-Kamenetskaya, A.B. Koltsov, V.L. Ugolkov, Journal of
Solid State Chemistry 160 (2011) 340–349.
[33] F. Bel Hadj Yahia, M. Jemal, Thermochimica Acta 505 (2010) 22–32. [34] M. Yoshimura, P. Sujaridworakun, F. Koh, T. Fujiwara, D. Pongkao, A. Ahniyaz,
Materials Science and Engineering C 24 (2004) 521–525.
[35] S. Jinawath, D. Polchai, M. Yoshimura, Materials Science and Engineering C 22 (2002) 35–39.
[36] C. Verwilghen, Thèse de doctorat, Université de Toulouse III, France, 2006, p. 103.
[37] R.Z. LeGeros, Chemical Reviews 108 (2008) 4742–4753.
[38] S. Nadir, A. Belainass, A. Irhzo, J.L. Lacout, Phosphorus, Sulfur, and Silicon and the Related Elements 112 (1–4) (1996) 33–40.
[39] M.E. Fleeta, X. Liu, Biomaterials 26 (2005) 7548–7554.
[40] Y. Guo, Y. Zhou, D. Jia, H. Tang, Microporous and Mesoporous Materials 118 (2009) 480–488.
[41] G. Cama, F. Barberis, M. Capurro, L. Di Silvio, S. Deb, Materials Chemistry and Physics 130 (2011) 1139–1145.
[42] K.S.W. Sing, D.H. Everett, R.A.W. Haul, L. Moscou, R.A. Pierotti, J. Rou-querol, T. Siemieniewska, Pure and Applied Chemistry 57 (4) (1985) 603–619.
[43] E.P. Barrett, L.G. Joyner, P.P. Halenda, Journal of the American Chemical Society 73 (1) (1951) 373–380.