Running Title: Antarctic microbial mats and climate change
1 2
The structuring role of climate-related environmental factors on
3Antarctic microbial mat communities
4Elie Verleyen1*, Koen Sabbe1, Dominic A. Hodgson2, Stana Grubisic3, Arnaud Taton3,4, 5
Sylvie Cousin1,5, Annick Wilmotte3, Aaike De Wever1, Katleen Van der Gucht1 & Wim 6
Vyverman1 7
8
1
Protistology & Aquatic Ecology, Department of Biology, Ghent University, 9
Krijgslaan 281 - S8, B-9000 Ghent, Belgium 10
2
British Antarctic Survey, Natural Environment Research Council, High Cross, Madingley 11
Road, Cambridge CB3 0ET, UK 12
3
Centre for Protein Engineering, Institute of Chemistry B6, Université de Liège, B-4000 13
Liège, Belgium 14
4
Present address: Center for the Study of Biological Complexity, Virginia Commonwealth 15
University, 1000 W. Cary St., Richmond, VA 23284, USA 16
5
Present address: Deutsche Sammlung von Mikroorganismen und Zellkulturen GmbH, 17
Mascheroder Weg 1b, D-38124 Braunschweig, Germany 18 19 20 21 22 23
ABSTRACT
24
Both ground based and satellite data show that parts of Antarctica have entered a period of 25
rapid climate change, which already impacted on the functioning and productivity of limnetic 26
ecosystems. In order to predict the consequences of future climate anomalies for lacustrine 27
microbial communities, we not only need better baseline information on their biodiversity but 28
also on the climate-related environmental factors structuring these communities. Here we 29
applied Denaturing Gradient Gel Electrophoresis (DGGE) of the SSU rDNA to asses the 30
genetic composition and distribution of cyanobacteria and eukaryotes in 37 benthic microbial 31
mat samples from East Antarctic lakes. The lakes were selected to span a wide range of 32
environmental gradients governed by differences in lake morphology and chemical limnology 33
across five ice-free oases. Sequence analysis of selected DGGE bands revealed a high degree 34
of potential endemism among the cyanobacteria (mainly represented by Oscillatoriales and 35
Nostocales), and the presence of a variety of protists (alveolates, stramenopiles, and green 36
algae), fungi, tardigrades and nematodes, which corroborates previous microscopy-based 37
observations. Variation partitioning analyses revealed that the microbial mat community 38
structure is largely regulated by both geographical and local environmental factors of which 39
salinity (and related variables), lake water depth, and nutrient concentrations are of major 40
importance. These three groups of environmental variables have previously been shown to 41
change drastically in Antarctica in response to climate change. Together, these results have 42
obvious consequences for predicting the trajectory of biodiversity under changing climate 43
conditions and call for the continued assessment of the biodiversity of these unique 44
ecosystems. 45
46
Key words: Antarctica, climate change, lake, microbial mats, DGGE
47 48
INTRODUCTION
49
Both ground based and satellite data show that parts of Antarctica have entered a period of 50
rapid climate change (Steig et al. 2009). In some regions such as the Antarctic Peninsula, 51
temperatures are rising at 0.55°C per decade, which is six times the global mean. This 52
warming trend has already had a detectable impact on the cryosphere; eighty seven percent of 53
Antarctic Peninsula glaciers have retreated in the last 60 years (Cook et al. 2005) and >14 000 54
km2 of ice shelves have collapsed (Hodgson et al., 2006a), with some of the disintegration 55
events being unprecedented during the past 11,000 years (Domack et al. 2005). Other regions 56
in Antarctica are, in contrast, showing a rapid net cooling trend, such as the McMurdo Dry 57
Valleys, where temperature dropped by 0.7°C per decade between 1986 and 2000 (Doran et 58
al. 2002). In East Antarctica many regions are similarly experiencing marked changes in their 59
weather, including increased wind speeds (Gillett & Thompson 2002) and changing patterns 60
of snow and ice accumulation (Hodgson et al. 2006b). 61
The recent temperature and climate anomalies have also had impacts on both 62
terrestrial and marine ecosystems in the Antarctic (Walther et al. 2002). Experiments 63
measuring the ecological changes occurring at inland nunataks, dry valleys, and coastal ice-64
free areas, have likened these ecosystems to ‘canaries in a coalmine’ and ‘natural 65
experiments’ with which to identify biological responses to changing climate variables that 66
are applicable on a wider (global) scale (see Convey 2001, Robinson et al. 2003, Lyons et al. 67
2006 for reviews). Already lacustrine ecosystems in some ice free regions have been shown 68
to respond quickly to air temperature variability. For example, long term monitoring of 69
maritime Antarctic lakes between 1980 and 1995 has revealed extremely fast ecosystem 70
changes associated with increased nutrient concentrations and primary production in response 71
to climate warming (Quayle et al. 2002). In East Antarctica, paleolimnological analyses of 72
three lakes in the Windmill Islands have revealed a rapid salinity rise during the past few 73
decades, which has been linked to regional increases in wind speed and enhanced evaporation 74
and sublimation of water and ice from the lakes and their catchments (Hodgson et al. 2006b). 75
Conversely, the long-term cooling trend in the McMurdo Dry Valleys resulted in lake level 76
fall, increased lake-ice thickness, and decreased primary production (Doran et al. 2002). A 77
short episodic warming event during the Austral summer of 2001-2002 reversed these 78
environmental changes and altered the biogeochemistry of the lakes (Foreman et al. 2004). 79
The most obvious feature of almost all lakes in polar oases is the extensive benthic 80
microbial mats, which develop in the absence or rarity of grazers, and often dominate primary 81
production (Ellis-Evans et al. 1998, Fig.S1). In order to be able to predict the effects of future 82
climate and concomitant environmental changes on these benthic microbial mats we not only 83
need better baseline information on their biodiversity, but also on the environmental factors 84
structuring their communities. This information is becoming available for soil and lake 85
bacterial communities (e.g., Pearce 2005, Yergeau et al. 2007), but is still largely lacking for 86
autotrophic biota inhabiting limnetic ecosystems. What is known comes from regional diatom 87
inventories (Verleyen et al. 2003, Gibson et al. 2006a), local biodiversity assessments (e.g., 88
Jungblut et al. 2005) and surveys of the surface pigment composition, for example in east 89
Antarctic lakes (Hodgson et al. 2004), which revealed that lake water depth (and lake ice 90
dynamics and light climate related variables such as turbidity), salinity and nutrient 91
concentration are the most important environmental variables structuring the microbial 92
communities. However, it is still unclear which factors influence the taxonomic composition 93
of those microorganisms which are difficult to identify to species level by microscopy, such 94
as the cyanobacteria and green algae (Vincent 2000, Taton et al. 2003, Unrein et al. 2005). 95
These data are however urgently needed, because these organisms (particularly cyanobacteria) 96
not only constitute the bulk of the biomass in most Antarctic lakes (Broady 1996), but also 97
include a large number of endemics (e.g., Gibson et al. 2006b, Taton et al. 2006a, b). 98
Cyanobacteria further efficiently recycle nutrients, and form the fabric of the microbial mats 99
in which fungi, protists and other bacteria are embedded (Vincent et al. 1993). 100
Here we used Denaturing Gradient Gel Electrophoresis (DGGE), a culture 101
independent molecular fingerprinting technique to analyse the genetic diversity of 37 102
microbial mat samples inhabiting 26 lakes in different ice-free regions of East Antarctica and 103
the Ross Sea region, including the McMurdo Dry Valleys and four ice-free oases in the Prydz 104
Bay region, namely the Vestfold Hills, the Larsemann Hills, the Bølingen Islands and the 105
Rauer Islands (see Fig.1 for a map). The lakes were selected to span a wide range of 106
environmental gradients (see Table 1 for the data measured), which are governed by lake 107
morphometry and chemical limnological factors. We aimed to assess the importance of these 108
different environmental factors in structuring the genetic composition of cyanobacteria and 109
eukaryotes inhabiting the microbial mat communities in these climate sensitive water bodies. 110
111
MATERIALS AND METHODS
112
Study sites
113
The McMurdo Dry Valleys (DV, 77°00'S-162°52'E) consist of three main valleys (Taylor, 114
Wright and Victoria Valley) located on the West coast of McMurdo Sound and are the largest 115
relatively ice-free area (approximately 4800 km²) in Southern Victoria Land (Fig.1). The 116
perennially ice-covered lakes, ephemeral streams and extensive areas of exposed soil within 117
the DV are subject to limited precipitation and limited salt accumulation. 118
The Vestfold Hills (VH, 68°30' S-78°00' E) form a 400 km2 ice-free area on the Prydz 119
Bay (PB) coast and consist of three main peninsulas (Mule, Broad and Long Peninsula) and a 120
number of offshore islands (Fig.1). Over 300 lakes with varying limnological properties are 121
found in the region, many of which have been intensively studied (Laybourn-Parry 2003). 122
The Larsemann Hills (LH, 69o23’ S-76o53’ E) in PB is a 50 km2 large ice-free area located 123
approximately midway between the eastern extremity of the Amery Ice Shelf and the southern 124
boundary of the VH. The region consists of two main peninsulas (Stornes and Broknes), 125
together with a number of scattered offshore islands. More than 150 lakes are found in the 126
LH. The lakes are mainly fresh water and range from small ephemeral ponds to large water 127
bodies (Gillieson et al. 1990). The Bølingen Islands (BI, 69°30’S – 75°50’E) is a smaller ice-128
free archipelago in PB, which is situated approximately 15 km to west-south-west of the LH 129
and north of the Publications Ice Shelf. The BI includes two medium-sized islands (> 1km2), 130
and numerous minor islands. Seven shallow lakes and ponds are found in the region of which 131
four have been analysed for pigment and diatom community structure (Sabbe et al. 2004, 132
Hodgson et al. 2004). The Rauer Islands (RI, 68°50' S - 77°45'E) are an ice-free coastal 133
archipelago in PB, situated approximately 30 km away from the VH, and includes 10 major 134
islands and promontories together with numerous minor islands covering a total area of some 135
300 km2. A detailed description of the RI and of the microbial communities inhabiting 10 out 136
of more than 50 shallow lakes and ponds are given in Hodgson et al. (2001). 137
138
Sampling
139
Microbial mats from the littoral and/or deep spot within the oxygenated euphotic zone in the 140
stratified lakes in the VH and the DV were sampled during the Austral summer of 1999 using 141
a custom-made scoop. Samples in the LH, BI and RI were taken manually from the littoral 142
zone in shallow lakes (< 2m), and using a Glew gravity corer from the deepest spot in the 143
deep lakes during the Austral spring and summer of 1997-1998. Replicates were taken in the 144
littoral and deeper (yet still oxygenated) parts of some lakes from the VH and LH in order to 145
account for microhabitat heterogeneity (Table 1). All the samples were frozen in the field and 146
kept frozen at -20°C prior to analysis. 147
DNA extraction, PCR, DGGE and DGGE band sequencing protocols
149
Nucleic acid extraction 150
Nucleic acids were extracted using a combined mechanical-chemical method. One gram of 151
mat material, 0.5 g of zirconium beads (0.1 mm diameter), 0.5 ml 1X TE buffer, pH 8 (10 152
mM Tris, pH 7.6, 1 mM EDTA) and 0.5 ml buffered phenol (pH 7 to 8) were added to a 2 ml 153
eppendorf tube which was shaken 4 times at high frequency (30 times/s) during 1.25 min with 154
intermittent cooling on ice. After 5 min centrifugation at 10,000 rpm, the aqueous supernatant 155
was extracted twice with phenol-chlorophorm-isoamylalcohol (25:24:1 v/v). The DNA in the 156
aqueous phase was precipitated (commercial solution of 1/10 v of 3 M sodium acetate pH 5, 2 157
v/v of 96 % ethanol and 3 µl glycogen; Boehringer Mannheim), concentrated (30 min 158
centrifugation after overnight storage at -20ºC) and washed (1 ml of 70 % ethanol was added 159
to the pellet and centrifuged for 5 min at 13000 rpm). The ethanol was removed and the pellet 160
was air-dried for 20 min. The DNA was purified after resuspension in 50 µl of 1X TE at 55°C 161
and incubation for 20 min at 55°C according to the protocol of the wizard DNA clean-up Kit 162
(Promega). Template DNA was stored at -20°C. 163
164
Polymerase Chain Reaction (PCR) 165
16S rRNA gene fragments that were 422 bp long were generated by seminested PCR, as 166
described by Boutte et al (2006). The primers used for the first PCR were 16S378F and 167
23S30R (Table 2). PCR amplification was performed in a 50 µl (total volume) reaction 168
mixture containing 0.5µl of mat DNA, 1X Super Taq Plus PCR buffer, the deoxynucleoside 169
triphosphate at a concentration of 0.2 mM, 0.5µM primer 16S27F (Table 2), 0.5µM primer 170
23S30R (Table 2), and 1 mg of bovine serum albumin (Sigma Chemical Co., St. Louis, Mo.) 171
ml-1, and 1 U of Super Taq Plus polymerase with proofreading activity (HT Biotechnology, 172
Cambridge, United Kingdom). Amplification was carried out with a Gene Cycler (Bio-Rad, 173
Hercules, Calif.) as follows: incubation for 5 min at 94°C, followed by 30 cycles of 45 s at 174
94°C, 45 s at 54°C, and 2 min at 68°C and then a final elongation step of 7 min at 68°C. The 175
resulting PCR products (0.5µl) served as templates for the second PCR, which was performed 176
with forward primer 16S378F and reverse primers 16S781R(a) and 16S781R(b) (Table 2), 177
which, respectively, target filamentous cyanobacteria and unicellular taxa (Boutte et al. 2006). 178
A 38-nucleotide GC-rich sequence was attached to the 5' end of each of the reverse primers. 179
The reaction conditions were the same as those described above except that amplification was 180
carried out as follows: incubation for 5 min at 94°C, followed by 35 cycles of 1 min at 94°C, 181
1 min at 60°C, and 1 min at 68°C and then a final elongation step of 7 min at 68°C. Two 182
distinct reactions were performed for each reverse primer. The negative control for the first 183
PCR was used in the second PCR to check for contamination. 184
A eukaryotic 18S rDNA fragment of approximately 260 bp was amplified using the 185
universal eukaryote specific primers GC1 and GC2 designed by Van Hannen et al. (1998; 186
Table 2). The 50 µl reaction mixture contained 100 ng of template DNA, 10X PCR-buffer 187
(Perkin Elmer), 20 mM MgCl2, 0.5 µM of each primer, 4 mM of each deoxynucleotides, 10 188
µg/µl of bovine serum albumin, and 2.5 U DNA Polymerase (AmpliTaq; Perkin Elmer) and 189
sterile water (Sigma) to adjust the final volume. A touchdown PCR amplification was 190
performed using a Tgradient cycler (Biometra) with the following conditions: 94°C for 5 min 191
followed by 20 cycles of 94°C for 1 min, 65°C for 1 min (this temperature was decreased 192
every cycle by 0.5°C until the touchdown temperature of 55.5°C was reached), 72°C for 1 193
min, 5 additional cycles were carried out at an annealing temperature of 55°C, and a final 194
extension step of 72°C for 10 min. The size of the amplified DNA was estimated by analysing 195
5 µl of PCR product on 1.5 % agarose gel, staining with ethidium bromide and comparing it 196
to a molecular weight marker (Smart-Ladder; Eurogentec). 197
Denaturing Gradient Gel Electrophoresis (DGGE) 199
DGGE of the cyanobacterial SSU rDNA fragments was carried out following the protocol of 200
Nübel et al. (1997) with a Dcode System (Bio-Rad). The PCR products obtained with two 201
different primers 16S781R(a) and 16S781R(b) were applied separately onto a 1 mm thick 6% 202
polyacrylamide gel. The gel contained a linear 45 to 60% denaturant gradient (100 % 203
denaturant corresponded to 7 M urea and 40 % (v/v) formamide). The pH of the TAE buffer 204
was adjusted to 7.4, and electrophoresis was performed for 16 h at 45 V and 60°C. 205
DGGE of the eukaryotic SSU rDNA fragments was performed as described by Muylaert et 206
al. (2002). Full PCR products were loaded onto a 1 mm thick 8 % (wt/v) polyacrylamide gels 207
in 1X TAE (20 mM Tris-acetate pH 7.4, 10 mM acetate, 0.5 mM disodium EDTA). The 208
denaturing gradient contained 30 to 55 % denaturant. The pH of the TAE buffer was adjusted 209
to 7.4, and electrophoresis was performed for 16 h at 75 V and 60°C. 210
On each gel, we ran three standard lanes (samples from temperate lakes) in parallel with 211
the study samples in order to aid the alignment of the bands. The DGGE gels were stained 212
with ethidium bromide and photographed on a UV transillumination table with a charge-213
coupled device camera. Automatic band matching using standard settings and manual 214
inspection of the band-classes was performed using the Bionumerics 5.1 software package 215
(Applied Maths BVBA, Belgium). 216
217
DGGE bands sequence determination and analysis 218
The cyanobacterial DGGE bands that could be properly cut out were excised with a surgical 219
scalpel rinsed with ethanol on a UV transillumination table. Each small gel block was placed 220
in 100 µl of sterile water for 2 h at room temperature. This solution was used as a template for 221
PCR amplification as described above (second PCR). Sequencing was carried out using the 222
primer 16S784R (derived from Nübel et al. 1997; Table 2) by GenomeExpress (Paris, France) 223
with an ABI PRISM system 377 (PE Applied Biosystems, Foster City, CA, United States). 224
Chimera detection was performed by using Check Chimera in the Ribosomal Database 225
Project (Maidak et al. 2001). 226
Eukaryotic DGGE bands with more than 40% relative band intensity in at least two 227
samples were selected for sequencing. These bands were excised and sequenced after re-228
extraction and amplification. Sequencing was performed with the ABI-Prism sequencing kit 229
(PE Biosystems) using the primer GC3 (5’-TCTGTGATGCCCTTAGATGTTCTGGG-3’) 230
and an automated sequencer (ABI-Prism 377). 231
A nucleotide BLAST search (Altschul et al. 1998) available at the NCBI website was 232
performed in order to obtain sequences that were most similar. New sequence data were 233
deposited in the GenBank database. 43 Partial 16S rDNA gene sequences of cyanobacteria 234
were deposited under the accession numbers EU009658, EU009659, EU009664 to 235
EU009666, EU009668, EU009674 to EU009679, EU009681 to EU009685, EU009689 to 236
EU009695, EU009698, EU009699, EU009701, EU009703, EU009705, EU009706, 237
EU009709 to EU009717, EU009719, EU009721 to EU009723 and the 22 partial 18S rDNA 238
eukaryotic sequences under the accession numbers EU004828 to EU004849 (Table S1). 239
240
Multivariate analysis
241
Two biotic matrices were developed and consist of the presence absence data of the DGGE 242
data obtained using universal eukaryotic and cyanobacteria specific primers (Table 2). The 243
datasets of the cyanobacteria identified using the two different primers were combined into 244
one single matrix as both primers were shown to target different cyanobacterial groups (i.e. 245
unicellular versus filamentous taxa) and allow a more complete assessment of the diversity of 246
the cyanobacterial flora (Boutte et al. 2006). The correlation coefficient between the number 247
of bands obtained using each primer was calculated in Statistica 6.0 in order to assess the 248
amount of overlap between both primers. If the correlation coefficient is low or insignificant, 249
both primers likely target different members of the cyanobacterial community. 250
In order to assess the amount of within-lake variability in the genetic composition of 251
the lakes in relation to the entire variability in these biotic matrices we applied cluster analysis 252
(Bray-Curtis, group average) using the computer programs PC-ORD 4.32 (McCune & 253
Mefford 1999). In order to identify those factors that structure the genetic composition of 254
cyanobacteria and eukaryotes in our studied Antarctic water bodies we applied direct 255
ordination analyses using the program CANOCO 4.5 for Windows (ter Braak & Smilauer 256
2002). Five different matrices were used: the two biotic incidence matrices, a matrix with the 257
environmental data, one with geographical factors and one representing the date of sampling. 258
The matrix with the geographical variables was created because dispersal and migration have 259
recently been shown to be important in structuring microbial communities on a regional 260
Antarctic (Verleyen et al. 2003) and a global scale (Vyverman et al. 2007; Verleyen et al. 261
2009). The matrix with the date of sampling was included as Lake Fryxell was sampled 262
during the late austral summer, whereas the other lakes were sampled during the late Austral 263
spring or early summer which might potentially influence their taxonomic composition. 264
Below we detail how these matrices where developed. 265
The environmental matrix contains 12 limnological variables (Table 1). Samples for 266
the analysis of nutrients and major ion concentrations were taken during the field campaigns 267
described above for the majority of the lakes (LH, BI and RI) and are extracted from Sabbe et 268
al. (2004) and Hodgson et al. (2001, 2004). For the lakes in the VH and Lake Fryxell the 269
environmental variables were extracted from Roberts & McMinn (1996) and Green et al. 270
(1989) and in these cases were not measured at the same time as the sampling of the microbial 271
mats. The seasonal matrix contained the ordinal date of sampling, with negatives values 272
denoting dates before January. The matrix with the geographical factors consists of the 273
eigenvectors corresponding to the positive eigenvalues (V1-V3) after principal coordinate 274
analysis of a truncated matrix of the geographic distances among the sampling sites (Borcard 275
and Legendre 2002), which approximates the connectivity between sites. This approach was 276
recently shown to be the proper method to test the importance of geographical variables in 277
explaining turnover patterns in communities (Jones et al. 2008). 278
First a principal component analysis (PCA) of the standardized and centred 279
environmental variables was applied in order to assess correlations between environmental 280
variables and to reveal whether environmental properties varied between the lakes in different 281
ice-free regions. We subsequently applied indirect and direct ordinations on the biotic data. 282
Detrended correspondence analyses (DCA), with detrending by segments, were used to 283
determine the length of the gradient in the biotic data sets. The length of gradient of the first 284
axes equalled 4.352 and 3.957 for the cyanobacteria and 3.540 and 6.185 for the eukaryotes 285
respectively, implying that unimodal ordination methods are most appropriate (ter Braak & 286
Smilauer 2002). Canonical correspondence analysis (CCA) with forward selection of log-287
transformed environmental factors and unrestricted Monte Carlo permutation tests (999 288
permutations, P ≤ 0.05) was used to select the minimal number of variables explaining the 289
largest amount of variation in the biotic data. The relative contribution of the environmental 290
variables to the ordination axes was evaluated by the canonical coefficients (significance of 291
approximate t-tests) and intraset correlations (ter Braak & Smilauer 2002). Variance inflation 292
factors were used to construct the most parsimonious model. In CCAs the ordination axes are 293
dependent on the selected environmental variables; different samples derived from the same 294
lake (i.e. with the same environmental variables) are therefore forced to cluster together. In 295
order to assess differences in the occurrence of the DGGE bands between (and within) the 296
lakes independently from environmental variability between the water bodies, CAs were run 297
with the significant environmental variables, selected by the CCAs, as supplementary 298
(passive) variables. 299
Variation partitioning analysis (cf. Borcard et al. 1992) was subsequently used to 300
assess the unique contribution of the environmental, geographical and seasonal variables in 301
structuring the microbial communities (Laliberté 2008). The forward selection procedure 302
using Monte Carlo Permutation tests (999 permutations) in CANOCO 4.5 was used to select 303
only those variables (geographical, seasonal and environmental variables selected separately) 304
that significantly explain variation in DGGE band occurrence between the lakes. The 305
variation partitioning analyses results in 8 fractions if at least one variable is significant in 306
each of the different factor classes, namely (1) the unique effect of geographical variables, (2) 307
the unique effect of environmental variables, (3) the unique effect of seasonal variables, and 308
the combined variation (4-7) due to joint effects of (1) and (2), (2) and (3), (1) and (3), and the 309
three groups of variables combined, and (8) the unexplained variation in DGGE band 310
patterns. Monte Carlo permutation tests (999 permutations) were used to assess the 311
significance of the ordination axes in each model. 312 313 RESULTS 314 Environmental properties 315
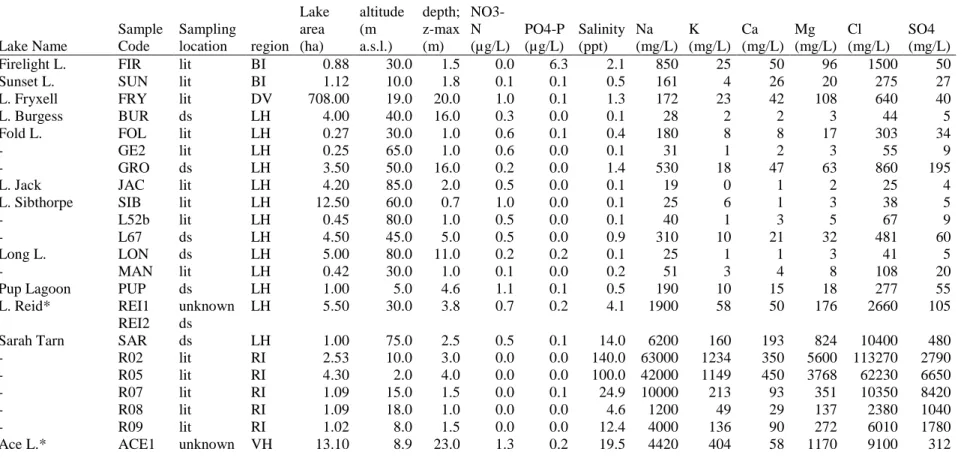
Our dataset contains water bodies ranging from small shallow ponds to deep and large lakes 316
(z-max between 0.7 and 39m; lake area between 0.27 and 708 ha) and spans a wide salinity 317
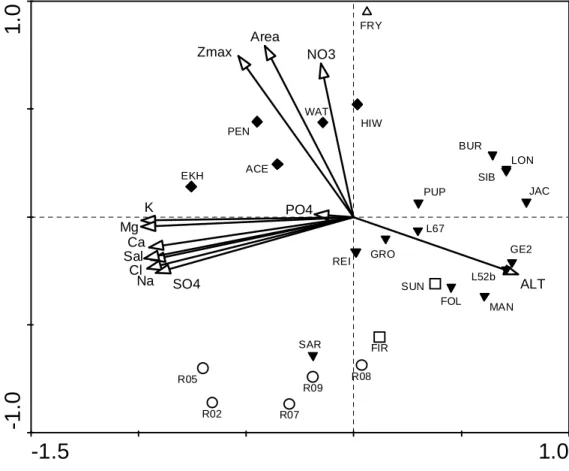
gradient from freshwater to hypersaline (between 0.1 and 140 ppt; Table 1). PCA of the 318
standardized and centred environmental variables revealed that the environmental diversity is 319
mainly structured by conductivity-related variables (major ions and salinity), morphological 320
variables (lake depth and area) and nutrient concentrations (NO3-N and PO4-P; Fig.2); PO4-P 321
is important on the third axis (figure not shown) and discriminates the relatively nutrient rich 322
Firelight Lake in the BI from the other sites. The four axes explain 93% of the total variance; 323
the first, second and third axes explain 63%, 17% and 8% respectively. The salinity gradient 324
is important along the first axis and negatively correlated with altitude. Geographic 325
differences in environmental properties are present; saline lakes are mainly restricted to the RI 326
and the nearby VH, whereas freshwater lakes dominate in the LH and the BI. Lake depth is 327
important along the second axis, with the lakes in the VH and Lake Fryxell in the DV being 328
larger and deeper than the shallow ponds in the RI and the generally smaller and shallower 329
lakes and ponds in the LH and BI. 330
331
Molecular richness and community composition
332
An average of 13 DGGE bands per sample was found using both cyanobacteria specific 333
primers, with a maximum of 24 (Sunset Lake in the BI) and a minimum of 6 (Lake Sibthorpe 334
in the LH and Highway Lake in the VH). The use of both primers allowed a more complete 335
assessment of the cyanobacterial diversity. The relationship between the molecular richness 336
obtained using both primers is not significantly correlated (R2Adj=-0.03, P=0.984) implying 337
that both primers are complimentary, which is in agreement with Boutte et al. (2006). Most 338
bands were relatively rare; over 50% of the bands occurred only in 1 or 2 samples. Only 2 339
bands occurred in over 50% of the samples, which were generally derived from saline lakes. 340
Another 5 bands occurred in over 25% of the samples. 341
The average yield of DGGE bands per sample using the universal eukaryotic primer 342
was 15. The maximum number of bands was 29 (Highway Lake in the VH) whilst only 1 343
band was observed in a hypersaline lake in the RI. Over 30% of the bands occurred in one or 344
two samples. Only 4 bands occurred in 25% or more of the samples. 345
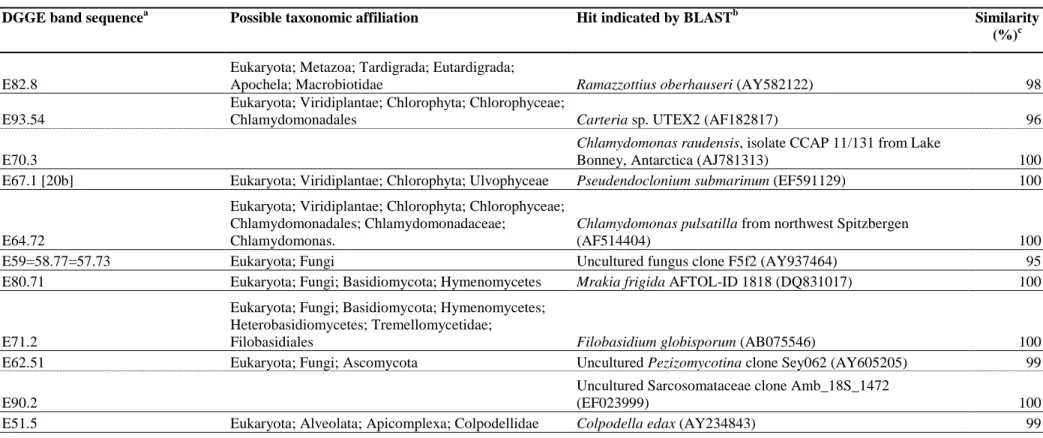
Sequence analysis of the DGGE bands and a subsequent BLAST search revealed the 346
presence of a variety of protists (alveolates, stramenopiles, unicellular green algae), fungi, 347
tardigrades, and nematodes among the eukaryotes (Table S1). For the cyanobacteria many 348
representatives of Leptolynbya and Nostoc were found. Interestingly, a large number of the 349
closest relatives of the cyanobacteria sequences in BLAST (in % similarity) were sequences 350
which are currently only reported from Antarctica and can thus be considered as potential 351
endemics. The sequences related to Nostocales did not follow this general trend, and have 352
closest relatives with sequences reported from outside Antarctica and can thus be considered 353
to have a cosmopolitan distribution. A picocyanobacterial sequence (Synechococcus sp.) was 354
found in the cyanobacterial mat of Firelight Lake. This taxon might however be derived from 355
the pelagic zone as a relatively well-developed planktonic community was observed in this 356
lake, likely due to the high phosphorous concentrations, present as a result of nutrient input 357
from the excreta of snow petrels nesting in the catchment (Sabbe et al. 2004). 358
No potential endemism was found for the eukaryotic sequences, as most of the 359
sequences or operational taxonomical units (OTU) had a high sequence similarity to 360
genotypes found in various regions. Yet, one of the OTUs (E70.3) had the highest sequence 361
similarity to Chlamydomonas raudensis isolated from Lake Bonney in the McMurdo Dry 362
Valleys. 363
364
Patterns in microbial community structure
365
The variability in taxonomic composition between lakes was assessed using CA and cluster 366
analysis (Fig. S2 and S3). The results of both methods are comparable. In the CA biplot of the 367
cyanobacteria the saline lakes from the RI and VH are situated on the right side of the 368
diagram, whereas the generally shallower and freshwater lakes from the LH and BI are plotted 369
on the left side (Fig.3). The relatively low amount of sequences prevents us from identifying 370
those bands underlying the differences in cyanobacterial community composition. One of the 371
bands generally found in saline lakes appeared to be related to Leptolynbya. The differences 372
between samples from the same lake are small relative to the variability between lakes; the 373
multiple samples from Highway Lake, Lake Pendant and the majority from Ace Lake are 374
highly similar and grouped in well-defined clusters (Fig. S2). However, ordination and cluster 375
analyses revealed that 2 samples from Ace Lake (one of which is a littoral sample; Table 1) 376
and the two samples from Lake Reid and Ekho Lake are clearly separated. 377
CA of the eukaryote DGGE band patterns revealed that the saline lakes from the RI 378
are situated on the positive side of the second axis (except R02; Fig.4). The freshwater lakes 379
from the LH and the BI are generally situated on the right side of the first axis in the CA 380
biplot, whereas the lakes from the VH are clustered along the left side of this axis, which is 381
negatively correlated with the concentration of the major ions and NO3-N. Although a 382
relatively small amount of DGGE bands were sequenced, some general observations can be 383
made regarding the taxonomic composition of the eukaryotic communities. Fungi belonging 384
to the Basidiomycota and Ascomycota occur in almost every lake (except L. Fryxell). The 385
lakes in the VH are characterised by the presence of ciliates belonging to the Spirotrichea and 386
Colpodea and a pennate diatom, which is virtually absent in the other lakes (Table S1; Fig. 4). 387
The lakes in the LH are, in contrast, characterised by the presence of Tardigrades belonging to 388
the Macrobiotidae, which are virtually absent in the studied water bodies from the other 389
regions (except Ekho Lake in the VH). Green algae are widespread in every region and 390
largely dominated by taxa belonging to the Chlamydomonadales, yet a difference in species 391
composition is present between the saline (RI and VH) and freshwater (BI and LH) lakes. 392
Members of the Ulvophyceae are generally more abundant in the VH lakes and rare in the 393
lakes from the RI and LH. The within-lake variability is similarly low in the eukaryotic 394
dataset, except for the samples from Lake Reid, one littoral sample from Pendant Lake and 395
two samples from Ace Lake, which belong to different groups than the other samples from 396
these particular lakes in the cluster analysis (Fig.S3). 397
CCA with forward selection and unrestricted Monte Carlo permutation tests of the 398
cyanobacteria dataset revealed that sulphate (positively correlated to salinity and the other 399
major ions; Fig. 2)), NO3-N, and lake water depth significantly explain 10.9% of the variation 400
in DGGE bands in the different lakes. CCA of the eukaryote data revealed that variation in 401
the DGGE band patterns is best explained by SO4, NO3-N, chloride and calcium 402
concentration and altitude. The latter is negatively correlated with salinity related variables 403
(Fig. 2) as the PB lakes, which are situated below c. 10 m, have mostly been isolated from the 404
sea due to isostatic uplift (Verleyen et al. 2005) and therefore in general are more saline. 405
Combined, the environmental variables explain 19.9% of the eukaryote DGGE band patterns. 406
The variance inflation factors were low (< 11 for all variables) in the final models, implying 407
that parsimonious models were selected. The species-environment correlation for all the axes 408
is relatively high in both datasets despite the small amount of variation explained (> 90% in 409
both datasets). 410
411
Variation partitioning analysis 412
Variation partitioning analyses allowed us to statistically assess the unique contribution of 413
environmental versus geographical and seasonal variables in explaining differences in the 414
occurrence of the DGGE bands in the lakes (Fig. 5). The seasonal variable was only selected 415
in the eukaryote dataset in the forward selection procedure. However, it failed to explain a 416
significant unique part of the variation in community structure after accounting for the 417
environmental and geographical variables. The environmental variables explained 16.9% and 418
9.1% of the total variance, independent of the geographical and seasonal variables in the 419
eukaryote and cyanobacteria datasets respectively (all ordination axes were significant at P ≤ 420
0.01 in both models). The geographical variables were less important and explained 10% and 421
5.8% of the total variance independent of the environmental and seasonal variables in the 422
eukaryote and cyanobacteria dataset respectively [all ordination axes were significant at P ≤ 423
0.05 in the eukaryote dataset, but marginally insignificant in the cyanobacteria dataset (P = 424
0.078 for all four ordination axes together)]. These results imply that although environmental 425
variables are more important than geographical factors, the latter partly underlie differences 426
between the microbial communities of the different ice-free oases, independent of 427
environmental and seasonal factors. In addition, geographical factors are apparently more 428
important in structuring eukaryote communities compared with cyanobacterial communities 429
at the SSU rDNA level. 430
431
DISCUSSION
432
Although our dataset contains only 26 lakes, and not all environmental (e.g. pH) and 433
biological (e.g. biotic interactions) variables were measured, we are confident that it covers 434
the most important ecological gradients known to structure east Antarctic lacustrine 435
communities, namely salinity (Gibson et al. 2006a) and lake water depth and related 436
variables, such as light regime and the amount of physical disturbance by lake ice (Fig. S1; 437
Verleyen et al. 2003, Sabbe et al. 2004). Furthermore our dataset contains the most abundant 438
lake types known to occur in these Antarctic ice-free oases, when water bodies are classified 439
according to their geomorphological origin (i.e., glacial lakes formed in hollows during ice 440
recession versus isolation basins formed as a result of postglacial isostatic rebound). Although 441
not exactly known for each water body, lake age is similarly highly variable and ranges from 442
>120,000 years (Hodgson et al. 2005) to c. 2000 years (Verleyen et al. 2004a, b). Apart from 443
epishelf lakes (Smith et al. 2006) and sub- and supraglacial water bodies (e.g., Hawes et al. 444
1999, Siegert et al. 2005), our dataset thus likely spans much of the environmental gradient in 445
this region, implying that our results can be cautiously extrapolated to the East Antarctic 446
biogeographical province. 447
Sequence analyses and BLAST searches revealed that the cyanobacteria genera 448
Leptolyngbya and Nostoc, and eukaryotes belonging to different taxonomic groups, such as 449
alveolates, stramenopiles (e.g. diatoms), green algae, fungi, tardigrades, and nematodes 450
dominate the microbial mat communities. Our taxonomic inventory corroborates previous 451
phenotype-based (e.g., Vinocur & Pizaro 2000, Sabbe et al. 2004) and genetic assessments 452
(e.g. Taton et al. 2006b; Jungblut et al. 2005), and autotrophic community composition 453
fingerprinting studies based upon HPLC analysis of photosynthetic pigments (e.g. Hodgson et 454
al. 2004). However, our molecular methods enabled, for the first time, a more accurate and 455
relatively complete assessment of the biodiversity at a lower taxonomic level for some groups 456
than is usually achieved using traditional microscopy (e.g., Vincent 2000, Unrein et al. 2005). 457
This is particularly the case for the green algae and cyanobacteria, which dominate these 458
ecosystems (Fig. S1) and constitute much of the structural fabric of the microbial mats and 459
thus provide the habitat for the other inhabiting biota (Broady 1996). The improved 460
performance of these methods becomes clear when our results are compared with 461
microscopy-based taxonomic inventories. For example in the lakes from the Larsemann Hills, 462
a total of 89 bands were found using our cyanobacteria specific primers. Although some 463
different bands might represent the same OTU as a result of the presence of ambiguities in the 464
sequences, this number clearly exceeds the number of phenotypes (27) present in a taxonomic 465
inventory of the same lakes based upon light microscopic observations (Sabbe et al. 2004). In 466
addition, the superiority of molecular methods in analysing cyanobacterial biodiversity 467
corroborates a polyphasic study of 59 strains isolated from a set of Antarctic lakes, where a 468
total of 21 OTU belonged to 12 cyanobacterial phenotypes (Taton et al. 2006b). 469
Interestingly, 23% of the new cyanobacterial sequences have no relatives in GenBank 470
from non-Antarctic environments that share more than 97.5% of similarity in sequence data. 471
In particular sequences from Leptolynbya were generally most closely related to sequences 472
which are restricted to Antarctica. The Nostocales were in contrast largely related to 473
sequences derived from other regions. The observed provinciality here is in agreement with 474
various studies that reported a relatively high number of potential Antarctic endemics (e.g., 475
Taton et al. 2003, 2006a, b, Jungblut et al. 2005). Restricted distribution patterns are however 476
absent in the eukaryotic dataset. This is however likely due to the fact that the SSU rDNA is 477
insufficient to discriminate to the species level because of its low taxonomic resolution. In 478
fact, previous studies reported a relatively high number of endemics belonging to a variety of 479
eukaryotic taxonomic groups (Barnes et al., 2006, Gibson et al. 2006b), such as diatoms 480
(Sabbe et al. 2003, Esposito et al. 2006), nematodes (Bamforth et al. 2005), ciliates (Petz et al. 481
2007), mites and springtails (Convey & Stevens 2007), flagellates (Boenigk et al. 2006) and 482
recently also green algae (De Wever et al. 2009). 483
The high number of rare bands in our dataset (particularly among the cyanobacteria) 484
corroborates recent findings based upon the molecular analysis of 4 contrasting Antarctic 485
lakes where 20 out of the 28 cyanobacterial OTU occurred in only one site (Taton et al. 486
2006a). The abundance of singletons and doubletons might be related to various factors, yet 487
does not necessarily mean that organisms are restricted to particular lakes as DGGE is known 488
to potentially suffer from methodological artefacts (e.g. Boutte et al. 2006) and is unlikely to 489
detect sequences present in low abundances (e.g., Muyzer et al. 1993, Fromin et al. 2002). 490
The restricted distribution patterns thus need to be confirmed using state-of-the art molecular 491
techniques such as QRT-PCR (Ahlgren et al. 2006) and dot-blot hybridization (Gordon et al. 492
2000), which allow the detection of sequences present in low quantities. Despite these 493
methodological problems, the rarity of a large number of bands suggests that at least the 494
dominance of the various taxa is different between the lakes. Fungi and green algae belonging 495
to the Chlamydomonadales are present in the majority of the lakes, yet different sequences 496
were obtained in saline versus freshwater lakes. In addition, tardigrades seem to be largely 497
restricted to the freshwater lakes from the Larsemann Hills, whereas they are absent or too 498
rare to be detected in the saline water bodies. Salinity appears thus to be the main 499
environmental variable in structuring these communities. Importantly, together with the other 500
variables significantly explaining differences in taxonomic composition, such as lake water 501
depth (Doran et al. 2002, Foreman et al. 2004) and nutrient concentrations (Quayle et al. 502
2002), salinity (and related variables; Hodgson et al., 2006b) have previously been shown to 503
change drastically in response to climate changes. Although within-lake dissimilarities are 504
present, and likely related to the origin of the samples (i.e. littoral samples are clustered apart 505
from their deep water counterparts), we cannot assess the importance of sample depth as it 506
was not systematically recorded during sampling. Despite the observed within-lake 507
variability, the environmental factors significantly explain part of the variation in DGGE band 508
patterns. This corroborates previous findings in particular taxonomic groups, such as diatoms 509
studied at the morphospecies level in east and maritime Antarctic lakes (e.g., Jones et al. 510
1993, Verleyen et al. 2003, Sabbe et al. 2004, Gibson et al. 2006a) and cyanobacteria 511
genotypes in supraglacial meltwater ponds on the McMurdo Ice Shelf (Jungblut et al. 2005) 512
whose community structure exhibited a close relationship with environmental factors. HPLC 513
analysis of the photosynthetic pigment composition in east Antarctic microbial mats similarly 514
revealed that the major groups of autotrophic organisms are constrained by these groups of 515
climate-related environmental factors (Hodgson et al. 2004). Interestingly, a microscopy 516
based taxonomic inventory of the cyanobacterial community composition in 56 lakes in the 517
Larsemann Hills revealed that lake depth and pH (not available for all studied lakes here) 518
were the most important variables (Sabbe et al. 2004), and that salinity (or conductivity) was 519
of minor importance in explaining the distribution of cyanobacterial morphotypes. In contrast, 520
our data revealed that salinity is important, as observed in other taxonomic groups, which 521
underscores the need to apply molecular techniques rather than classical microscopy, as 522
morphological characteristics are insufficient to discriminate between cyanobacterial OTUs 523
(e.g., Taton et al. 2006b; Jungblut et al. 2005). 524
Although the environmental factors explain more of the community structure than the 525
geographical variables, the structuring role of dispersal limitation in microbial communities is 526
confirmed by the variation partitioning analysis; 10% of the variance in the eukaryotic DGGE 527
bands, and 5.8% of the cyanobacterial DGGE bands were explained by geographical 528
variables. This is in agreement with similar studies of diatoms at an Antarctic regional scale 529
(Verleyen et al. 2003) and on a global scale (Vyverman et al. 2007; Verleyen et al. 2009), and 530
with other organisms in which environmental factors generally dominate over geographical 531
factors (Cotenie 2005). Although we acknowledge that our dataset represents only a cross-532
section of the biodiversity of east Antarctic lakes, both eukaryotic and cyanobacteria 533
communities are structured by geographical factors, after environmental variables are factored 534
out. This, together with the relatively high amount of cyanobacterial sequences that have no 535
relatives from non-Antarctic environments in GenBank, and the presence of Antarctic 536
endemics in at least three other taxonomic groups, namely diatoms (Sabbe et al. 2003), 537
flagellates (Boenigk et al. 2006) and green algae (De Wever et al. 2009) appears to contradict 538
previous claims that for microorganisms everything is everywhere (Baas Becking 1934). Our 539
results thus suggest that Antarctic microbial communities are probably structured by the same 540
processes as those occurring in macroorganisms, as has been observed in studies of global 541
diatom communities (Vyverman et al. 2007; Verleyen et al. 2009). 542
Together, our results thus have important implications for the distribution of taxa and 543
for predicting the biodiversity trajectory under changing climate conditions. In some regions 544
experiencing increased wind speeds, and in regions experiencing increasing temperatures, the 545
precipitation-evaporation balance will remain negative, which is expected to influence the 546
salinity and thus the future structure and composition of the microbial mat communities. It 547
remains uncertain how these climate changes will affect the dispersal and establishment 548
capacities of the microbial organisms, and whether this will lead to more introductions of 549
exotic species into these often unique ecosystems. 550
ACKNOWLEDGEMENTS
552
This research was funded by the EU project MICROMAT and the Belgian Federal Science 553
Policy (BelSPO) project AMBIO ‘Antarctic Microbial Biodiversity: the importance of 554
geographical and ecological factors’. EV is a postdoctoral research fellow of the Fund for 555
Scientific Research Flanders, Belgium (FWO). AT was funded by the Fund for Research 556
Formation in Industry and Agriculture (FRIA, Belgium). AW was Research Associate of the 557
National Fund for Scientific Research FNRS. We thank K. Welch, P. Noon, W. Quayle, J. 558
Laybourn-Parry, G. Murtagh, P. Dyer, T. Henshaw, and I. Janse who collected the samples. 559
The material was collected with the support of the Long Term Ecosystem Research Program 560
(LTER) and the Australian Antarctic Division (ASAC project 2112). Three anonymous 561
reviewers and Dr. R. De Wit are thanked for their constructive comments on an earlier version 562 of the manuscript. 563 564 565
REFERENCES
566
Ahlgren NA, Rocap G, Chisholm SW (2006) Measurement of Prochlorococcus ecotypes 567
using real-time polymerase chain reaction reveals different abundances of genotypes with 568
similar light physiologies. Environ Microbiol 8:441-454 569
Altschul S, Madden T, Schaffer A, Zhang JH, Zhang Z, Miller W, Lipman D (1998) Gapped 570
BLAST and PSI-BLAST: a new generation of protein database search programs. FASEB J 571
12:A1326 572
Baas Becking (1934) Geobiologie of inleiding tot de milieukunde. The Hague, the 573
Netherlands: W.P. Van Stockum & Zoon (in Dutch) 574
Bamforth SS, Wall DH, Virginia RA (2005) Distribution and diversity of soil protozoa in the 575
McMurdo Dry Valleys of Antarctica. Polar Biol 28:756-762 576
Barnes DKA, Hodgson DA, Convey P, Allen CS, Clarke A (2006) Incursion and excursion of 577
Antarctic biota: past, present and future. Glob Ecol Biogeogr 15:121-142 578
Boenigk J, Pfandl K, Garstecki T, Harms H, Novarino G, Chatzinotas A (2006) Evidence for 579
geographic isolation and signs of endemism within a protistan morphospecies. Appl Environ 580
Microbiol 72: 159-5164 581
Borcard D, Legendre P, Drapeau P (1992) Partialling out the spatial component of ecological 582
variation. Ecology 73:1045-1055 583
Boutte C, Grubisic S, Balthasart P, Wilmotte A (2006) Testing of primers for the study of 584
cyanobacterial molecular diversity by DGGE. J Microbiol Methods 65:542-550 585
Broady PA (1996) Diversity, distribution and dispersal of Antarctic terrestrial algae. 586
Biodivers Conserv 5:1307-1335 587
Convey P (2001) Terrestrial ecosystem responses to climate changes in the Antarctic. In: 588
Walther G-R, Burga CA, Edwards PJ (eds) 'Fingerprints' of Climate Change. Kluwer 589
Academic, New York, p 17–42 590
Convey P, Stevens MI (2007) Antarctic biodiversity. Science 317:1877-1878 591
Cook AJ, Fox AJ, Vaughan DG, Ferrigno JG (2005) Retreating glacier fronts on the Antarctic 592
Peninsula over the past half-century. Science 308:541-544 593
Cottenie K (2005) Integrating environmental and spatial processes in ecological community 594
dynamics. Ecol Lett 8: 1175-1182 595
De Wever A, Leliaert F, Verleyen E, Vanormelingen P, Van der Gucht K, Hodgson DA, 596
Sabbe K, Vyverman W (2009) Hidden levels of phylodiversity in Antarctic green algae: 597
further evidence for the existence of glacial refugia. Proc R Soc B: doi: 598
10.1098/rspb.2009.0994 599
Domack E, Duran D, Leventer A, Ishman S, Doane S, Mccallum S, Amblas D, Ring J, Gilbert 600
R, Prentice M (2005) Stability of the Larsen B Ice Shelf on the Antarctic Peninsula during the 601
Holocene epoch. Nature 436:681-685 602
Doran PT, Priscu JC, Lyons WB, Walsh JE, Fountain AG, Mcknight DM, Moorhead DL, 603
Virginia RA, Wall DH, Clow GD, Fritsen CH, Mckay CP, Parsons AN (2002) Antarctic 604
climate cooling and terrestrial ecosystem response. Nature 415:517-520 605
Ellis-Evans JC, Laybourn-Parry J, Bayliss PR, Perriss SJ (1998) Physical, chemical and 606
microbial community characteristics of lakes of the Larsermann Hills, continental Antarctica. 607
Arch Hydrobiol 141:209-230 608
Esposito RMM, Horn SL, Mcknight DM, Cox MJ, Grant MC, Spaulding SA, Doran PT, 609
Cozzetto KD (2006) Antarctic climate cooling and response of diatoms in glacial meltwater 610
streams. Geophys Res Lett 33: L07406 611
Foreman CM, Wolf CF, Priscu JC (2004) Impact of episodic warming events on the physical, 612
chemical and biological relationships of lakes in the McMurdo Dry Valleys, Antarctica. 613
Aquat Geochem 10:239-268 614
Fromin N, Hamelin J, Tarnawski S, Roesti D, Jourdain-Miserez K, Forestier N, Teyssier-615
Cuvelle S, Gillet F, Aragno M, Rossi P (2002) Statistical analysis of Denaturing Gel 616
Electrophoresis (DGE) fingerprinting patterns. Environ Microbiol 4:634-643 617
Gibson JAE, Roberts D, Van De Vijver B (2006a) Salinity control of the distribution of 618
diatoms in lakes of the Bunger Hills, East Antarctica. Polar Biol 29:694-704 619
Gibson JAE, Wilmotte A, Taton A, Van de Vijver B, Beyens L, Dartnall HJG (2006b) 620
Biogeographic trends in Antarctic lake communities. In: Bergstrom DM, Convey P, Huiskes 621
AHL (eds) Trends in Antarctic terrestrial and limnetic ecosystems. Springer, Dordrecht, p 71-622
99 623
Gillett NP, Thompson DWJ (2002) Simulation of recent Southern Hemisphere climate 624
change. Science 302: 273-271 625
Gillieson D, Burgess J, Spate A, Cochrane A (1990) An atlas of the lakes of the Larsemann 626
Hills, Princess Elizabeth Land, Antarctica. The Publications Office, Kingston Tasmania 627
Gordon DA, Priscu J, Giovannoni S (2000) Origin and phylogeny of microbes living in 628
permanent Antarctic lake ice. Microb Ecol 39:197-202 629
Green WJ, Gardner TJ, Ferdelman TG, Angle MP, Varner LC and Nixon P (1989)
630
Geochemical processes in the Lake Fryxell Basin (Victoria Land, Antarctica). Hydrobiologia
172: 129-148
632
Hawes I, Smith R, Howard-Williams C, Schwarz AM (1999) Environmental conditions 633
during freezing, and response of microbial mats in ponds of the McMurdo Ice Shelf, 634
Antarctica. Antarct Sci 11:198-208 635
Hodgson DA, Vyverman W, Sabbe K (2001) Limnology and biology of saline lakes in the 636
Rauer Islands, eastern Antarctica. Antarct Sci 13: 255-270 637
Hodgson DA, Vyverman W, Verleyen E, Sabbe K, Leavitt PR, Taton A, Squier AH, Keely BJ 638
(2004) Environmental factors influencing the pigment composition of in situ benthic 639
microbial communities in aast Antarctic lakes. Aquat Microb Ecol 37:247-263 640
Hodgson DA, Verleyen E, Sabbe K, Squier AH, Keely BJ, Leng M, Saunders KM, Vyverman 641
W (2005) Late Quaternary climate-driven environmental change in the Larsemann Hills, east 642
Antarctica, multi-proxy evidence from a lake-sediment core. Quat Res 64: 83-99 643
Hodgson DA, Bentley MJ, Roberts SJ, Smith JA, Sugden DE, Domack EW (2006a) 644
Examining Holocene stability of Antarctic Peninsula ice shelves. EOS Trans, Amer Geophys 645
Union 87:305-312. 646
Hodgson DA, Roberts D, Mcminn A, Verleyen E, Terry B, Corbett C, Vyverman W (2006b) 647
Recent Rapid Salinity Rise in Three East Antarctic Lakes. J Paleolim 36:385-406 648
Jones VJ, Juggins S, Ellisevans JC (1993) The relationship between water chemistry and 649
surface sediment diatom assemblages in Maritime Antarctic lakes. Antarct Sci 5:339-348 650
Jones MM, Tuomisto H, Borcard D, Legendre P, Clark DB, Olivas PC (2008) Explaining 651
variation in tropical plant community composition: influence of environmental and spatial 652
data quality. Oecologia 155: 593-604 653
Jungblut AD, Hawes I, Mountfort D, Hitzfeld B, Dietrich DR, Burns BP, Neilan BA (2005) 654
Diversity within cyanobacterial mat communities in variable salinity meltwater ponds of 655
McMurdo Ice Shelf, Antarctica. Environ Microbiol 7: 519-529 656
Laliberté E (2008) Analyzing or explaining beta diversity? Comment. Ecology 89: 3232-3237 657
Laybourn-Parry J (2003) Polar limnology - the past, the present and the future. In: Huiskes 658
AHL, Gieskes WWC, Rozema J, Schorno RML, van der Vies SM, Wolff W.J. (eds) Antarctic 659
Biology in a Global Context. Backhuys Publishers, Leiden, p 321-317 660
Lyons WB, Laybourn-Parry J, Welch KA, Priscu JC (2006) Antarctic lake systems and 661
climate change. In: Bergstrom DM, Convey P, Huiskes AHL (eds) Trends in Antarctic 662
terrestrial and limnetic ecosystems. Springer, Dordrecht, p 273-295 663
Maidak BL, Cole JR, Lilburn TG, Parker CT, Saxman PR, Farris RJ, Garrity GM, Olsen GJ, 664
Schmidt TM, Tiedje JM (2001) The RDP-II (Ribosomal Database Project). Nucleic Acids Res 665
29:173-17 666
McCune B, Mefford MJ (1999) PC-ORD. Multivariate analysis of ecological data. Version 667
4.32 MJM Software, Gleneden Beach, Oregon, USA. 668
Muylaert K, Van Der Gucht K, Vloemans N, De Meester L, Gillis M, Vyverman W (2002) 669
Relationship between bacterial community composition and bottom-up versus top-down 670
variables in four eutrophic shallow lakes. Appl Environ Microbiol 68:4740-4750 671
Muyzer G, Dewaal EC, Uitterlinden AG (1993) Profiling of complex microbial-populations 672
by Denaturing Gradient Gel-Electrophoresis analysis of Polymerase Chain Reaction-673
amplified genes-coding for 16S ribosomal-RNA. Appl Environ Microbiol 59:695-700 674
Nübel U, Garcia-Pichel F, Muyzer G (1997) PCR primers to amplify 16S rRNA genes from 675
cyanobacteria. Appl Environ Microbiol 63:3327-3332 676
Pearce DA (2005) The structure and stability of the bacterioplankton community in Antarctic 677
freshwater lakes, subject to extremely rapid environmental change. FEMS Microbiol Ecol 678
53:61-72 679
Petz W, Valbonesi A, Schiftner U, Quesada A, Ellis-Evans JC (2007) Ciliate biogeography in 680
Antarctic and Arctic freshwater ecosystems: endemism or global distribution of species? 681
FEMS Microbiol Ecol 59:396-408 682
Quayle WC, Peck LS, Peat H, Ellis-Evans JC, Harrigan PR (2002) Extreme responses to 683
climate change in Antarctic lakes. Science 295:645 684
Roberts D, Mcminn A (1996) Relationships between surface sediment diatom assemblages 685
and water chemistry gradients in saline lakes of the Vestfold Hills, Antarctica. Antarct Sci 686
8:331-341 687
Robinson SA, Wasley J, Tobin AK (2003) Living on the edge - plants and global change in 688
continental and Maritime Antarctica. Glob Change Biol 9:1681-1717 689
Sabbe K, Verleyen E, Hodgson DA, Vanhoutte K, Vyverman W (2003) Benthic diatom flora 690
of freshwater and saline lakes in the Larsemann Hills and Rauer Islands, East Antarctica. 691
Antarct Sci 15:227-248 692
Sabbe K, Hodgson DA, Verleyen E, Taton A, Wilmotte A, Vanhoutte K, Vyverman W (2004) 693
Salinity, depth and the structure and composition of microbial mats in continental Antarctic 694
lakes. Freshw Biol 49:296-319 695
Siegert MJ, Carter S, Tabacco I, Popov S, Blankenship DD (2005) A revised inventory of 696
Antarctic subglacial lakes. Antarct Sci 17:453-460 697
Smith JA, Hodgson DA, Bentley MJ, Verleyen E, Leng MJ, Roberts SJ (2006) Limnology of 698
two Antarctic epishelf lakes and their potential to record periods of ice shelf loss. J 699
Paleolimnol 35:373-394. 700
Steig EJ, Schneider DP, Rutherford SD, Mann ME, Comiso JC, Shindell DT (2009) Warming 701
of the Antarctic ice-sheet surface since the 1957 International Geophysical Year. Nature 457: 702
459-463. 703
Taton A, Grubisic S, Brambilla E, De Wit R, Wilmotte A (2003) Cyanobacterial diversity in 704
natural and artificial microbial mats of Lake Fryxell (McMmurdo Dry Valleys, Antarctica): a 705
morphological and molecular approach. Appl Environ Microbiol 69:5157-5169 706
Taton A, Grubisic S, Balthasart P, Hodgson DA, Laybourn-Parry J, Wilmotte A (2006a) 707
Biogeographical distribution and ecological ranges of benthic cyanobacteria in east Antarctic 708
lakes. FEMS Microbiol Ecol 57:272-289 709
Taton A, Grubisic S, Ertz D, Hodgson DA, Piccardi R, Biondi N, Tredici MR, Mainini M, 710
Losi D, Marinelli F, Wilmotte A (2006b) Polyphasic study of Antarctic cyanobacterial strains. 711
J Phycol 42:1257-1270 712
ter Braak CJF, Smilauer P. (2002) CANOCO reference manual and user's guide to CANOCO 713
for Windows: software for canonical community ordination (version 4). Microcomputer 714
Power, Ithaca, NY USA 715
Unrein F, Izaguirre I, Massana R, Balagué V, Gasol JM (2005). Nanoplankton assemblages in 716
maritime Antarctic lakes: characterisation and molecular fingerprinting comparison. Aquat 717
Microb Ecol 40: 269–282 718
Van Hannen EJ, Van Agterveld MP, Gons HJ, Laanbroek HJ (1998) Revealing genetic 719
diversity of eukaryotic microorganisms in aquatic environments by denaturing gradient gel 720
electrophoresis. J Phycol 34:206-213 721
Verleyen E, Hodgson DA, Vyverman W, Roberts D, Mcminn A, Vanhoutte K, Sabbe K 722
(2003) Modelling diatom responses to climate induced fluctuations in the moisture balance in 723
continental Antarctic lakes. J Paleolim 30:195-215 724
Verleyen E, Hodgson DA, Sabbe K, Vanhoutte K, Vyverman W (2004a) Coastal 725
oceanographic conditions in the Prydz Bay region (East Antarctica) during the Holocene 726
recorded in an isolation basin. Holocene 14:246-257 727
Verleyen E, Hodgson DA, Sabbe K, Vyverman W (2004b) Late Quaternary deglaciation and 728
climate history of the Larsemann Hills (East Antarctica). J Quat Sci 19:361-375 729
Verleyen E, Hodgson DA, Milne GA, Sabbe K, Vyverman W (2005) Relative sea-level 730
history from the Lambert Glacier region, East Antarctica, and its relation to deglaciation and 731
Holocene glacier readvance. Quat Res 63: 45-52 732
Verleyen E,VyvermanW, Sterken M, Hodgson DA, De Wever A, Juggins S, Van de Vijver 733
B, Jones VJ, Vanormelingen P, Roberts D, Flower R, Kilroy C, Souffreau C, Sabbe K (2009) 734
The importance of dispersal related and local factors in shaping the taxonomic structure of 735
diatom metacommunities. Oikos doi: 10.1111/j.1600-0706.2009.17575.x 736
Vincent WF, Castenholz RW, Downes MT, Howard-Williams C (1993) Antarctic 737
cyanobacteria: light, nutrients and photosynthesis in their microbial mat environment. J 738
Phycol 29:745-755 739
Vincent WF (2000) Evolutionary origins of Antarctic microbiota: invasion, selection and 740
endemism. Antarct Sci 12:374-385 741
Vinocur A, Pizarro H (2000) Microbial mats of twenty-six lakes from Potter Peninsula, King 742
George Island, Antarctica. Hydrobiologia 437:171-185 743
Vyverman W, Verleyen E, Sabbe K, Vanhoutte K, Sterken M, Hodgson DA, Mann DG, 744
Juggins S, Van de Vijver B, Jones VJ, Flower R, Roberts D, Chepurnov V, Kilroy C, 745
Vanormelingen P, De Wever A (2007) Historical processes constrain patterns in global 746
diatom diversity. Ecology 88:1924-1931 747
Walther GR, Post E, Convey P, Menzel A, Parmesan C, Beebee TJC, Fromentin JM, Hoegh-748
Guldberg O, Bairlein F (2002) Ecological responses to recent climate change. Nature 749
416:389-395 750
Yergeau E, Newsham KK, Pearce DA, Kowalchuk GA (2007) Patterns of bacterial diversity 751
across a range of Antarctic terrestrial habitats. Environ Microbiol 9: 2670–2682. 752
Table 1: Chemical and morphological characteristics of the studied lakes. Biological samples were taken at different areas in the lakes indicated
with an asterisk. Sampling locations are littoral zone (lit) and the deepest spot in the oxygenated zone (ds). REI1 and REI2 correspond to ReidJ and ReidD in Taton et al. (2006a) respectively. Multiple samples from the same lake have identical environmental variables, although lake depth can vary slightly (but was not consistently measured during the time of sampling).
Lake Name Sample Code Sampling location region Lake area (ha) altitude (m a.s.l.) Lake depth; z-max (m) NO3-N (µg/L) PO4-P (µg/L) Salinity (ppt) Na (mg/L) K (mg/L) Ca (mg/L) Mg (mg/L) Cl (mg/L) SO4 (mg/L)
Firelight L. FIR lit BI 0.88 30.0 1.5 0.0 6.3 2.1 850 25 50 96 1500 50
Sunset L. SUN lit BI 1.12 10.0 1.8 0.1 0.1 0.5 161 4 26 20 275 27
L. Fryxell FRY lit DV 708.00 19.0 20.0 1.0 0.1 1.3 172 23 42 108 640 40
L. Burgess BUR ds LH 4.00 40.0 16.0 0.3 0.0 0.1 28 2 2 3 44 5
Fold L. FOL lit LH 0.27 30.0 1.0 0.6 0.1 0.4 180 8 8 17 303 34
- GE2 lit LH 0.25 65.0 1.0 0.6 0.0 0.1 31 1 2 3 55 9
- GRO ds LH 3.50 50.0 16.0 0.2 0.0 1.4 530 18 47 63 860 195
L. Jack JAC lit LH 4.20 85.0 2.0 0.5 0.0 0.1 19 0 1 2 25 4
L. Sibthorpe SIB lit LH 12.50 60.0 0.7 1.0 0.0 0.1 25 6 1 3 38 5
- L52b lit LH 0.45 80.0 1.0 0.5 0.0 0.1 40 1 3 5 67 9
- L67 ds LH 4.50 45.0 5.0 0.5 0.0 0.9 310 10 21 32 481 60
Long L. LON ds LH 5.00 80.0 11.0 0.2 0.2 0.1 25 1 1 3 41 5
- MAN lit LH 0.42 30.0 1.0 0.1 0.0 0.2 51 3 4 8 108 20
Pup Lagoon PUP ds LH 1.00 5.0 4.6 1.1 0.1 0.5 190 10 15 18 277 55
L. Reid* REI1 unknown LH 5.50 30.0 3.8 0.7 0.2 4.1 1900 58 50 176 2660 105
REI2 ds
Sarah Tarn SAR ds LH 1.00 75.0 2.5 0.5 0.1 14.0 6200 160 193 824 10400 480
- R02 lit RI 2.53 10.0 3.0 0.0 0.0 140.0 63000 1234 350 5600 113270 2790
- R05 lit RI 4.30 2.0 4.0 0.0 0.0 100.0 42000 1149 450 3768 62230 6650
- R07 lit RI 1.09 15.0 1.5 0.0 0.1 24.9 10000 213 93 351 10350 8420
- R08 lit RI 1.09 18.0 1.0 0.0 0.0 4.6 1200 49 29 137 2380 1040
ACE2 ds ACE3 ds ACE4 ds ACE5 lit Ekho L.* EKH1 ds VH 44.40 0.0 39.0 0.1 0.4 52.0 13210 1940 430 3360 26100 1975 EKH2 ds Highway L.* HIW1 ds VH 20.00 8.3 17.4 1.6 0.2 2.5 510 43 26 97 940 105 HIW2 ds HIW3 ds HIW4 ds - PEN1 ds VH 16.00 3.0 18.4 2.9 0.6 13.6 4250 296 178 870 7400 1320 PEN2 lit PEN3 lit Watts L. WAT ds VH 38.00 0.0 29.5 0.1 0.2 2.3 610 105 25 215 1200 187
Table 2: Primers used in this study. R (reverse) and F (forward) designations refer to the primer orientation in relation to the rRNA. W indicates
an A/T nucleotide degeneracy.
Primer Sequence (5’ – 3’)
universal eukaryote forward (Van Hannen et al. 1998) CGCCCGCCGCGCCCCGCGCCCGGCCCGCCGCCCCCGCCCCTCTTGTGATGCCCTTAGATGTTCTGGG universal eukaryote reverse (Van Hannen et al. 1998) GCGGTGTGTACAAAGGGCAGGG
16S378F (Nübel et al. 1997) GGGGAATTTTCCGCAATGGG
16S781R(a) (Nübel et al. 1997) CGCCCGCCGCGCCCCGCGCCCGTCCCGCCGCCCCCGCCGACTACTGGGGTATCTAATCCCATT
16S781R(b) (Nübel et al. 1997) CGCCCGCCGCGCCCCGCGCCCGTCCCGCCGCCCCCGCCGACTACAGGGGTATCTAATCCCTTT
16S784R (derived from Nübel et al. 1997) GGACTACWGGGGTATCTAATCCC
Figure legends
Fig. 1: The studied lakes in the Larsemann Hills, Vestfold Hills, Rauer Islands, Bølingen Islands, and the McMurdo Dry Valleys. Inset shows a
map of Antarctica with the study regions in the Prydz Bay area and the McMurdo Dry Valleys.
Fig. 2: Principal component analysis (PCA) of the studied lakes showing the inter-regional differences in limnology and the structuring role of
conductivity and morphological related variables, which account for a large part of the environmental variation in the dataset. White squares: the Bølingen Islands, black triangles: the Larsemann Hills, white triangles: the Dry Valleys, white circles: the Rauer Islands, and black diamonds: the Vestfold Hills. For a key to the lake names and environmental variables the reader is referred to Table 1.
Fig. 3: Correspondence analysis biplot showing the variation in the presence-absence of DGGE bands obtained using the cyanobacteria specific
primers, with the significant geographical (V2 and V3) and environmental variables plotted as supplementary variables. Symbols are as in Fig. 2. For a key to the lake names and environmental variables the reader is referred to Table 1.
Fig. 4: Correspondence analysis biplot showing the variation in the presence-absence of DGGE bands obtained using the universal eukaryote
primer, with the significant environmental, geographical and seasonal variables selected in the variation partitioning analysis plotted as supplementary variables. Symbols are as in Fig. 2. For a key to the lake names and environmental variables the reader is referred to Table 1.
Fig. 5: The amount of variation in the taxonomic structure of the eukaryotic (A) and cyanobacterial (B) communities uniquely explained by the
geographical, local environmental and seasonal variables and the overlap between the different fractions as assessed using variation partitioning analysis.
Fig. 2: