Physïcalia Mag. 9 (1987) 175
SUPERNOVA
I987A IN THE LARGE
MAGELI-ANIC
CLOUD:
AN OBSERVATIONAL
OVERVIEW
Jean Surdej
tnstitut d'Astrophysique, Université de Liège
Abstract
Since the discovery, last February 24Ib, of the explosion of a bright supemova in the farge
Magellanic Cloud, a real euphory has developed
in the astronomical community. Indeed, such a
cataclysmic
event, visible with the naked eye, is likely to occur no more than once every two
hun-dred fifty years and it has provided particle physicists with the first detection of extragalactic
neutrinos that were emitted during the core collapse of a massive star. SN 1987a has also given
astronomers the unique opportunity to probe spectroscopically the interstellar and intergalactic
media over a distance of 165,000
light years. Furthermore, theoreticians
are now trying to recgncile
the multi-wavelength observations (visible, I-R, radio, X-ray, 1-ray) presently available for SN
1987a with their models of stellar evolution just before and after the fatal explosion. We present
in this article an overview of the main observations
and results obtained so far and we discuss
the
plans for future observations.
l. SN 1987a ..j e very unexpected event
From the statistics of supernova events that have been observed in a large sample of extemal gal-axies we know that, within a lapse of 1000 years, approximately four galactic supemovae should become visible to a naked eye terrestrial observer. It was therefore a great surprise for the astro-nomical community to receive on 24February 1987 atelegram from the Intemational Astroastro-nomical Union (hereafter IAU; directly followed by the IAU astronomical circular n' 4316) announcing that
a naked eye supemova of apparent visual magnitude mu - 4.5 had been discovered in the Large Magellanic Cloud (l,MC) (see Figs. I and 2) during the night of 23-24 February.
Three independent discoveries of the first supernova of the year 1987 (therefore desigrated SN
1987a) are reported in the circular n" 4316. The supemova has been identilied by Ian Shelton
(as-tronomer at the University of Toronto station located at the l,as Campanas obsewatory in Chile)
on 24 February at 5.5h UT (Universal Time) on a 3hr-exposure
photographic plate taken with a
25 cm astrograph. SN 1987a
was visually sighted on the same night by Oscar Duhalde (niCht
":-sistant at the american observatory of l,as Campanas) and by Albert Jones (amateur astronomer
in Nelson, New Zealand) at 4.8h and 7.9h UT, respectively. The apparition of SN 1987a
consti
tutes â very unique event since it is the brightest supernova to be observed since 1604 and because
the supemova rate in the LMC has been estimated
to be about I per 500 years. The supernova
that
was seen 383 years ago appeared
in the constellation Ophiuchus, towards the center ofour Galaxy,
at an approximate distance of 30,000 light years. Observations
of SN 1604 have been described
by
Kepler and other contemporary astronomers
who did not dispose yet at that time of any telescope.
176
S u p e r n o v o 1 9 8 7 0 i nI
LMC
FIE'rr
2t,ooo
l.v.
T h e E q r t hâ lro,ooo
r y
\
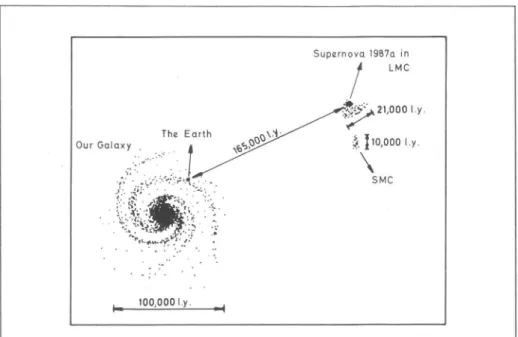
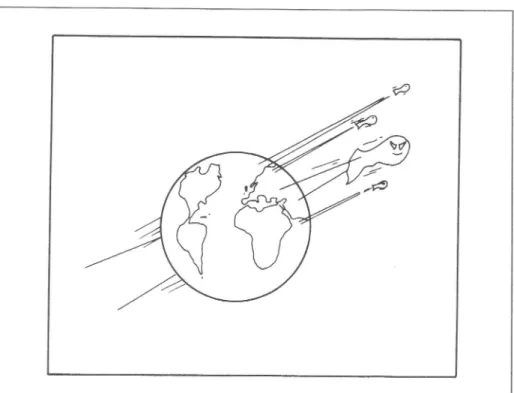
S M C O u r G o l o x y ' . . ! 'Figure l: Schematic position of supernova 1987a in the Large Magellanic Cloud (LMC) The star explosion that led to the sighting of SN 1987a in the LMC took place during the night of 23-24 February 1987. The LMC and the Small Magellanic Cloud (SMC) âre two dwarf satellite galaxies of our Milky Way, located at an approximate distance of 165,000 light years. Since the light emitted by the supernova travelled during 165,000 ye,rs, we see this cataclysmic event in the LMC as it happened well before the apparition of the Homo Sapiens on Earth. Both the LMC and SMC are naked eye visible galaxies in the sky of the southem hemisphere.
liigurc 2: The l,arge Magcllanic Cloud (LMC) and SN 1987a
'I'his picture (originally in color) of the LMC was obtained on 25 February 1987 at l.0h tJT, i.e. approximatcly two days after the supemova explosion. It was taken by Claus Madsen at the Iiuropean Southem Observatory with a Hasselblad camera and 6X6 cm Agfachrome 1000 RS emulsion. 'I'he exposure timc was 20 m'in. The supemova is clearly secn at a magnitude m, - 4.5 to the left of the centre and above the I-MC main body, as the lower right of the two bright objects. The sccond bright and dilïuse object is the'I'arentula nebula, a giant region of hydrogen that is ionized by a cluster of stars in formation. (liSO Courtesy)
I m m e c l i a t c l y a f t e r t h e d i s c o v e r y o f S N l 9 S T a , m o s t o f t h e r a c l i o a n d o p t i c a l t e ' l e s c o p e s l o c a t e d s o u t h of the equator started monitoring this rapidly evolving object. Ry chance, several photographs of the LMO had been taken at various observatories just before and after the supernova event. 'Ihe
locati<>n of this bright supernova in thc L,MC may be very wcll seen in Fig. 2. Fig. 3 illustrates
with more dctails the region of the sky near 30 Doradus as it appeared ten years before and thrcc days after the explosion of SN 1987a. These photographs werc taken at the F,uropean Southem Obscrvatory (lrSO, see the appendix at the end) in Chile.
Figure 3: Imnrediatc surroundings of SN 1987a beforc and aftcr the expl<xion
'l'his pair of photographic plates obtained with the ESO schrnidt telescope illustrates the sud-den apparition of SN 1987a in the I-MC. T'he left (and right) plates were taken by FI.E. Schuster and O. Pizarro (G. Pizano) on a Ila-O emulsion plus U(il (GG385) filters during 60 (15) min on 9 December 19'l'l (26 February 1987 at lh25m U'I'). 'I'hc exact position of the progenitor of SN 1987a is indicated by an arrow on the left hand side picture. Between the two epochs when these photographs were made, the brightness of SN 1987a has increased by more than a factor 1500. It has also been possible to find that this abrupt change in luminosity took place in less than 24 hours. Note that the cross seen around the bright star image on the right hand side picture arises because of dillraction of light from the supcrnova by the plateholdcr support inside the Schmidt telescope. (llSO Courtesy)
2. The progcnitor ofSN 1987a
We are very fortunate that SN 1987a exploded in the I-MC. Indeed, since we may reasonably
assume that all stars belonging to the LM(1, ancl which are reccding from us with an average vc-locity of 260 km/sec, are located at a same distance d= 165,000 * 10,000 light years, we conclude that SN 1987a is located at that same distance of our Solar Systcm.
Figure 4: Thc progenitor of SN 1987a
The star that exploded on 23 February 1987 in the LMC is well identfied on this photograph obtained in red light with the ESO 3.6m telescope on 6 December 1979. lt was catalogued by
S a n d u l e a k i n 1 9 6 9 a s a n O B s t a r o f l 2 t h m a g n i t u d e a n d g i v e n t h e d e s i g n a t i o n - 6 9 ' 2 0 2 . O b
-servations at the European Southern Observatory in the mid-1970's allowed to classify it as of
spectral type B3I, that is a star having an elïective temperature I'"ff - 15,000"K , a radius
R - 3l0t'cm,aluminosityL - l . 3 l f f l " a n d a m a s s M - l s M o . C l o s e r i n s p e c t i o n o f t h i s
star irnage has however revealed that two stellar companions were located very nearby. On this photograph, the image of Sanduleak -69"202 is somewhat elongate<l towards the northwest, since one of the companions (m, - 15.3) lies in that direction at a distance of 2.6". A third s t a r ( m n - 15.7)wasalsofoundtobepresentatonlyl.4"southeastof Sk-69"202. Notethat the stellar images seen on this picture are very close to the edge of the plate and are therefore somewhat elongated, due to less than optimal optical adjustment. (ESO Courtesy)
We can therefore plot in a diagram representing the absolute magnitude versus temperature (or spectral class), also known as the famous Hertzsprung-Russel diagram, each individual star of the LMC, including SN 1987a and its progenitor. We recall that in such an I{-R diagram, the stars are not distributed at random but follow distinct evolutionary tracks that are iust a function of the
itial conclitions (mass, chemical composition, etc.). If we could iclentify the progenitor of SN 1987a, we woulcl therefore have a vtlry unique opportunity to understand what the late stages of evolution <rf a massive star are. A very good progenitor candidate has soon becn identified with a 12.2
mag-nitudc hot supergiant star known as Sk -69"202. Close examination of earlier photographs
re-veafcd that this star had two close companions locatcd at respcctively 2.6" and 1.4" (see Fig. 4). Very accurate astrometric measurements of SN 1987a and ,S& - 69'202 indicate that their positions coincide to an accuracy better than 0.1". Furthermore, spectroscopic data obtained in early April with the International Ultraviolet F,xplorer (IUE) satcllite clearly show that the two nearby com-panions of Sk - 69"202 arc still thcre and that the latter has in fact disappeared. After several hesitations, there is now a general consensus that it must havc bcen Sk - 69'202 that exploded.
IIowever, nobody really expected the progenitor of SN 1987a to be a blue supergiant. Indecd, accorcling to stanclard models of stellar evolution most of theorctical astrophysicists had predicted
that massive star progenitors of supernovae aliJ<e SN 1987a should evolve to red supergiants prior
to the ignition of core carbon buming and thus should subsequently explode as red supergiants. T'heoreticians arc therefore confrontcd with the puzzle of how to cxplain that a blue supergiant star could explode into a supemova.
3. The birth of a supernova or the death of a massive ster
Supemovae are generally divided into trvo mair classes, I ancl Il. 'Iype I supernovae are observed
in spiral, elliptical and irregular galaxies (cf. the LMC). They are thought to relate to the
thermonuclear explosion of a white dwarf in a close binary system (see Fig. 5). It is important to note that no hydrogen lines are seen in the spectnrm of a type I supernova. I{owever, strong hy-drogen Balmer lines were soon detected in the spectrum of SN 1987a and these are typical of type II supemovae. It is generally accepted that a type lI event corrcsponds to the explosion of a very massive, short-lived star whose core collapses after it has completely exhausted its supply ofnuclear fuel (see Fig. 6). kt us now compare the observations of SN 1987a with those expected from a type II supemova.
4. Photonrctric and spectroscopic observations of SN 1987n
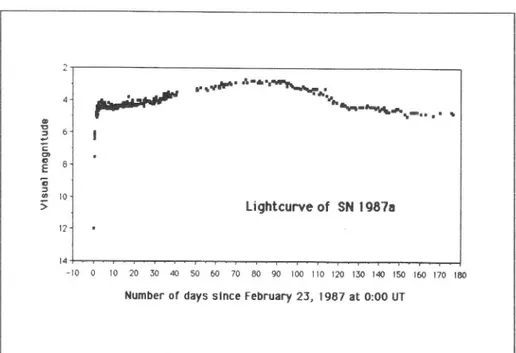
Because of the very rapid evolution of both its liglrtcurve and its spectrum, SN 1987a appears to be a very peculiar type II supemova. Fig. 7 illustrates the visual lightcurve of SN 1987a during approximalely half a year since its discovery.
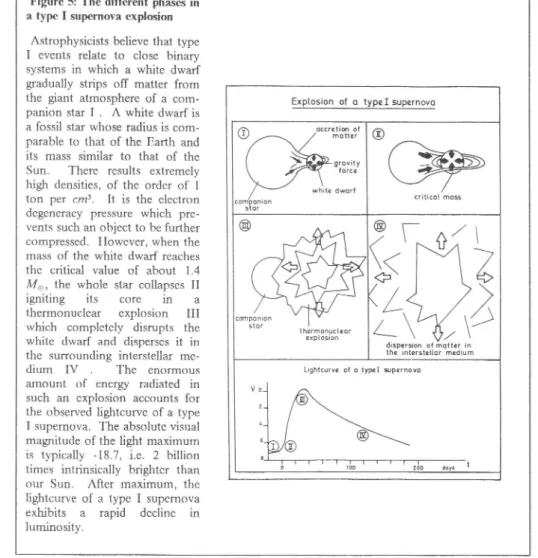
Figure 5: The different phases in e type I sup€rnova explosion
Astrophysicists believe that type I events relate 1o close binary systems in which a white dwarf gradually strips off matter from the giant atmosphere of a com-panion star I . A white dwarf is a fossil star whose radius is com-parable to that of the Earth and its mass similar to that of the
Sun. There results extremely
high densities, of the order of I lon per cm3. It is the electron degeneracy pressure which pre-vents such an object to be further compressed. Ilowever, when the mass of the white dwarf reaches the critical value of about 1.4 M", the whole star collapses II
igniting its core in a
thermonuclear explosion III
which completely disrupts the white dwarf and disperses it in the surrounding interstellar
me-dium IV The enormous
amount of energy radiated in
such al explosion accounts for the observed lightcurve of a type I supemova. The absolute visual magnitude of the light maximum is typically -18.7, i.e. 2 billion times intrinsically brighter than our Sun. After maximum, the lightcurve of a type I supernova
exhibits a rapid decline rn
luminosity.
Explosion of o typel supernovo
/ ? \ o c c r e t i m o f \l/ ^ / moll.r
eb
/
@ F -
/ / \
, / \
A ' ,
\
\< >ï -7
Ê ) l
\ 8
, / < / )
îrW Q
\ v / \
d i s p . r d o n o f m o t t . r i n t h s i n t c r s t . t l d r m . d i u m L i g h t c u r v c o l o t y p e l $ p . r n o v oFrom these as well as from additional published data, the following anomalies are noted:
(i) Following the core collapse that occured on 23 February at 7h35m UT (a neutrino signal was detected at that time), the rise in brightness of SN 1987a has been extremely steep. A fust visual light maximum was already reached on 28 February when the shock wave hit the photosphere of the star. Ilowever, the luminosity of this peak is found to be approximately 7 times fainter than that expected from a standard type II supemova. Irurthermore, the ultraviolet radiation of SN I987a has decreased by more than a factor 1000 in less than three days; duringthat time, the object was brightening in the red and infrared.
Figure 6: The difierent phases in a type II supernove explosion
It is well known that during the evolution of a star, light elements are transformed into heavier ones in its central core. These nuclear reactions actually supply the en-ergy radiated by the star and they also provide the radiative and gaseous pressures needed to bal-ance the inward force of gravity. At the end of its evolution, the stellar core has exhaustecl most of its supply of nuclear fuet: all hydrogen atoms have been trans-formed into helium ones,
fol-lowed by the transmutation of
helium into carbon and oxygen, etc., until a last chain of nuclear reactions fuse, in less than one day, the sil-icon atoms into iron ones. At this stage, the star looks like a stratified ball made of a central iron core surrounded by various shells of elements whose atomic weight decreases outwards (silicon, ..., aluminium, ...,
hy-drogen) I Under the normal
conditions of temperature and pressure prevailing in stellar inte-nors,
the physical strlrcture of the iron atorns prevents these from fusing into heavier elements. The supply of nuclear energy is totally exhausted and the star cannot support any longer its own weight. In less than a second, the stellar core collapses II. If the initial mass of the star is not too large -of the order of one solar mass- this cataclysm leads to the formation of a planetary nebula with a white dwarf in its center. It is very probably along these lines that our Sun will end its evolution in approximately 5 billion years. If, however, the mass of the progenitor is as large as 7 M, or more, the collapse of the iron core will be so violent that even the electron
degeneracy pressure will not be able to stop the rapid implosion. Very suddenly the protons
in the stellar core capture electrons to form neutrons, very encrgetic neutrinos and antineutrinos are emitted at this same time, ... a neutron star has been formed. The radius of such a star does not exceed a few tens of kilometers but its volume density is as high as tcn million tons per cubic centimeter. Due to the strong mutual repulsion of the neutrons, this star cannot be fur-ther compressed I for progenitor rnasses greater than 30 M (, , thc on-going implosion would lead to the formation of a black hole l. A tremendous shock wave retrounds then from the neutron core in a huge explosion that swèeps out all extemal shells of stellar material III . Expansion velocities up to 30,000 km/sec have been measured from the P Cygrli profiles obsen'ed for the hydrogen Balmer lines in the spectrum of SN 1987a. læt us note here that in the early phase ofthe explosion, the temperature and pressure are so extremely high that elements heavier than iron (e.g. uranium, nickel, etc.) may be synthesized. lt is cven generally thought that all such heavy elements found on Earth must have been synthesizecl during the explosion of one or more nearby supernovae. In this context, our Sun appeârs to be a second or even third gener-ation star, bom from the dispersed ashes of a supemovâ IV . 'l'he absolute visual magnitutle
characterizing the light maximum of a type II supernova is about -16.3, i.e. - 10 times less
luminous than a type I maximum. The post-maxirnum decline of a type II lightcurve is
how-ever not so steeD.
Explosion of o typel[ supernovo
o l l n u c l c o r f u c l h o s becn.xhoust.d baginning of core cotrdpsc nautton stoa L i g h i c ù . v e o f o t y p e I I s u p e r n o v o
LBz
o E -t o
É
oi e
o J o l 0p.ir*,l'
si{Ë..1'-1'il\^rr
rr-hu5a.-....
r
Lightcurve of Sl{ l9E7a
12 t 4 l0 20 50 40 50 60 70 ô0 90 t00 1t0 120 t30 t40 l5o 160Number
of days slnce February 23, l9A7 at 0:0O UT
Figure 7: Lightcurve ofSN 1987e
This figure represents the apparent visual magnitude of the supemova against the observing time. Most of the measurements were taken from the IAU astronomical circulars published between 24 Febnary and 17 August 1987.
(ii) As early as two days after the explosion of Sk -69"202, very broad P Cygni profiles were
detected for the hydrogen lines of the Balmer series in the spectrum of SN 1987a (see Fig. 8). As mentioned previously, unusually large expansion velocities of stellar material up to 30,fiX) km/sec were measured.
In order to account for the rapid development of the lightcurve of SN 1987a, theoreticians pro-posed that the progenitor had to be an object much more compact than a canonical red zupergiant star. In addition, a progenitor with a high-density atmosphere akin to that of a blue supergiant would ensure a larger fraction of the energy released by the explosion to go into expansion of its atmosphere, rather than being radiated in the electromagretic spectrum. This is exactly what has been observed for SN 1987a. Evaluation of the kinetic energy of the expanding envelope amounts
to - lffr erg, whereas the light output radiated so far has been estimated to be - 104 erg in the
visible and - lU1 erg in the ultraviolet. Such a scenario also accounts for the low luminosity of
the visual maximum observed five days after the explosion of Sk -69"202. læt us note here that
the rapid decline ofthe ultraviolet radiation and brightening at longer wavelengths were caused by the fast cooling - and associated line blocking - of the rapidly expanding atmosphere (see Fig. 9).
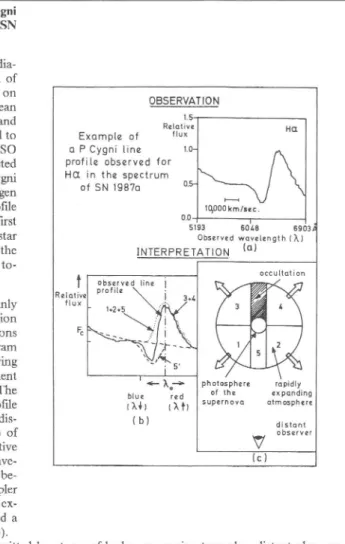
Figure 8: Example of a P Cygni
line profile in the spectrum of SN
1987a
We have reproduced in this
dia-gram (a) part of the spectrum of
SN 1987a that was observed on
27 February 1987 by european
astronomers using a Boller and
Chivens spectrogaph attached
to
the Cassegrain
focus of the ESO
3.6m telescope. The selected
spectral range shows a P Cygni
profile due to the 1/o hydrogen
Balmer line. This type of profile
has been observed for the frst
time in the spectrum of the star
P Cy$i, an old nova of the
XVIIth century, still subject
to-day to important mass losses.
A P Cygni line profile is mainly
composed
of a central emission
component (cf. the contributions
1 + 2 + 5 a n d 3 + 4 i n d i a g r a m
(b)) bordered on its violet wing
by an absorption component
(contribution 5' in (b)). The
formation of such a line profde
essentially results from a
redis-tribution in wavelength ( I ) of
photons emitted in a radiative
line transition (cf. the rest
wave-length I, : 6563 A for 11o)
be-cause of important Doppler
effects caused by the rapid
ex-pansion of an envelope around a
central object (see diagram (c)).
In this model, line photons emitted by atoms of hydrogen moving towards a distant observer (cf. the regions 1, 2 and 5 in (c)) give rise to the formation of a blue emission component. Similarly, the emission of photons by atoms which recede from a distant observer (cf. the re-gions 3 and 4 in (c)) accounts for the red emission component. Finally, the absorption of the photospheric continuum of the supemova by atoms located between the stellar disk and the observer (see region 5 in (c)) leads to the formation of a blueshifted absorption component.
We have also indicated with a bar in diagram (a) the spectral interval coffesponding to a I)oppler shift of 10,000 km/sec. Dividing by two the Doppler width of the observed profile in (a), one may derive that the expansion velocity of the envelope around SN 1987a was greater than 18,000 kmlsec on 27 February. A more detailed analysis of such line profiles recorded in the spectrum of SN 1987a should allow one to derive the physical conditions (temperature, density) prevailing in the expanding envelope as well as the type of velocity distribution and the mass of the ejected atmosphere.
E x o m p t c o f r l u x o P C y g n i l i n e l . p r o f i t e observed for H(I 1 q 0 0 0 k h / s . c H O i n t h e s p e c t r u m o f S N 1 9 8 7 o O b s e r v e d wovclength (À) I N T E R P R E T A T T o N {o ) P h o t o s p h e r . r o p i d l y o f t h e . x p o h d i n g s u p a r n o v o q t m o s p h a r c
1 8 4
ESO 1.0m CVF
3 S N 1 9 8 7 4 M a r l è0 o 1- 1 2
Log ltavelength Figure 9: The composite spectrum ofSN 1987aThis frgure illustrates the composite spectrum of SN 1987a as observed in the far ultraviolet with the IUE satellite, in the visual with the ESO 3.6m telescope and in the infrared with the ESO lm telescope plus infrared scanner, on I March 1987. lVhereas the visual and infrared parts ofthe spectrum are nicely fitted by a black-body curve at a temperature of 5800'K, there is a significant departure in the ultraviolet due to light absorption by resonance and low excitation lines from singly ionized elements (FeII, SiII, etc.). Spectral lines of various elements
are seen as peaks or discontinuities in the photospheric continuum. By the end of June 1987,
the expanding envelope was getting larger and cooler ( 7 - 5000'K ). There were also signs of an excess of light radiation in the far infrared ( T - 1200"K ). It is not clear whether this IR excess is due to free-free emission from an ionized envelooe or to an infrared echo resultine
from the reprocessirg of the initial burst of optical and Uv'light by circumstellar dust graini
located several light months away from the supemova. Note that in this figure both the
wavelength scale, in nm, and the ordinate axis, in units of ergcm 2s-tnm t, are logarithmic (from a paper by Daruiger et al. 1987, Astronomy and Astrophysics, 177, I-13).
Meanwhile, analysis of pre-outburst direct photographs and objective prism spectra of
Sk -69"202 have brought interesting new results. First ofall, no evidence was found for significant photometric variabfity or spectroscopic activity (no emission lires were detected) of this star during the last decades. A conspicuous nitrogen absorption line has however been identi{ied in the spec-trum of the progenitor. Spectral analysis of other blue supergiants in the LMC also indicates that some of these have abnormally high abundances of heavy elements (He, N, etc.), as in highly evolved post red giant objects. It therefore seems very plausible, on observational grounds, that Sk -69"202 has become a red supergiant before evolving into a blue one. Independently, theore-ticians have recently shown that models of a massive star ( - 15 - 20 M o ) with reasonable mass loss and a low metallicity, such as the one characteiz.ing the l,MC (about one quarter of the solar
value), naturally lead to a blue supergiant as the progenitor of a type I[ supernova. These models also predict that the frequency of red supergiant stars shoulcl be higher in the LMC than in our Galaxy, in good agreement with existing observations.
Another very unexpected feature of the visual lightcurve of SN 1987a is that after reaching a first maximum on 28 February, its brightness dropped slightly but rose again after 5 March during
aI-most three months. The brightest apparent visual magnitude of SN 1987a reached a maximum
around 24 May; it was then a bright 2.8 mag. object in the southem sky. Since the radiative energy powered by the explosive shock wave has been released within the fust few days, another source of energy is required in order to produce the increasing light output observed between 5 March and 24 May. Astrophysicists have proposed that this excess of light radiation could be due to the energy liberated by the radioactivity of unstable isotopes synthesized in the early phase of the explosion. It has been estimated that the production of less than 0.1 M
^ of Ni36, decaying to Co56 which in tum
decays to the stable isotope Fe56 , would suffrce to reproduce the observed lightcurve of SN 1987a. 'l-his in tum is found to be in goocl agreement with current models of explosive nucieosynthesis. y -ray âstronomers are constantly monitoring SN 1987a with the aim of detecting the first escaped energetic y-rays that should accompany the decays of Nis6 and Car6 . Until now, all attempts have failed but this is not surprising since the 1-ray opacity of the supemova atmosphere is expected to be high at early times. Others have suggested that the excess of visible light radiation might be caused by the recombination of electrons and ions in the ejccta of the progenitor that are enriched in heavy elements (N, O, etc.). Finally, it has also been proposed that a central energy source powered by a rapidly rotâting neutron star with a period as small as about l0 milliseconds could
be responsible for the observed behaviour of the lightcurve. Such an hypothetical pulsar would
generate relativistic electrons emitting a powerful synchrotron radiation as they get accelerated in strong magnetic fields. Fast photometry of SN 1987a has already been carried out at various ob-servatories with no positive detection ofoptical pulses. Ilowever, ifsuch an object does really exist, it is very l-ikely that the opaque expanding atmosphere will first become transparent to X-ray and radio pulses. Because SN 1987a is a very peculiar type II supernova, it is not easy to predict when we shall be able to see what is left over at the centre of the cxplosion. The reported detections of neutrinos from the core collapse of Sk -69'202 probably constitute the best presently available evidence that such a neutron stâr mav exist in the centre ofSN 1987a.
5. First detection of extra-solar neutrinos
As already mentioned in Section 3, theoreticians had predicted that a strongemission of neutrinos and antineutrinos should have taken place during the neutronization (p+e + v" + n) of the iron core of Sft - 69"202. It was therefore a great news when a group of italo-sovietic physicists reported in the IAU astronomical circulars n" 4323 (28 February 1987) and n' 4332 (6 March) that a signal from the LMC had been detected on 23 February at the Mont Blanc Neutrino Observatory. The neutrino telescope is located in the Mont Blanc tunnel between France and Italy and is made of a Iiquid scintillator shielded with very heavy iron slabs from the cosmic ray backpgound. T'he signal
consisted of five pulses, above the 7 MeV energy threshold over an interval of ? seconds starting at 2h52m37s UT. The european physicists estimated that the probability of a random occurence with SN 1987a was I such event per 10,000 years. However, a great surprise came when another team of japano- american particle physicists announced in the IALJ astronomjcal circular n" 4338
(10 March) that the Kaniokande-Il experiment observed an electron neutrino (antineutrino) I
burst from SN 1987a on 23 February at 7h35m35s + I min; that is more than four hours later than the detection at Mont Blanc. The signal consisted of I I neutrino (anti-neutrino)- produced electron (positron) events in an underground water Cerenkov imaging detector located deep in a zinc mine at Kamioka, in Westem Japan. The events were observed during an interval of 13 seconds and the measured electron (positron) energy interval was from the 7.5 MeV threshold to 36 MeV. Another
very important result came from the lrvine-Michigan-Brookhaven (IMB) collaboration who
rc-ported in the IAU astronomical circular n" 4340 (11 March) that a signal was observed in data from a nuclear decay detector installed in a salt mine under the shore of lake Erie near Cleveland. Ohio. on 23 February at 7h35m4ls UT; i.e. coincident with the Kamiokande-Il detection. Eight events were recorded in a 6 seconds interval, five of them during the frst two seconds. The energr of these events was confined in the 20-40 MeV range. The IMB experiment also consists of an imaging
water Cerenkov detector (see Fig. l0). The Kamiokande-ll and IMB detections of neutrinos
and/or anti-neutrinos from SN 1987a have further been confirmed by the observation of 5 events above a 5 MeV threshold within a lapse of 9.1 seconds at the Physics l,aboratory of Baksan in Soviet Union. 'I'hough this detection took ptace some 20 seconds later than those reported in
Kamiokande-Il and IMB, soviet scientists believe that this rnight be due to a timing problem.
Physicists have estimated that the capacity of detecting neutrinos at the Mont Blanc Observatory is about twenty five times less than that of Kamiokande-Il and therefore, the non-detection of neutrino events at 7h35m UT with the Mont Blanc experiment is in perfect agreement with the other data. Nevertheless, it cannot be easily understood why the Kamiokande-Il and IMB exper-iments did not confrrm the Mont Blanc observation made four hours and 43 minutes earlier.
The neutrino observations reported by Kamiokande-Il and IMB indicate that SN 1987a must have
radiated approximately 3 lS3 erg in the form of three different llavors of neutrinos and
anti-neutrinos. This number is in excellent agreement with the theoretical estimate of the energy that is released from the gravitational binding energy of a 1.6 M. stellar core that is transformed into a neutron star. læt us note here that only about I percent ofthis released gravitational energr is used for the expansion of the stellar ejecta and that only 0.01 percent will be radiated in the form of visible and ultraviolet light photons (cf. Section 4).
I It is believed that there exists lhree different flavors ofneutrinos (electron, muon and tauon) and that each
type has an antiparticle. At the energies of supernova explosions, lhe terrestrial detectors are however
more seositive to electron antineutrinos, then to electron neutrinos. a.s.o.
Figure l0: Ghæt elementery particles called "neutrinos"
on 23 F-ebruary 1987, around 7h35m ur, each of us has been crossed by approximately one
million of billion neutrinos and antineutrinos emitted in the explosion of SN- i987a. However,
none of us could have noticed it because
the probability of inÎeraction of one such a particle
with the atomic nuclei of our human bodies ii exceedingly
small. It has been estimated that
only- o.ne.among all neutrinos that have passed through more than one thousand people on
Earth had a chance of interaction. Most olthese glrost particles have literally crossed thiEarth
without noticing its presence. Therefore, Neutrinô Obsèrvatories
consistinebf enormous tanks
of,purified_
water or liquid scintilJator surrounded by thousands of very sénsitive detectors of
light have been constructed deep in mines. For a terrestrial observer, thé flux of neutrinos from
SN l9-87a
was.typically l0r0 electron antineutrinos per cmz of which only about two tens have
been detected
by Neutrino Observatories.
The neutrino observations of SN 1987a therefore indicate that the current standard model of supemova explosions involving core collapse is essentially correct. Since the neutrino detections were all reported several hours before the observed rise in light ofSN 1987a, these also support the idea that the neutrino particles have necessarily travelled the long distance of 165,000 light years at a speed comparable to that of light. In accordance with the special relativity of Einstein, this im-plies that the rest mass of the electron neutrino and antineutrino must be extremely small. Using the expected anti-correlation between the arrival time and energy of the detected neutrinos, upper limits of about 15 eV have been derived for the rest mass of the electron neutrino and antineutrino2 . l,et us remark that a zero rest mass is also consistent with the obseryations. Fur-thermore, one cafl also certify that, in the reference frame of a terrestrial observer, the neutrino lifetime is greater than 165,000 years. As a consequence, it results that the deficiency of the flux
of solâr neutrinos observed on Earth cannot be caused by the decay of these particles on thcir rvay from the Sun to the Earth.
We conclude that the detection of neutrinos frorn SN 1987a constitutes an unprecedcnted achievement in our understanding of particle physics and supcrnova explosions. 'fhis grcat succcss has alrcady led to decisions of buiJding up in the near futurc super-observatories of ncutrinos.
Ncutrino aslronomy was really bonr on 23 February 1987.
6. SN 1987a a^s a light probe of the intervening mediunr
With a visual magnitude record of m, - 2.8 , SN 1987a becamc the brightest object in thc LMC. It was over 10,000 times more luminous than the brightcst stars in the Clouds and one can even state that SN 1987a is the brightest object that has ever bccn observcd so near the doorstcp of our
Galaxy. It therefore turned out to be an idcal light source to probe the physical and dynamical
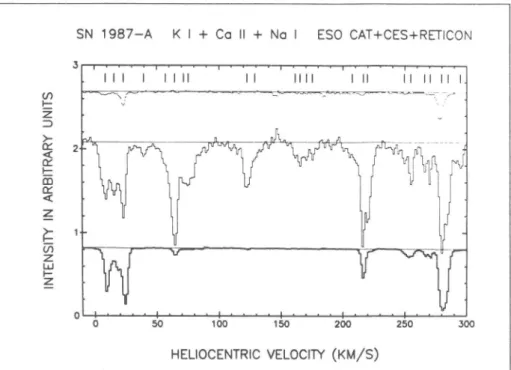
structures ofthe interstellar and intcrgalactic media located along a distance as large as 165,000 liglrt years. An impressive number of narrow absorption lines forrned in the interstellar medium of the l,MC and ol the Milky Way, in the halo of our Galaxy and in clouds of the intergalactic space have been detected in high resolution spectra of SN 1987a. T'hcse data were obtained rvith the Interna-tional Ultraviolet Explorer (lUE) satellite and with the Coudé Irchelle Spectrometer (CF,S) at the l.4m Coudé Àuxiliary'I.elescope (CAT) of ESO. Six multiple components of a Magnesium line (Mgl) and others due to Nickel (NilI), Zinc (ZnIl) and Silicon (SiIV) have been identified in the ultraviolct spectrum of SN 1987a. No less than 24 narrow absorption components due to a calcium line (CalI), l3 components associated with Sodium (Nal) and 2 with Potassium (KI) have been measured in the optical spectrum of SN 1987a (see [iig. I l). These observations serm to indicate that a real bridge of matter exists between our Calaxy and the LMC. It is also possible that some of the narrow absorption lines are associated with matter expelled from Sft - 69'202 cluring a phase of rapid mass loss, prior to the supemova expiosion. Finally, the briglrtness of SN 1987a has al-lowed astrophysicists to set a very secure upper lirnit on the concentration of the tracer isotope Li1 in the interstellar gas. 'I'his result is of great interest since thc observed abundance of Li1 does providc an impoftant constraint on the theories of primordial nucleosynthesis.
7. Latest news from SN 1987a
Adopting a distance to SN 1987a of 165,000 light years and an average velocity of 20,000 km/sec for the expansion ofits stellar ejecta, it is easy to estimate that within halfa ycar aftcr the explosion the hydrogen envelope should become observable frorn F,arth under an angular diameter of 80 milliarcsec.
2 Similar arBumenls have led particle physicists to state that the elecl.ric charge of the detected neutrinos
must be smaller thân about 10- l7 ti-". the charse of the clecl.ron
s N 1 9 8 7 - A
K l + c o l l
+ N o l
ESO
CAT+CES+RTTICON
HELTOCENTRTC
VELOCTW
(KMlS)
Figure ll: Interstellar lines in the spectrum of SN 1987a
Very high resolution spectra of SN 1987a have revealed the presence of numerous interstellar and intergalactic narrow absorption lines due to Potassium (KI; upper spectrum), Calcium (CaII; middle) and Sodium (NaI; lower). At the top, tick marks show the locations of the 24
interstellar absorption components detected in CaII. Their corresponding velocities may be
derived from the bottom scale. All those narrow lines are due to the absorption of the supemova light when the latter passes through interstellar clouds on its way to us. f)epending on the velocity of the cloud, the position of the line appears to be shifted differently in the spectrum because of the Doppler effect. The lines at low velocities (to the left) correspond to
clouds in the Milky Way; those to the right, above 250 km/sec, to clouds in the LMC. The
lines in between are thought to originate in a bridge of matter between our Galaxy and the
LMC. These spectra were obtained rvith the CES Reticon spectrograph fed by the l.4m ESO
CAT telescope (from a paper by Vidal-Madjar et al. 1987, Astronomy and Astrophysics, 1'l'1, L l 7 ) .
(n
Fz
lq z
<É.
b
(D
É.
z
a
z.
UJ Fz
| t
t | i l
|
l i l t
t i l
| i l | l
Resoiving such small separations rnay only be achieved by means of optical speckle interferometry or radio interferometric technioues.
Although, up to now, optical astronomers have failed to resolve a nebular disk around SN 1987a, a very interesting result has been announced in the IAIJ astronomical circular n" 4382. Indeed, high angular resolution speckle observations of SN |987a have shown at the end of March a bright un-resolved feature at 5? milliarcsec south of the supernova. This feature appears to be 2.7 mag. fainter than SN 1987a in a narrow bandpass centered on the /Ia hydrogcn Balmer line. -I'he nature ofthis bright object (moo - 6.8) remains unknown and it has therefore been named the "mystery spot". There is however no doubt that it must be physically related to the SN 1987a phenomenon.
Though a prompt but weak radio burst was delected at around lGHz during the frst days after
the explosion (cf. IAU astronomical
circular n' 4321), observations
carried out after July with a very
sensitive 275km interferometer in Australia have failed to detect any significant radio sigrral from
SN 1987a (cf. IAU astronomical circular n" 4432). The radio burst detected around 25 February
was very probably due to synchrotron emission from a thin shell of circumstellar material that
interacted with the outgoing shock wave. The weakness of that observed radio emission supports
the idea that the progenitor was not surrounded by a very dense shell of radio opaque gas as miglrt
have been expected for a red supergiant losing mass. Furthermore, althouglr type II supemovae
originating from red supergiant progenitors generally become luminous radio emitters several
months after explosion, it is believed that this should happen for SN 1987a
within about 30 years
from now when the shock wave will reach the red eiant wind shell at a distance of - 1018
cûr.
From early July onwards, astrophysicists observing with the IUE satellite have reported the
ap-pe€uance
of narrow emission lines in the ultraviolet spectrum of SN 1987a (cf. IAU astronomical
circulars n" 4410 and ,1435). They proposed that these spectral changes may be due to the thinning
out of the ejecta that are exposing the innermost and hottest layers. In this context, it is interesting
to note that polarization variations of the optical light of SN 1987a,
reaching
up to 3-4 percent,
have
been observed, suggesting some patchyness in the expanding shell. The IUE astrophysicists have
also proposed, as an altemative, that the presence of narrow lines apparently emitted by a
nitrogen-enriched gas may arise from circumstellar material being photoionized by the strong
UV-optical burst ( - 10Æ erg) that should have developed when the shock generated by the core
collapse reached the photosphere of the progenitor. In the latter case, a future interaction between
the expanding debris and this material sould lead to an emission of X-rays and radio waves due to
the turbulent acceleration of electrons.
Because
of the multitude of predictions that have been made for the future evolution of SN 1987a,
it has become very diffrcult to predict at all how the supemova will develop in the near future.
Numerous sensitive X-ray and 1-ray detectors on board satellites, balloons and planned rocket
Ilights as well as ground based optical, infrared and radio telescopes spread all over the southem
hemisphere are on stand-by waiting for the moment when the shock wave will collide with
circumstellar material or when the expanding atmosphere will get su{ûciently transpar€nt to unveil
either the products and radiation of the explosive nucleosynthesis
or the compact object left over
at the centre of the explosion. Whereas
there is no doubt that the discovery
and observational
study
of SN 1987a have already contributed very much to our understanding
of the fmal evolutionary
stage of a short-lived massive star, it is certain now that future observations will make this
achievement even greater.
'tti
çi ilt:i ,:::.t,
irt
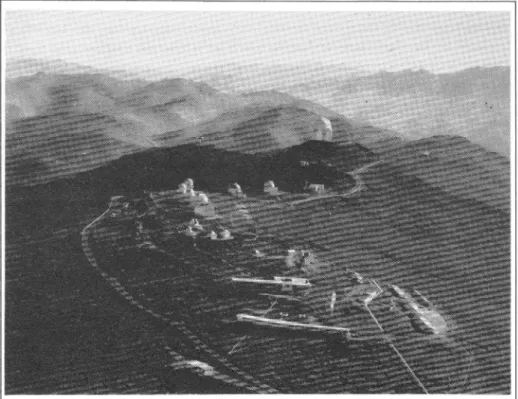
Figure 12: Aeriel view of the Europeen Southern Observatory Appendix: The European Southern Observatory
ESO, an intergovemmental European Organization, was founded n 1962 to establish and op-etate an astronomical observatory in the southem hemisphere and to promote and organize
cooperation in astronomical research in Europe. Its member states are Belgium, Denmark,
France, the Federal Republic of Germany, Italy, the Nethcrlands, Sweden and Switzerland. The observatory is located in Chjle, on l,a Silla, a mountain of 2,400 m altitude, 600 km north of Santiago. 'Ihirteen telescopes are at present in operation, and the largest instrument with a
diametet of 3.6m is one of the most powerful telescopes ir the world. Moreover, a l5m
submillimeter telescope entered into operation in early 1987 and a 3.5m New Technology Telescope (NTT) should be operational in late 1988. A Very l,arge Telescope (VLT), con-sisting of four 8m telescopes (equivalent âperture l6m) is being planned for the i990's. Six hundred astrophysicists make proposals each year for the use ofthe tclescopes at l,a Silla.
At the Duropean Ileadquarters near Munich (FRG), technical development progratnmes are carried out to provide the [^a Silla Observatory with the newest instruments. While the design of instruments is made at ESO, their construction is largely contracted to European industry. Also in the Headquarters there is the scientific and administrative centre of ESO, where exten-sive faci[ties enable european scientists to analyze their data. In addition, the European Space Agency (ESA) and ESO jointly operate the "Space Telescope European Coordinating Facility". In Europe, ESO employs about 150 intemational staffmembers, fellows and associates; at [,a Silla about 40 and, in addition, 150 local sta{T membets. We refer to the recent article in Ciel et Terre (Vol. 103, p. 43, 1987) by Jean-Pierre Swings for more details on the Iluropean Southem Observatory.