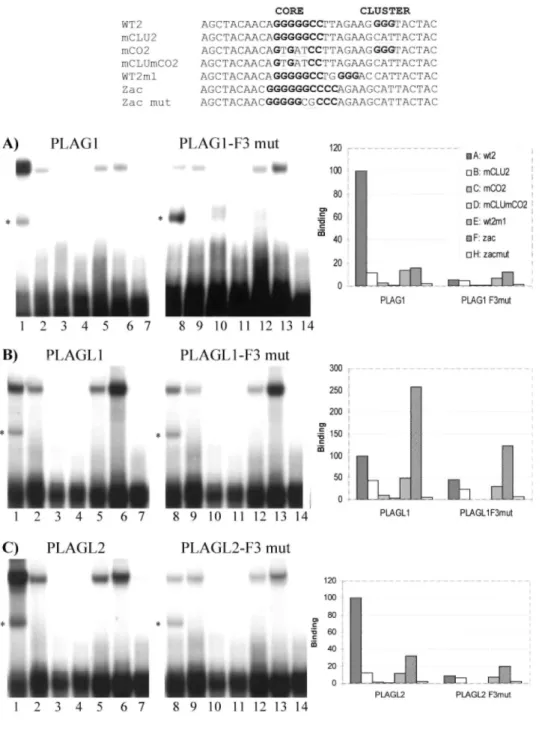
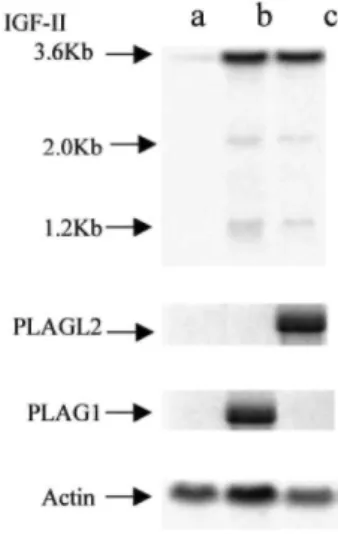
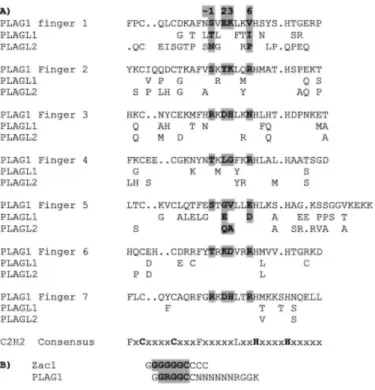
The tumorigenic diversity of the three PLAG family members is associated with different DNA binding capacities.
Texte intégral
Figure
Documents relatifs
Regarding the proposed genus Tupanvirus of the Mimiviridae [3], a bioinformatics research has identified the existence of a genomic region of 49 Kbp, in which at least 10 genes
Using a yeast genetic two-hybrid screen with the full length PBX1B as bait, we isolated from an embryonic female genital tract library, a partial cDNA that corre- sponded to a new
L’archive ouverte pluridisciplinaire HAL, est destinée au dépôt et à la diffusion de documents scientifiques de niveau recherche, publiés ou non, émanant des
Analysis of the TSR1 DNA sequence revealed an open reading frame of 1383 base pairs, encoding a serine-rich protein of 461 amino acids with an amino-terminal signal peptide, and
Male Infertility: Genetics, Mechanism, and Therapies Charles Coutton, Rafael Fissore, Gianpiero Palermo, Katrien Stouffs,..
Title Page Abstract Introduction Conclusions References Tables Figures ◭ ◮ ◭ ◮ Back Close Full Screen / Esc.. Printer-friendly Version
When four colonies (one experimental block) had reached a size of approximately ten workers each, they were brought back to the field, and one of the four fol- lowing treatments
Utlisez la droite gradu´ ee pour calculer chaque diff´
