Testing methods applicable to refrigeration components and
systems
Sylvain Quoilin
(1)*, Cristian Cuevas
(2), Vladut Teodorese
(1),
Vincent
Lemort
(1), Jules Hannay
(1)and Jean Lebrun
(1)(1) University of Liège, Applied Thermodynamics, Liège, Belgium (2) Universidad de Concepción, Departamento de Ingeniería Mecánica, Chile
* Corresponding author (<[email protected]>)
Keywords: Testing methods, experimental techniques, energy balance, functional performances 1. INTRODUCTION
Evaluating the functional performances of any component or system is answering two series of questions:
• How much is it satisfying the requirements? What else is it offering? Which other advantage? Etc.
• What is the energy consumption level? What are the maintenance requirements? How much environmental impact? Etc.
The test of the components or of the system considered must include enough measurements to answer these questions.
This usually requires defining some mass and energy flow rates, associated to temperature and pressure potentials. For example, defining the functional performance of a heat exchanger (condenser, evaporator…) is answering to the following questions: how much heat is it transferring for a given temperature difference, or vice versa, and how much “auxiliary” (fan or pump) energy consumption does it generate? For a compressor, the question is: how much fluid (or how much heat) is transferred for which pressure ratio, or vice-versa, and how much energy is consumed?
This paper presents an overview of various testing methods and measuring techniques, including the definition of enthalpy flow rates, identification of ambient losses in a calorimeter and global energy balances.
Examples of testing methods and experimental results are presented, first on refrigeration components (compressor, evaporator, condenser) and then on a whole refrigeration system (room air conditioner).
2. TESTING OF A COMPRESSOR
2.1
Test bench description
The example presented hereafter concerns the test of a hermetic scroll compressor, supplied with refrigerant R134a and polyolester oil. In this kind of compressor, the refrigerant circulates first through the electrical motor, to cool it; and then enters into the compression chamber [1].
A small lubrication pump is mounted on the crankshaft in the bottom of the compressor shell, which circulates the oil to the bearings and scrolls through an orifice located inside the crankshaft. This compressor is confronted to two problems: the motor cooling (due to the high evaporation temperature), and the scroll lubrication: when the compressor turns slowly, the pumping effect decreases and the compressor is poorly lubricated. Under these conditions, the compressor internal leakage could also become more important.
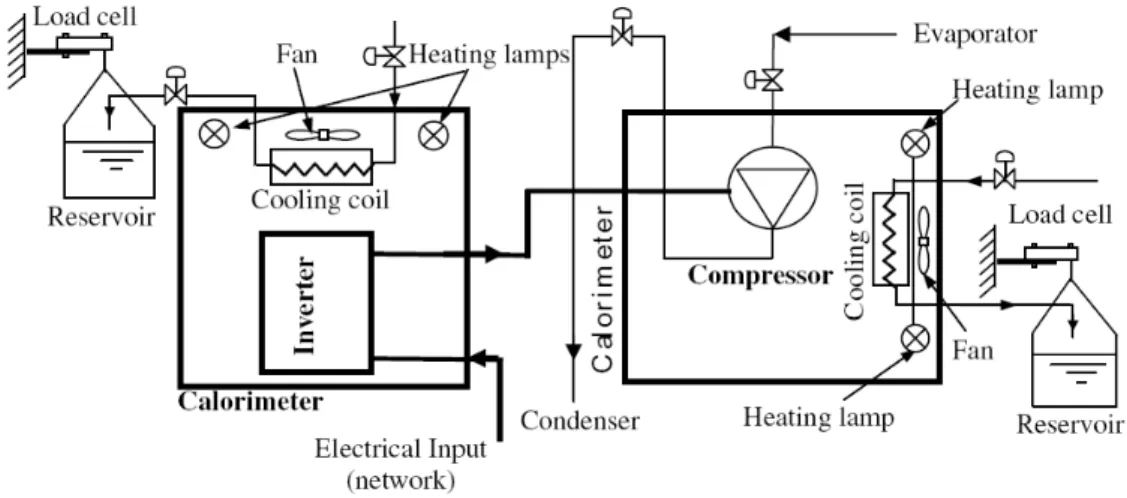
The compressor is supplied with a pulse-width modulated (PWM) inverter, which is used to regulate the compressor supply frequency and thus its speed. The inverter is used in the mode V/F control for constant torque loads and at a carrier frequency of 15 kHz. The compressor and the inverter are installed inside two separated calorimeters to determine their ambient losses as shown in Figure 1.
Each calorimeter works at a constant air temperature by manually tuning the fan coil water flow rate, which is used to compensate the heating contributions of the lamps and the component to be tested (the inverter or the compressor).
Figure 1 Schematic view of the test bench
For the inverter, the calorimetric thermal balance is preferred to any measurement of output power, because of the electrical disturbances created by the inverter itself that exclude the use of conventional power transducers. The total conductances of the compressor and inverter calorimeters are estimated by calibration.
The following measurements are carried out: compressor speed, inverter power, compressor supply and exhaust pressures and temperatures, compressor surface temperature. In both calorimeters, the air temperatures and the water flow rates are also measured.
Two sources of uncertainty are considered for the temperatures: one coming from the thermocouple tolerance (±0.5 K) and the other one coming from the data acquisition system (±0.3 K). Thus, an overall absolute uncertainty of ±0.6 K (relative uncertainty is smaller) is obtained.
The refrigerant mass flow rate is determined from the evaporator steady-state thermal balance, with an uncertainty estimated, by comparison with a Coriolis flow meter, to ±3%.
The compressor power is measured with a power transducer, only for the tests where it is supplied directly from the network at 50 Hz. In the other cases the inverter supply power is measured.
As in this test bench the compressor works at variable speed, its frequency is measured directly in the inverter control system. According to the inverter manufacturer, this frequency is given with an accuracy of ±0.01%.
Inverter and compressor calorimeter load cells, used to measure water flow rates by weight, were calibrated to reduce their uncertainties. In the tested range, the compressor calorimeter load cell has an uncertainty of ±0.4% and the inverter calorimeter load cell ±0.1%. By using the uncertainty propagation method an uncertainty for the compressor and the inverter calorimeter water flow rates of ±2.5% and ±1.5% are obtained, respectively.
2.2
Test results
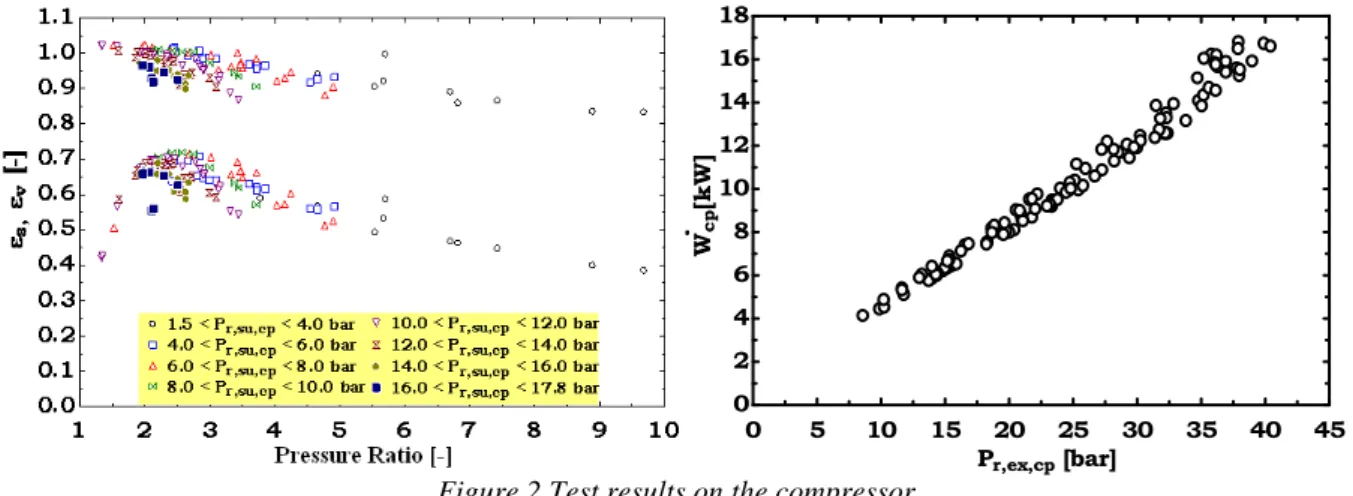
Examples of results are presented in Figure 2: the volumetric and isentropic effectiveness are plotted as functions of the supply pressure and of the pressure ratio imposed to the compressor. Isentropic effectiveness shows a maximum for a pressure ratio comprised between 2 and 3, corresponding to internal built-in volume ratio. A linear relation between compressor electrical consumption and exhaust pressure is also stated [2].
0 5 10 15 20 25 30 35 40 45 0 2 4 6 8 10 12 14 16 18 Pr,ex,cp [bar] W c p [k W ]
Figure 2 Test results on the compressor
3. TESTING OF AIR-TO-REFRIGERANT HEAT EXCHANGERS
The target of these tests is to determine the performances of an heated evaporator and of an air-cooled condenser. The evaporator and the condenser are here tested separately, in order to have an easier control for running conditions [5].
Figure 3 View of the evaporator
3.1
Description of the test bench
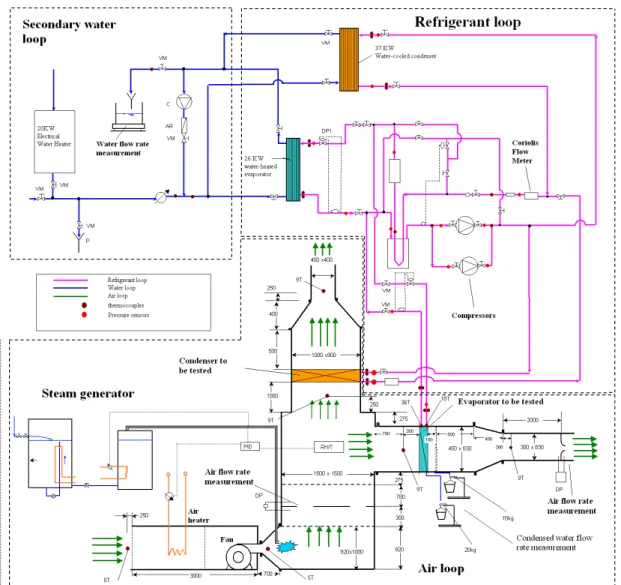
The evaporator and condenser are installed in an air network with controlled temperature and relative humidity. Figure 4 shows the general scheme of the test bench, which includes the refrigerant, water and air circuits. The positions of all temperature and pressure sensors are also indicated.
3.1.1 The air side network
The air is blown in open loop with a two-speed fan, which is located at the supply of the air network. The air mass flow rate is adjusted by tuning the speed of the fan or the position of a damper located at the inlet of the box. A set of electrical heating resistances is used to bring the ambient air to the required temperature, with the help of PID controller.
For horizontal condenser tests, a 4-hole orifice plate, located in the middle of the box, is used to
measure the airflow rate. Air flows into the vertical branch only (the horizontal branch is thus fully closed).
For evaporator tests, water vapor injection is used to control the proper air humidity at the supply
of the evaporator. A standard nozzle (ISO 5167-1980) is located behind evaporator in order to measure the air flow rate [3]. The vertical branch of the air network is then fully closed.
Figure 4 Schematic view of the test bench
3.1.2 Refrigerant network
The evaporator to be tested is connected to a refrigerant network with variable speed scroll compressor, water-cooled condenser, receiver and Coriolis flow meter. The water flow rate of the condenser is adjusted to control the proper condensing pressure at the refrigerant side.
Almost the same refrigerant network is used to test the condenser, except that the latter is replacing the water-cooled condenser, and that a water-heated evaporator replaces the evaporator previously tested.
An internal heat exchanger is installed between the high-pressure liquid line at the condenser exhaust and the low-pressure vapor line at the evaporator exhaust. This reduces the risks of a two-phase state entering the Coriolis flow meter and/or liquid entering the compressor.
3.1.3 Water network
Open loop water networks are used here for both the water-cooled condenser and the water-heated evaporator.
The hot water supplied to the water-heated evaporator is coming from a gas boiler. The supply water temperature is around 30~35°C.
The condenser is supplied with tap water, whose temperature is around 10 to 12 °C.
Each water flow rate is measured by a water counter and also by weighting; it’s adjusted by a control valve.
3.1.4 Measuring equipment and data processing
Pressure drops are measured on each heat exchanger with differential pressure sensors, refrigerant flow rate is measured with a Coriolis flow meter, and humidity is measured with relative humidity sensors. Data acquisition is performed with 3495A IMP/PC system at a sample rate of 1 Hz.
3.1.4.1 Temperatures
The temperatures are measured using T-type thermocouples (copper-constantan). The reference temperature is 0°C and it is given by a water ice mixing. The accuracy is estimated to be ±0.2 K.
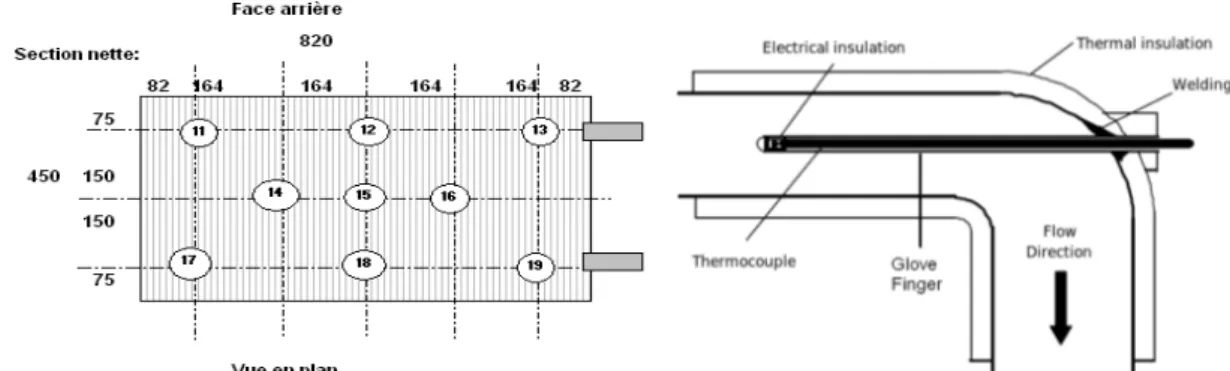
For air flow temperatures, since radial temperature gradients can occur, a net of thermocouples is used (Figure 5). The dispersion σ between all thermocouples is the mean difference between each measured temperature and mean value for all the thermocouples. This leads to a σ < 0.3K at the supply of the evaporator/condenser, and to a σ < 0.7K at the exhaust of the evaporator/condenser.
In order to reduce conduction uncertainties, refrigerant and water temperatures are measured with thermocouples installed in glove fingers, as indicated in Figure 5.
Figure 5 Temperature measurement in an air line (left) and in a refrigerant pipe (right)
3.1.4.2 Air flow rate measurements
All air flow rates are measured with nozzles and differential pressure sensors, according to the ISO 5167-1980 standard.
Air mass flow rate is computed as follows [3]:
M · ( 1 + w ) = Cd · Aint · ε · 2 · ρ · ( 1 + w ) · ∆p
Where M is the dry air mass flow rate, w is the humidity ratio, Aint is the orifice area, ρ is the dry
air density and ∆p is the measured pressure drop across the nozzle.
Cd (the flow coefficient) and ε (compressibility coefficient) are calculated according to the ISO
5167 standard as a function of the Reynolds number and of the nozzle diameters.
3.2
Test results
Several steady-state performance points are obtained on both the evaporator and the condenser. For each test, three heat balances are established: on both heat exchangers and on the compressor
respectively. This allows checking the consistency among the measurements. Table 1 shows an example of results obtained on the evaporator.
Supply air temperature 26.9 °C
Supply relative humidity 48.1 %
Air flow rate (at supply conditions) 2809 m3/h
Evaporating temperature 4.3 °C
Superheating at evaporator exhaust 3.2 K Sub cooling at expansion valve supply 1.3K Capacity on refrigerant side (reference value) 28.5 kW
Refrigerant flow rate 0.207 kg/s
Lubricant flow rate 0.0038 kg/s
Exhaust air temperature 7.6 °C Exhaust air relative humidity 96.5%
Air side pressure drop 156.1 Pa
Heat balance residue on the compressor -1.25 % Heat balance residue on the air-heated evaporator 2.24 % Heat balance residue on the water-cooled condenser -0.86 %
Table 1 Example of test results on the evaporator
4. TESTING OF A ROOM AIR CONDITIONER
Previous sections described the measurements performed on HVAC components. In some cases, measurements on the components alone are not sufficient, and the whole HVAC system has to be characterized. The section describes the experimental investigation of reversible room air conditioner (RAC). The testing method is based on a double energy balance [4]:
• The air side energy balance ("calorimeter" method) consists in installing each (indoor and outdoor) unit inside a calorimeter. Each calorimeter contains all (water and heat) sources and sinks, required to absorb the emission of each unit and to maintain the required environmental conditions (air temperature and humidity).
• The refrigerant side energy balance ("enthalpy method") is based on the determination of the refrigerant enthalpy flow rate supplied to each element of the RAC (compressor, condenser, expansion valve and evaporator). This is made possible thanks to the use of a set of temperature and pressure sensors and of a Coriolis flow meter, introduced in the refrigerant circuit.
4.1
DESCRIPTION OF THE TEST BENCH AND TEST METHOD
Testing conditions are fixed in priority according to the international standard ISO 5151 standard. In order to cover a larger domain of use, six other combinations of test conditions are also considered.
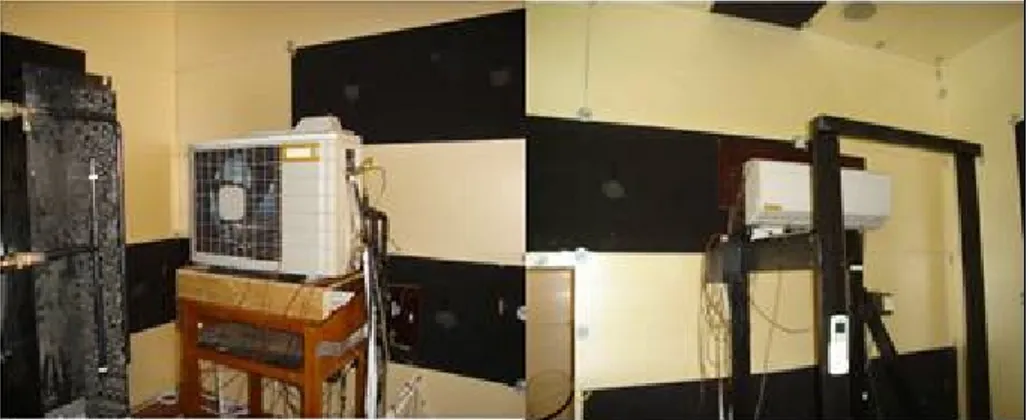
The “indoor” test room is a volume (conform to ISO 5151), in which the required test conditions are maintained within specified tolerances (0.5 K for the temperatures). The air velocity is never exceeding 2.5 m/s near the tested equipment. The “outdoor” test room also shows a sufficient volume (conform to ISO 5151) to avoid any perturbation of the “normal” air circulation pattern. The distances between all walls, except for the floor, and all equipment surfaces are larger than 0.9m. The manufacturer’s installation instructions are also carefully respected.
Figure 6 View of the RAC outdoor unit (left) and indoor unit (right)
4.1.1 Calorimeter method
The calorimeter provides a method for determining the capacity simultaneously on both indoor and outdoor sides of the equipment. In cooling mode, this method is used only to check the air-conditioning unit performances obtained by the refrigerant-enthalpy method. Heat and water mass balances are used to determine the indoor unit capacity.
The saturated steam is superheated in order to compensate the ambient heat losses with help of a super-heater.
A power transducer measures the sensible heat input.
The latent heat input is determined by measuring, the amount of water consumed by the steam boilers.
The outdoor unit capacity is also determined in order to check indoor side heat balance. The outdoor air is cooled or heated by a fan-coil unit. The cooling or heating power is determined by a water side energy balance. Supply and exhaust water temperatures are measured by thermocouples located in glove fingers; the water flow rate is measured every 15 minutes with the help of a balance and continuously checked with the help of a counter.
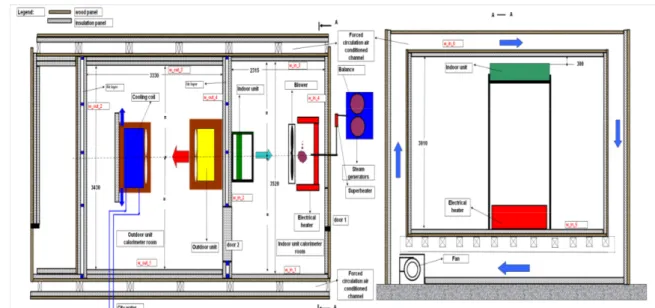
The calorimeter is completely insulated. An insulated wall separates also the “indoor” and “outdoor” rooms of the calorimeter. The air temperatures are controlled in the air channels surrounding the calorimeter. Heat gains or losses of all calorimeter walls are determined with the help of heat flow meters. Air temperatures and relative humidity are measured at the supply and at the exhaust of each (indoor/outdoor) unit. Globe temperatures are also measured at different points. The main sizes and the general arrangement of the calorimeter are shown in Figure 7.
Figure 7 General view of the calorimeter rooms (cooling mode arrangement)
4.1.2 Refrigerant Enthalpy Method
Temperature and pressure measurements are used to determine the enthalpy change through each component. The refrigerant mass flow rate is measured with help of a Coriolis flow meter, located downstream of the condenser, in the liquid line. Enthalpy changes and flow rate are combined together in order to determine the cooling and heating capacities.
4.2
Test results
Examples of test results obtained with one RAC are presented in Table 2. The results available show among others that:
• The differences between both experimental methods are currently not over-passing 5 %; • The Energy Efficiency Ratio (EER) coefficient in cooling mode is here varying from 2.9 to
4.6, according to the class and mainly according to the conditions of use; • The EER coefficient in heating mode is varying from 2.7 to 3.7;
The main “bottle neck” for increasing EER seems located at the level of the condenser in both modes, i.e. at the level of the outdoor heat exchanger in cooling mode and at the level of the indoor heat exchanger in heating mode. In the present case, indeed, the main difference between “high” and “medium” classes consists in an increase of area of the outdoor heat exchanger.
Table 2 Examples of test results on the room air conditioner
CONCLUSION
Several experimental methods are presented in this paper that permit to determine accurately the performances of the tested components.
The calorimeter method allows measuring the ambient losses of the components, and allows, for example, performing a heat balance over the compressor. This heat balance can be used for checking the refrigerant and/or oil flow rate in the device.
Defining various and well pre-defined working conditions is of crucial importance. For that purpose, the design of an air network and of a refrigerant circuit are described, that are used to control the supply conditions (temperature, humidity, pressure) of the heat exchangers.
In the same manner, a double calorimetric room is used to define ambient conditions for the testing of the room air conditioner.
REFERENCES
[1] C. Cuevas, J. Lebrun, Testing and modeling of a variable speed scroll compressor, Applied Thermal Engineering, University of Liège, Belgium, 2008
[2] C. Cuevas, J. Lebrun, V. Lemort, E. Winandy, Characterization of a scroll compressor under extreme conditions, Submitted to be published in Applied Themal Engineering, University of Liège, 2008
[3] International Organization for Standardization, ISO-5167: Measurement of fluid flow by means of pressure differential devices. Part1: Orifice plates, Nozzles and Venturi tubes inserted in circular cross-section conduits running full, 1991
[4] Jean Lebrun, Ion Vladut Teodorese, Modeling and testing of room air conditioners in heating and cooling modes, Heat pump Conference 2008, Laboratoire de Thermodynamique, Université de Liège, Liège, Belgium
[5] Vlad TEODORESE, Jianjun XIA and Jean LEBRUN, Heat exchangers performance tests, Laboratoire de Thermodynamique, Université de Liège, Liège, Belgium, April 2003