HAL Id: tel-02145208
https://tel.archives-ouvertes.fr/tel-02145208
Submitted on 2 Jun 2019HAL is a multi-disciplinary open access archive for the deposit and dissemination of sci-entific research documents, whether they are pub-lished or not. The documents may come from teaching and research institutions in France or abroad, or from public or private research centers.
L’archive ouverte pluridisciplinaire HAL, est destinée au dépôt et à la diffusion de documents scientifiques de niveau recherche, publiés ou non, émanant des établissements d’enseignement et de recherche français ou étrangers, des laboratoires publics ou privés.
bases
Louis-Philippe Sondeck
To cite this version:
Louis-Philippe Sondeck. Privacy and utility assessment within statistical data bases. Cryptog-raphy and Security [cs.CR]. Institut National des Télécommunications, 2017. English. �NNT : 2017TELE0023�. �tel-02145208�
THESE DE DOCTORAT
CONJOINT TELECOM SUDPARIS et L’ UNIVERSITE PIERRE ET MARIE CURIE
Spécialité: Informatique et Réseaux
École doctorale: Informatique, Télécommunications et Electronique de Paris
Présentée par
Louis Philippe SONDECK
Pour obtenir le grade de
DOCTEUR DE TELECOM SUDPARIS
Mesure de la vie privée et de l’utilité des données dans les
bases de données statistiques
Soutenue le 15 décembre 2017 devant le jury composé de : Sara FORESTI
Professeur associé, Università degli Studi di Milano, Italie - Rapporteur
Benjamin NGUYEN
Professeur HDR, INSA Val de Loire, France - Rapporteur
Sébastien TIXEUIL
Professeur HDR, Université Pierre et Marie Curie, France - Examinateur
Christophe ROSENBERGER
Professeur HDR, ENSICAEN, France - Examinateur
Vincent FREY
Ingénieur de recherche, Orange Labs, France - Encadrant
Maryline LAURENT
Professeur HDR, Télécom SudParis, France - Directrice de thèse
iii
PHD THESIS TELECOM SUDPARIS IN PARTNERSHIP WITH PIERRE ET
MARIE CURIE UNIVERSITY
Speciality: Computer Science and Networks
Doctoral School: Informatique, Télécommunications et Electronique de Paris
Presented by
Louis Philippe SONDECK
To obtain the degree of
DOCTOR OF TELECOM SUDPARIS
Privacy and Utility Assessment within Statistical Data Bases
Presented on December 15th, 2017 with the Jury composed by:
Sara FORESTI
Associate Professor, Università degli Studi di Milano, Italy - Reviewer
Benjamin NGUYEN
Professor, INSA Val de Loire, France - Reviewer
Sébastien TIXEUIL
Professor, Université Pierre et Marie Curie, France - Examiner
Christophe ROSENBERGER
Professor, ENSICAEN, France - Examiner
Vincent FREY
Research Engeneer, Orange Labs, France - Supervisor
Maryline LAURENT
Professor, Télécom SudParis, France - Thesis Director
v
vii
Abstract
Personal data promise relevant improvements in almost every economy sectors thanks to all the knowledge that can be extracted from it. As a proof of it, some of the biggest companies in the world, Google, Amazon, Facebook and Apple (GAFA) rely on this resource for providing their services. However, although personal data can be very useful for improvement and development of services, they can also, intentionally or not, harm data respondent’s privacy. Indeed, many studies have shown how data that were intended to protect respondents’ personal data were finally used to leak private information. Therefore, it becomes necessary to provide methods for protecting respondent’s privacy while ensuring utility of data for services. For this purpose, Europe has established a new regulation (The General Data Protection Reg-ulation) (EU,2016) that aims to protect European citizens’ personal data. However, the regulation only targets one side of the main goal as it focuses on privacy of citi-zens while the goal is about the best trade-off between privacy and utility. Indeed, privacy and utility are usually inversely proportional and the greater the privacy, the lower the data utility. One of the main approaches for addressing the trade-off between privacy and utility is data anonymization. In the literature, anonymiza-tion refers either to anonymizaanonymiza-tion mechanisms or anonymizaanonymiza-tion metrics. While the mechanisms are useful for anonymizing data, metrics are necessary to validate whether or not the best trade-off has been reached. However, existing metrics have several flaws including the lack of accuracy and the complexity of implementation. Moreover existing metrics are intended to assess either privacy or utility, this adds difficulties when assessing the trade-off between privacy and utility. In this thesis, we propose a novel approach for assessing both utility and privacy called Discrim-ination Rate (DR). The DR is an information theoretical approach which provides practical and fine grained measurements. The DR measures the capability of at-tributes to refine a set of respondents with measurements scaled between 0 and 1, the best refinement leading to single respondents. For example an identifier has a DR equals to 1 as it completely refines a set of respondents. We are therefore able to provide fine grained assessments and comparison of anonymization mechanisms (whether different instantiations of the same mechanism or different anonymization mechanisms) in terms of utility and privacy. Moreover, thanks to the DR, we provide formal definitions of identifiers (Personally Identifying Information) which has been recognized as one of the main concern of privacy regulations. The DR can therefore be used both by companies and regulators for tackling the personal data protection issues.
ix
Résumé
Les données personnelles sont d’une importance avérée pour presque tous les secteurs d’activité économiques grâce a toute la connaissance qu’on peut en extraire. Pour preuve, les plus grandes entreprises du monde que sont: Google, Amazon, Facebook et Apple s’en servent principalement pour fournir de leurs services. Cependant, bien que les données personnelles soient d’une grande utilité pour l’amélioration et le développement de nouveaux services, elles peuvent aussi, de manière inten-tionnelle ou non, nuire à la vie privée des personnes concernées. En effet, plusieurs études font état d’attaques réalisées à partir de données d’entreprises, et ceci, bien qu’ayant été anonymisées. Il devient donc nécessaire de définir des techniques fi-ables, pour la protection de la vie privée des personnes tout en garantissant l’utilité de ces données pour les services. Dans cette optique, l’Europe a adopté un nouveau règlement (Le Règlement Général sur la Protection des Données) (EU,2016) qui a pour but de protéger les données personnelles des citoyens européens. Cependant, ce règlement ne concerne qu’une partie du problème puisqu’il s’intéresse unique-ment à la protection de la vie privée, alors que l’objectif serait de trouver le meilleur compromis entre vie privée et utilité des données. En effet, vie privée et utilité des données sont très souvent inversement proportionnelles, c’est ainsi que plus les données garantissent la vie privée, moins il y reste d’information utile. Pour répondre à ce problème de compromis entre vie privée et utilité des données, la technique la plus utilisée est l’anonymisation des données. Dans la littérature scien-tifique, l’anonymisation fait référence soit aux mécanismes d’anonymisation, soit aux métriques d’anonymisation. Si les mécanismes d’anonymisation sont utiles pour anonymiser les données, les métriques d’anonymisation sont elles, nécessaires pour valider ou non si le compromis entre vie privée et utilité des données a été atteint. Cependant, les métriques existantes ont plusieurs défauts parmi lesquels, le manque de précision des mesures et la difficulté d’implémentation. De plus, les métriques existantes permettent de mesurer soit la vie privée, soit l’utilité des don-nées, mais pas les deux simultanément; ce qui rend plus complexe l’évaluation du compromis entre vie privée et utilité des données. Dans cette thèse, nous proposons une approche nouvelle, permettant de mesurer à la fois la vie privée et l’utilité des données, dénommée Discrimination Rate (DR). Le DR est une métrique basée sur la théorie de l’information, qui est pratique et permet des mesures d’une grande fi-nesse. Le DR mesure la capacité des attributs à raffiner un ensemble d’individus, avec des valeurs comprises entre 0 et 1; le meilleur raffinement conduisant à un DR de 1. Par exemple, un identifiant a un DR égale à 1 étant donné qu’il per-met de raffiner complètement un ensemble d’individus. Grâce au DR nous éval-uons de manière précise et comparons les mécanismes d’anonymisation en termes d’utilité et de vie privée (aussi bien différentes instanciations d’un même mécan-isme, que différents mécanismes). De plus, grâce au DR, nous proposons des défini-tions formelles des identifiants encore appelés informadéfini-tions d’identification person-nelle. Ce dernier point est reconnu comme l’un des problèmes cruciaux des textes juridiques qui traitent de la protection de la vie privée. Le DR apporte donc une réponse aussi bien aux entreprises qu’aux régulateurs, par rapport aux enjeux que soulève la protection des données personnelles.
xi
Acknowledgements
There are many people who have participated in one way or another in the accom-plishment of this work, whether by advices, encouragements or rewarding discus-sions. I would like to thank all of you for all your support.
I would like to express my deepest gratitude to Maryline LAURENT, my thesis director for her support, advices and trust. This thesis has been a very particular experience, with highs and lows, and she always had trust in me even when all was very low. Maryline taught me to never stop going furhter in the work, as anything is still perfectible and can be improved; this mindset has positively influenced var-ious aspects of my life, whether professional or personal. I can hardly express all the gratitude I have for her and how her support has been crucial not only for the accomplishment of this work, but also for the accomplishment of the person I am today.
I am very much thankful to Vincent FREY, my senior project supervisor for his commitment and guidance throughout this thesis. Vincent helped me with new ideas and advices that have been useful for the refinement of this work. He has always made himself available for resolving technical as well as administrative dif-ficulties, and has greatly facilitated my integration and collaboration within the var-ious projects in which I participated.
A special thank to the "PhD Dpt." (Dr. Yanhuang LI, Kevin CORRE, Marco LOBE KOME, Youssou NDIAYE, Julien HATIN) who have been my nearest col-laborators during these three years and with whom I shared the same office. It has been a great pleasure to meet you and share with you during these years. I am very thankful to all the support you gave me, this experience would have been very dif-ficult without your support.
I would like to thank Prof. Benjamin NGUYEN and Dr. Sara FORESTI who are the reporters of my thesis and who provided me with recommandations which greatly improve the quality of this work. Thanks a lot to Prof. Sébastien TIXEUIL and Prof. Christophe ROSENBERGER for their interest and for being part of the jury of my thesis.
A special thank to the projects I participated to: ARDECO, ADAGE which gave me the opportunity to explore realistic use cases and allowed me to approach the problematic from different angles. A special thank to Stéphane PETIT, Anne-Sophie PIGNOL, Emilie SIRVENT-HIEN, Baptiste OLIVIER for the rewarding discus-sions.
I would like to thank Dr. Jacques TRAORE for his advices, interest and availabil-ity for discussing new ideas and approaches. His experience and recommendations have been very usefull for helping me refining my contributions.
I am very grateful to my parents Gabriel SONDECK and Gisèle SONDECK without whom all this would never have happened, to my little brothers Maxime, Ludovic, Dominique and Ferdinand for their support and trust, and for whom I am
a model.
I can not conclude without thanking Joel EVAIN, my team manager, for facilitat-ing my integration into the research team and his availability to respond promptly to all administrative requests, my colleagues and time spent together, the meetings and discussions; it has been a great pleasure to share all this time with you.
xiii
Contents
Abstract vii Acknowledgements xi I Introduction 1 1 Introduction 31.1 Data Privacy Issues with Identified Limitations of the Current GDPR
Regulation . . . 3
1.2 GDPR the New Regulation for Protecting Personal Data. . . 3
1.3 Lack of Clarity of GDPR for its Implementation . . . 4
1.3.1 The Need to Characterize Identifiers, as not Clearly Addressed in the GDPR . . . 4
1.3.2 The Need for using Anonymization instead of Pseudonymiza-tion (a Lacking Point of the GDPR) . . . 5
1.4 The Relevant Issues . . . 7
1.5 Contributions of this Thesis . . . 8
1.6 Thesis Organization . . . 8
II State of the Art 11 2 Statistical Disclosure Control: Goal and Mechanisms 13 2.1 Introduction . . . 13
2.2 SDC Objectives and Assessment Considerations . . . 13
2.3 SDC Terminology and Formal Description . . . 14
2.3.1 SDC Terminology and Formal Description. . . 14
2.4 SDC Application Domains . . . 15 2.4.1 Tabular Data . . . 16 2.4.2 Queryable Databases . . . 17 2.4.3 Microdata . . . 17 2.4.4 Conclusion . . . 18 2.5 Deterministic mechanisms . . . 18
2.5.1 Generalization and Suppression . . . 18
2.5.2 Local Suppression . . . 18
2.5.3 Top and Bottom Coding . . . 19
2.5.4 Anatomy . . . 19 2.5.5 Microaggregation . . . 20 2.6 Non-Deterministic Mechanisms . . . 22 2.6.1 Noise Addition. . . 22 2.6.2 Data Swapping. . . 23 2.6.3 Sampling . . . 23
2.6.4 Rounding . . . 24
2.6.5 Post-RAndomization Method (PRAM) . . . 24
2.6.6 MASSC . . . 24
2.6.7 Synthetic Data Generation. . . 25
2.7 Conclusion . . . 25
3 Statistical Disclosure Control Metrics 27 3.1 Introduction . . . 27
3.2 Background . . . 28
3.2.1 What is Disclosure Risk ? . . . 29
3.2.2 What is Data Utility ? . . . 30
3.3 Privacy Models (k-anonymity and Differential Privacy) . . . 30
3.3.1 k-anonymity Based Models . . . 30
k-anonymity to Mitigate Identity Disclosure . . . 30
l-diversity to Mitigate Homogeneity and Background Knowl-edge Attacks . . . 32
t-closeness to Mitigate Skewness and Similarity Attacks . . . . 32
Data Utility for k-anonymity . . . 34
Utility is Handy with k-anonymity . . . 34
3.3.2 e-Differential Privacy . . . 34
Data Utility for e-differential privacy . . . 35
3.4 Disclosure Risk Metrics . . . 36
3.4.1 Uniqueness . . . 36 Simple uniqueness . . . 36 Special uniqueness . . . 36 3.4.2 Record linkage . . . 37 3.5 Utility Metrics . . . 38 3.5.1 Utility for PPDP . . . 38
Utility Measurement for Continuous Data . . . 39
Utility Measurement for Categorical Data . . . 40
3.5.2 Utility for PPDM. . . 40
Classification . . . 41
Regression . . . 41
Clustering . . . 42
3.6 Comparative Analysis of Disclosure Risk Metrics and Limitations . . 42
3.6.1 Assessment Criteria . . . 42
3.6.2 Comparative Analysis of Existing Metrics . . . 43
k-anonymity-like metrics and the epsilon parameter . . . 43
Uniqueness metrics . . . 43
Record Linkage . . . 43
Other record linkage methods . . . 44
3.7 Conclusion . . . 44
III Contributions 47 4 Discrimination Rate: An Attribute-Centric Metric to Measure Privacy 49 4.1 Introduction . . . 49
4.2 Key Features For a Good Privacy Metric. . . 50
4.3 Our Informal Definitions Related to Identifiers . . . 51
xv
4.4.1 Background on Entropy . . . 53
4.4.2 Simple Discrimination Rate (SDR), and Sensitive vs Key at-tributes. . . 54
SDR Computation illustration . . . 54
4.4.3 Combined Discrimination Rate (CDR) . . . 56
CDR Computation illustration . . . 56
4.5 Revisited Identifiers Definitions with DR . . . 58
4.6 DR application To SDC . . . 58
4.6.1 Measuring SDC anonymization mechanisms with the DR . . . 59
4.7 Experiments (k-anonymity and l-diversity assessment and compari-son) . . . 63
4.7.1 Identity Attack . . . 64
4.7.2 Homogeneity attack . . . 64
4.8 Comparison of the DR with the existing disclosure metrics . . . 65
4.9 Conclusion and Future Work. . . 66
5 The Semantic Discrimination Rate 69 5.1 Introduction . . . 69
5.2 t-closeness Limitations and Inability to Quantify Privacy . . . 70
5.3 Inability for Basic DR to Measure Semantic . . . 71
5.4 Semantic Empowered Discrimination Rate . . . 71
5.4.1 Semantic as a Subjective Measurement with Regard to At-tacker’s Model . . . 71
5.4.2 Semantic Domain Definitions . . . 72
5.4.3 SeDR as DR with Semantic Measurement . . . 73
5.4.4 Illustration of the SeDR Computation and Comparison with the DR . . . 73
5.4.5 Measuring Record Linkage with SeDR . . . 74
5.5 Measurement and Comparison of l-diversity vs t-closeness with SeDR 74 5.5.1 Skewness Attack - Measurement with DR . . . 75
5.5.2 Similarity Attack - Measurement with SeDR . . . 76
5.5.3 Results Proving the Lower Privacy Protection of T-closeness vs L-diversity. . . 77
5.6 Experiment. . . 78
Results interpretation. . . 79
5.7 Conclusion . . . 79
6 A Posteriori Utility Assessment of Sanitized Data with the Discrimination Rate Metric 81 6.1 Introduction . . . 81
6.2 Semantic in Utility Assessment . . . 83
6.3 On the Frontier Between Utility and Privacy . . . 84
6.4 Informal Definitions of the A Posteriori Utility and Illustrations . . . . 84
6.4.1 Informal Definitions . . . 85
6.4.2 Illustration (Global Recoding) . . . 85
6.4.3 Illustration (Microaggregation) . . . 87
6.5 Formal Definition of the A Posteriori Utility Within a Microdata . . . 89
6.5.1 A Posteriori Utility Need Formulation . . . 89
6.5.2 A Posteriori Utility Need Computation Using the SeDR . . . . 91
6.7 Conclusion . . . 93
IV Conclusion 95 7 Conclusion and Perspectives 97 7.1 Conclusion . . . 97
7.2 Perspectives . . . 99
A Résumé de la thèse en français (long) 105 A.1 Introduction . . . 105
A.2 Le manque de clarté du RGPD dans son implémentation . . . 106
A.2.1 Le besoin de caractériser les identifiants, qui n’est pas claire-ment pris en compte par le RGPD . . . 106
A.2.2 Le besoin d’utiliser l’Anonymisation plutôt que la Pseudonymi-sation (Un point manquant du RGPD) . . . 107
A.3 Les questions pertinentes traitées dans cette thèse . . . 109
A.4 Contributions de cette thèse . . . 109
A.5 Etat de l’art. . . 110
A.5.1 Les techniques d’anonymisation . . . 110
A.5.2 Les métriques d’anonymisation . . . 112
A.6 Contribution . . . 113
A.6.1 Le Discrimination Rate: une métrique centrée sur les attributs pour mesurer la vie privée (Objectifs 1, 2 et 3). . . 113
A.6.2 Le Semantic Discrimination Rate (Objectif 3) . . . 116
A.6.3 Evaluation d’utilité a posteriori de données anonymisées avec la mesure Discrimination Rate (Objectif 4). . . 117
xvii
List of Figures
4.1 Anonymity set before and after the knowledge of an Identifier . . . . 52
4.2 Anonymity set before and after the knowledge of a Sketchy-Identifier 53 4.3 The Discrimination Rate for Table 4.1 . . . 56
4.4 Identity Attack measurements in the Adult dataset . . . 63
4.5 Homogeneity Attack measurements in the Adult dataset . . . 64
5.1 SeDR measurements for the Experiment. . . 80
6.1 Utility assessment over sanitized data sets and comparison with original data . . . 91
xix
List of Tables
1.1 Original Data Table. . . 6
1.2 Anonymized Data Table. . . 6
2.1 Original Data Table (Salary/Disease). . . 15
2.2 Generalized Table. . . 19
2.3 Original Data Table (Anatomy). . . 20
2.4 The Quasi-Identifier Table Obtained with Anatomy (QIT). . . 20
2.5 The Sensitive Table Obtained with Anatomy (ST).. . . 21
2.6 Microaggregation Table.. . . 22
3.1 Original Data Table (Disease.. . . 31
3.2 3-anonymity Table (Disease).. . . 31
3.3 A 3-diverse Table.. . . 33
3.4 An 0.167-closeness w.r.t. Salary and 0.278-closeness w.r.t. Disease. . . 34
3.5 uniqueness Table.. . . 37
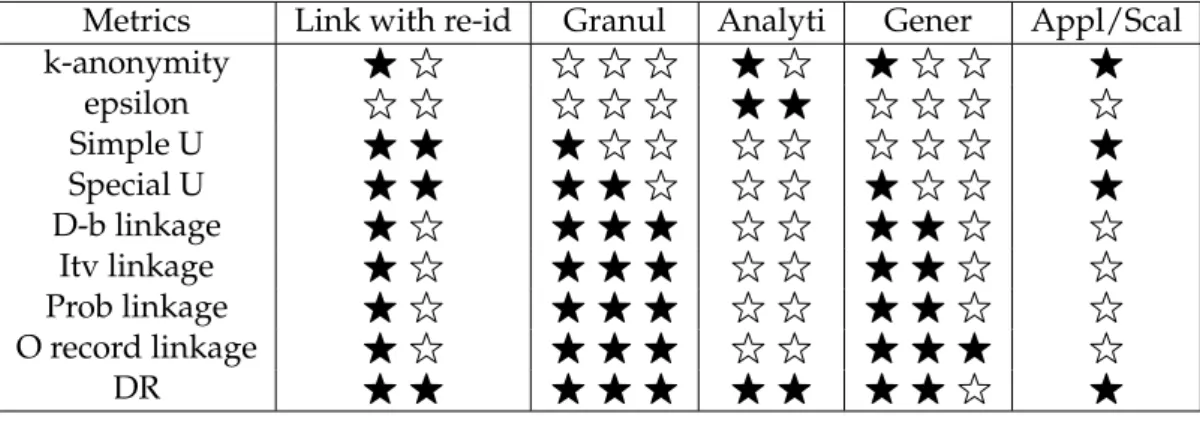
3.6 Table comparing existing disclosure risk metrics. . . 44
4.1 Example of data table . . . 51
4.2 Generalization Table . . . 58
4.3 A 3-anonymous Table . . . 59
4.4 A 3-diverse Table . . . 59
4.5 Risk measurements for the Identity disclosure . . . 60
4.6 Risk measurements for the Homogeneity attack . . . 60
4.7 Resistance measurement to combine Homogeneity and Background knowledge attacks (computed from the results of Table 4.6) . . . 61
4.8 Attributes of the Adult dataset used in the experiment. . . 63
4.9 Values of attribute "Marital Status" used in the experiment . . . 64
4.10 Table comparing existing disclosure risk metrics with DR. . . 66
5.1 An 0.167-closeness w.r.t. Salary and 0.278-closeness w.r.t. Disease. . . 70
5.2 A 3-diverse Table.. . . 71
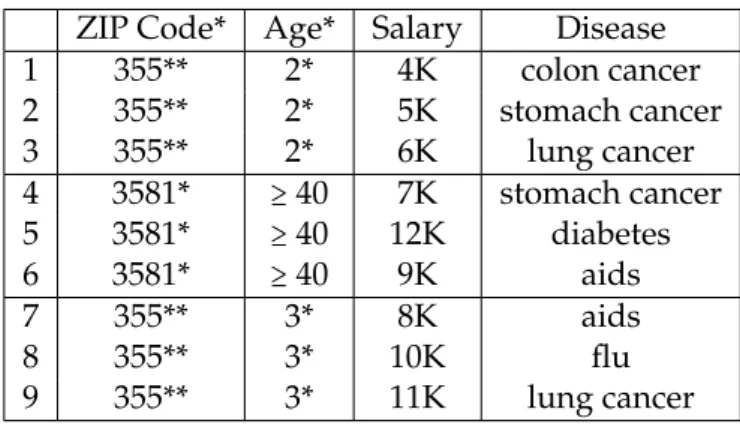
5.3 Original Data Table (Salary/Disease). . . 73
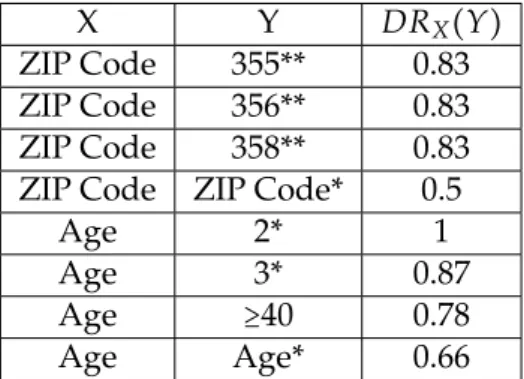
5.4 Semantic DR in Table 5.3. . . 74
5.5 Table comparing existing disclosure risk metrics with DR and SeDR.. 75
5.6 Risk measurement for Tables 5.2 & 5.1 for the similarity attack using SP4as the semantic partition and Age* & ZIP Code* as key attributes. 76 5.7 Risk measurement for Tables 5.2 & 5.1 for the similarity attack using SP2as the semantic partition and Age* & ZIP Code* as key attributes. 77 5.8 Risk measurement for Tables 5.2 & 5.1 for the similarity attack using SP3as the semantic partition and Age* & ZIP Code* as key attributes. 78 5.9 Attributes of the Adult dataset used in the experiment. . . 79
6.1 Data table example . . . 84
6.3 3-anonymity Table (Disease) of Table 6.2. . . 86
6.4 Utility assessment within Table 6.3.. . . 87
6.5 Original data table (Microaggregation) . . . 87
6.6 Microaggregated data table of Table 6.5 . . . 88
6.7 Microaggregated data table of Table 6.6 with application of the se-mantic partition (2) over attribute Salary . . . 88
6.8 Utility assessment within the Microaggregated Table 6.6 w.r.t. (1). . . 89
6.9 Utility assessment within the Microaggregated Table 6.7 w.r.t (2). . . . 90
6.10 Attributes of the Adult data set used in the experiment . . . 91
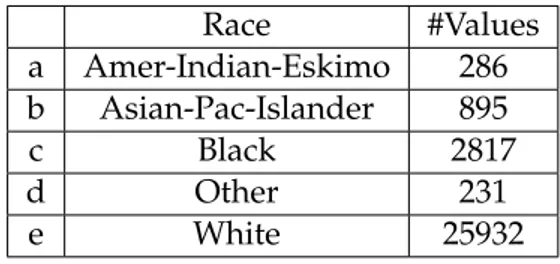
6.11 Values of attribute "Race" used in the experiment . . . 92
6.12 Values of attribute "Salary-class" used in the experiment . . . 92
A.1 Original Data Table. . . 108
A.2 Anonymized Data Table. . . 108
A.3 Example of data table . . . 114
A.4 Original Data Table (Salary/Disease). . . 117
A.5 Semantic DR in Table 5.3. . . 117
A.6 Original data table (Global Recoding) . . . 118
A.7 3-anonymity Table (Disease) of Table A.6. . . 119
1
Part I
3
Chapter 1
Introduction
1.1
Data Privacy Issues with Identified Limitations of the
Current GDPR Regulation
It is difficult to estimate all the benefits thatpersonal datacan provide both to users and to companies. Personal data are used in every sector for improvements and de-velopment of new services including: consumers’ risk analysis, reduction of trans-action costs, increase of advertising returns. In 2009, the European Commissioner for Consumer Protection compared personal data to oil (Spiekermann et al.,2015), in order to illustrate its implication for creating added value for companies. A re-port by the Boston Consulting Group (Global,2012), projects that the personal data sectors will produce up to 1 trillion euro in corporate profits in Europe by 2020.On the other hand, personal data can represent an important burden for compa-nies due to the inherent risk of privacy violation. Indeed, the data may reveal more information to thedata processors than therespondent(Domingo-Ferrer,2007) de-sire, leading to privacy violation which could affect the company in terms of repu-tation and legal penalties. For example, in 2006, America Online’s (AOL) released twenty million anonymized search queries (Barbaro, Zeller, and Hansell,2006) for the benefit of researchers; thereafter, the data have been used to re-identify Thelma Arnold, a 62-year old widow living in Lilburn. To adress such issues, Europe has defined a new regulation for privacy management (GDPR: General Data Protection Regulation) which will take effect on May 2018 and which aims protecting Euro-pean citizens’ privacy. One of the main changes of this regulation according to pre-vious ones is penalty: offending companies could be fined up to 4% of annual global turnover or 20 million euro.
However, according to our analysis, two points of concern still need clarification to support the implementation of the GDPR, as discussed in Section1.3.
1.2
GDPR the New Regulation for Protecting Personal Data
The General Data Protection Regulation (GDPR) is the new regulation for protecting users’ privacy which has been approved by the European Union (EU) on 14 April 2016 and will be directly applied in all members states on 25 May 2018. GDPR re-places the previous regulation which was the Data Protection Directive 95/46/EC adopted in 1995. The GDPR provides 3 main key changes:• Increased Territorial Scope (extra-territorial applicability): GDPR applies to all companies processing personal data of data subjects residing in the Union,
regardless of the company’s location. Indeed, the previous data protection regulation was intended to take into account the context of each member state which was not clearly defined and has arisen in a number of high profile court cases.
• Penalties: under GDPR, offending companies can be fined up to 4% of annual global turnover or 20 Million euro (whichever is greater).
• Consent: consent should be clearly asked by service providers and long and illegible terms are no longer allowed. Moreover, the request for consent must clearly describe the purpose for data processing.
Other changes include: breach notification (breach notification is mandatory un-der GDPR and must be done within 72 hours), right to access (the data subject has the right to obtain from the data processor a copy of its personal data which should be free of charge), right to be forgotten (the data subject has the right to ask for eras-ing of all his personal data from the data processor data bases).
The first reason companies are encouraged to be compliant to GDPR is the fines. Indeed, fines are relatively high (4% of annual global turnover or 20 Million euro, whichever is greater) and this could be persuasive enough.
Another reason is trust. Indeed the main claimed goal of GDPR is to reinforce the trust between companies and customers as without trust, innovation and devel-opment of new services can not take place. Moreover, data breaches can damage the reputation of a company with a great impact on incomes.
1.3
Lack of Clarity of GDPR for its Implementation
1.3.1 The Need to Characterize Identifiers, as not Clearly Addressed in the GDPR
The main difficulty for privacy management comes from its legal definition and es-pecially from the difficulty to characterizeIdentifiers (Schwartz and Solove, 2011). Indeed the GDPR, as other regulations before (Schwartz and Solove,2011), lacks a proper definition of identifiers which may be biased. Indeed, in its Article 32, the GDPR defines the means to ensure the security of processing, which can be sepa-rated into two groups:
• Methods for ensuring and evaluating data privacy: pseudonymization (de-fined below) and encryption.
• Methods for ensuring confidentiality, integrity, availability and resilience. In addition to these measures, the GDPR encourages in its Article 40 : " the draw-ing up of codes of conduct intended to contribute to the proper application of the Regulation, taking account of the specific features of the various processing sectors and the specific needs of micro, small and medium-sized enterprises."
Therefore, the GDPR proposes pseudonymization as a mean to ensure data pri-vacy. Pseudonymization is defined in Article 4 as:
"the processing of personal data in such a manner that the personal data can no longer be attributed to a specific data subject without the use of additional information, provided that
1.3. Lack of Clarity of GDPR for its Implementation 5 such additional information is kept separately and is subject to technical and organizational measures to ensure that the personal data are not attributed to an identified orIdentifiable Natural Person."
In other words, pseudonymization consists in transforming personal data such that they can no longer be linkable to a specific data subject. .
Personal data are defined as :
"any information relating to an identified or identifiable natural person ("data subject"); an identifiable natural person is one who can be identified, directly or indirectly, in particular by reference to an identifier such as a name, an identification number, location data, an on-line identifier or to one or more factors specific to the physical, physiological, genetic, mental, economic, cultural or social identity of that natural person."
However, the term identifier is not defined, this definition only provides an enu-meration of specific cases which are obviously not exhaustive taking into account the diversity of applications. Furthermore, considering the proposed set of identifiers, could they be considered as such in any context ?
To illustrate the complexity behind this terminology let us consider the following example which underlines the importance of the context when defining identifiers:
Suppose there is a badly parked car on the street and we need to identify the owner of this car. Suppose we are able to find that the owner, M. John, is in a bar in the same street. Now suppose that in the same bar there are many people named John. Can we consider in this case that the name is an identifier as it does not refer anymore to a single person ? On the other hand, suppose we are able to know that the owner is wearing a white shirt and we find that in the same bar, there is only one person wearing a white shirt. Then the white shirt becomes an identifier in this case since it is enough to identify the car’s owner.
This example shows the complexity of the identifiers terminology and the im-portance of context which is not taken into account in the current legal text.
A proper definition of identifiers is an important concern as personal data are de-fined according to identifiers and pseudonymization (the recommended mechanism) is about the protection of personal data. Hence, without a clear definition of identifiers, data processors would not be able to identify them (identifiers) and therefore, would not be able to protect personal data.
1.3.2 The Need for using Anonymization instead of Pseudonymization (a Lacking Point of the GDPR)
Pseudonymization is not enough for protecting data as it only prevents a direct link with a subject (cf. Section1.3); however, the remaining knowledge within pseudonymized data can still be used for re-identifying a specific subject (Hansell,2006) (Barbaro, Zeller, and Hansell,2006). In the literature there is a more general mechanism to protect personal data which is anonymization. Anonymization consists in transform-ing data such that the data can no longer be linked to a particular data subject and no information can be learned from him while still enabling utility of data. This def-inition includes both the inability to link an information to a subject and the inability to learn any information on specific subjects.
TABLE1.1: Original Data Table. Age Disease 1 22 lung cancer 2 22 lung cancer 3 22 lung cancer 4 45 stomach cancer 5 63 diabetes 6 40 flu 7 35 aids 8 35 aids 9 32 diabetes
TABLE1.2: Anonymized Data Table.
Age* Disease 1 2* lung cancer 2 2* lung cancer 3 2* lung cancer 4 ≥ 40 stomach cancer 5 ≥ 40 diabetes 6 ≥ 40 flu 7 3* aids 8 3* aids 9 3* diabetes
The following example describes the anonymization process. Let us consider the two data tables (Table1.1 and Table 1.2); an Original Data Table (Table1.1) which represents the raw data (not anonymized) and an Anonymized Data Table (Table 1.2) which is the corresponding anonymized table. This is a specific instantiation of the k-anonymity anonymization model (Samarati and Sweeney,1998) (Sweeney,
2002) (Samarati,2001).
The idea of k-anonymity is to transform some attribute’s values (key attribute, e.g. Age) in order to reduce their identifying capabilities according to another type of attribute (sensitive attribute, e.g. Disease) by forming subsets of k records. In our example, the key attribute Age is transformed into Age* within the anonymized table, the sensitive attribute Disease is not transformed and subsets of 3 records are formed (table1.2is therefore a 3-anonymity table of Table1.1).
The main concern about anonymization is the trade off between data privacy and data utility (Li and Li,2009) (Loukides and Shao,2008a). Indeed, while data privacy is recommended by GDPR, service providers need to use the data for improvement of their services and since anonymization is about reducing the attributes’ inherent information, there should be a trade off between what is recommended by author-ities and what is needed by service providers. Anonymization should therefore be precisely evaluated in order to provide the good balance between data privacy and data utility.
1.4. The Relevant Issues 7 The previous anonymization instantiation is therefore intended to respond to both privacy and data utility. Privacy refers to the ability of an attacker to re-identify a given respondent, while utility refers to the capability of a data processor to extract useful information from data. Both issues can be formulated in terms of questions. We provide here an example of possible questions:
• Privacy: how much is it possible to go from the transformed Age* values to its corresponding raw values (Age) ?
• Utility: how much from the defined Age groups, is it possible to identify the corresponding Disease ?
Indeed, the privacy violation comes from the ability to re-identify a subject and therefore in our example, to go from the transformed attribute Age* to the raw at-tribute Age (within theOriginal Datatable); and measuring privacy would consist in measuring this ability.
On the other hand, utility refers to the capacity to extract useful information from the data. In this case, measuring utility would consist in measuring how, from Age, we can guess the disease a subject suffers for.
However, as we will see in Chapter 3, utility extraction can also be considered as a privacy violation and the difficulty of privacy evaluation would therefore consist in delimiting the border between privacy and utility.
This example shows how complex anonymization can be, since it refers to spe-cific questions which depend on the considered case.
Alongside the previous concern, the regulation encourages in its article 42: "the establishment of data protection certification mechanisms and of data protection seals and marks, for the purpose of demonstrating compliance with this Regulation of processing oper-ations by controllers and processors."
However, in the literature, although there are many propositions of anonymization mechanisms, there are few practical metrics for quantifying privacy vs. utility. More-over, there is no uniform approach for comparison of different anonymization tech-niques/instantiations. This last concern is necessary for choosing the most suitable technique and therefore to assess the compliance with the regulation.
1.4
The Relevant Issues
We can therefore consider the following issues:
1. How can we characterize identifiers with respect to the context ? Identifiers are at the centre of the regulation around personal data as personal data are defined according to identifiers; however, the current regulation does not con-sider the context in its definition and a lack of a proper characterization can lead to misunderstandings.
2. Which approach is to be considered for privacy assessment ? Many ap-proaches exist for privacy measurements but for defining consistent regulation rules, there is the need for a global approach.
3. How can we define a scale for comparing various anonymity mechanisms ? Many mechanisms exist for protecting privacy but few are pratical. Moreover, there is no uniform scale that can be used for comparison.
4. How can we measure utility in terms of specific needs (questions) ? As utility refers to a specific data use and therefore to a specific question, an accurate assessment would consist in measuring data with respect to a need; which is difficult to implement because of the subjectivity of the need.
1.5
Contributions of this Thesis
In this thesis we propose a metric called Discrimination Rate (DR) that enables: • Goal 1: A fine grained characterization of identifiers with respect to the
con-text.
• Goal 2: A measurement of anonymity degree in terms of attribute identifica-tion capabilities which provide a fine granularity and therefore is usable for different domains.
• Goal 3: An accurate evaluation and comparison of the existing anonymization techniques in terms of disclosure risk.
• Goal 4: An accurate measurement of utility in terms of specific utility needs.
1.6
Thesis Organization
The rest of the manuscript is organized as follows: • Part II: State of the Art
Chapter 2 - Statistical Disclosure Control: Goal and Mechanisms. This chap-ter presents the Statistical Disclosure Control (SDC) goals in chap-terms of the trade-off between data utility and privacy and it describes the related mechanisms (generalization and suppression, microaggregation, PRAM, synthetic data gen-eration...) with their capability to achieve these goals.
Chapter 3 - Statistical Disclosure Control Metrics. This chapter presents anonymity metrics as the main concern in data privacy and we can distinguish two types of metrics: disclosure risk metrics and utility metrics. Disclosure risk metrics (Uniqueness, Record linkage) assess the re-identification capability of anonymized data while the utility metrics (information loss, machine learning metrics) assess the data utility.
• Part III: Contributions
– Goal 1, Goal 2 and Goal 3
Chapter 4 - Discrimination Rate: an attribute-centric metric to measure privacy. This chapter presents the Discrimination Rate (DR), a new met-ric that provides an attribute-centmet-ric approach for privacy measurement and that is practical and flexible enough to fit with various application
1.6. Thesis Organization 9 domains. The DR computes the attribute identifying capability (scaled between 0 and 1) by measuring how it refines an anonymity set; the more an attribute can refine an anonymity set, the higher its DR. For example, an identifier has a DR equal to 1 as it refines the anonymity set to single users. Thanks to the DR, we provide the first fine grained evaluation and comparison of two of the most used anonymization techniques which are k-anonymity and l-diversity. This work gives a solution for Goal 1, Goal 2 and Goal 3 of Section 1.5. It was published in Journal of Annals of Telecommunications, 2017 (Sondeck, Laurent, and Frey,2017c).
– Goal 3
Chapter 5 - The Semantic Discrimination Rate. This chapter presents the Semantic Discrimination Rate (SeDR), an improvement of the DR which takes into account semantic considerations. The SeDR enables more flex-ibility for anonymity measurements and is used to compare l-diversity vs. t-closeness which are two of the best k-anonymity-like anonymization techniques. Moreover, as t-closeness is considered better than l-diversity, the SeDR shows that, depending on the semantic considerations, t-closeness can be worse than l-diversity. This work is an approach for Goal 3. It was published in the Security and Cryptography conference (SECRYPT) in 2017 (Sondeck, Laurent, and Frey,2017b).
– Goal 4
Chapter 6 - A posteriori utility assessment of sanitized data with the Discrimination Rate metric. After using our metric (SeDR) for anonymity measurement, we show how it can be used to provide an accurate a pos-teriori utility assessment for any type of sanitized (anonymized) data. A posteriori assessment is the most practical approach as it is performed only on the basis of the sanitized data and a predefined utility need, while the a priori assessment aims to assess the extent to which sanitized data reflect the original data; and is therefore based on anonymized data and original data (which is not accessible). This contribution satisfies Goal 4. • Part IV: Conclusion
Chapter 7 - Conclusion and Perspectives. This chapter concludes the disserta-tion and provides a summary of contribudisserta-tions together with the perspectives for future works.
11
Part II
13
Chapter 2
Statistical Disclosure Control: Goal
and Mechanisms
2.1
Introduction
This chapter presents the main anonymization mechanisms used for achieving both data utility and data privacy within databases. We first explain the goal of anonymiza-tion and the related challenges, then we introduce some background including at-tacks targeting respondents’ privacy and finally we describe the different mecha-nisms used to counteract those attacks. We focus on Statistical Disclosure Control (SDC) mechanisms which are about protecting respondents’ privacy i.e. privacy of persons to whom the data refer.
SDC is a large field including tabular data protection, queryable databases and microdata protection. The related protection mechanisms are diverse with respect to each domain. However, tabular data and queryable databases formats can be ob-tained frommicrodataformat (cf. Section2.4.3). We provide a quick overview of tab-ular data protection and queryable databases protection; then we focus on microdata which the protection mechanisms can be splitted into: deterministic mechanisms which do not consider noise addition, and non-deterministic mechanisms that are based on noise addition and synthetic data generation. No approach is strictly bet-ter than the other one as the goal is to reach the good trade-off between privacy and utility and depending on the needs, either deterministic or non-deterministic mechanism can be used.
This chapter is organized as follows. Section2.2presents the goals of SDC mech-anisms in terms of trade-off between privacy and utility. Section 2.3 gives some background on SDC including related definitions and description of the main SDC file formats. Sections 2.5 and 2.6 focus on the microdata file format and present the related protection mechanisms that are either deterministic or non deterministic. Section2.7gives our conclusion.
2.2
SDC Objectives and Assessment Considerations
The goal of data anonymization (SDC) is twofold (Li and Li,2009) (Makhdoumi and Fawaz,2013):
• Privacy: it should protect against respondents identification
• Utility: it should guarantee the usefulness of data for different processes. anonymizationgoal is to guarantee the good trade-off between privacy and util-ity; data are used to carry out various applications among which: development of
new services by companies, scientific research, government studies... and these ap-plications should also guarantee privacy. These specificities have led to another ex-pression which is sanitization and which better underlines both of the goals.
However, SDC mechanisms are usually built to ensure privacy as they aim to counteract re-identification attacks (Samarati and Sweeney,1998), (Machanavajjhala et al., 2007), (Li, Li, and Venkatasubramanian, 2007), (Dwork, 2011) and utility is measured thereafter depending on the case. This approach has led to evaluate SDC mechanisms in terms of their capability to resist to attacks (Ganta, Kasiviswanathan, and Smith, 2008) instead of their capability to respond to the fundamental need which is: the trade-off between privacy and utility. Indeed, privacy and utility are usually considered as inversely proportional (Li and Li,2009) (Xu et al.,2015) (Brick-ell and Shmatikov,2008) as such, comparing SDC mechanisms considering only the privacy dimension could lead to a biased assessment.
2.3
SDC Terminology and Formal Description
Statistical Disclosure Control techniques aim to protect data within statistical databases such that they can be published without harming the privacy of individuals to whom the data correspond and, at the same time they can ensure data usability. The ear-liest works on SDC date back to 1970s with the contribution of Dalenius (Dalenius,
1974) and the works by Schlörer and Denning (Denning, Denning, and Schwartz,
1979) (Schlörer, 1975). A good survey of more recent SDC technologies is given by (Domingo-Ferrer, Sánchez, and Hajian,2015a).
This section introduces the terminology of SDC that will be used throughout this chapter.
2.3.1 SDC Terminology and Formal Description
The statistical databases can take one of the following formats: microdata (cf. Section 2.4.3), tabular data (cf. Section2.4.1) and queryable databases (cf. Section2.4.2). The two latter can be seen as macro data (Ciriani et al.,2007) as they only refer to aggregated data about respondents, while microdata contain data about single respondents. As macro data formats can be obtained from a micro data format by aggregating values (cf. Section2.4.3), the terminology presented here is only about the micro data for-mat.
A microdata file is generally depicted by a table where each row (record) contains individual data and each column is an attribute shared by every respondents within the table. For example Table2.1is a microdata with 4 attributes (ZIP Code, Age, Salary and Disease) and 9 records.
Formally, a microdata file M referring to r respondents with s attributes (vari-ables) is a r× s matrix where Mijis the value of attribute j for respondent i. Attributes
in a microdata can be of three categories which are not necessarily disjoint:
• Identifiers: attributes that can be used on their own to characterize a single re-spondent among others. Examples of such attributes are: social security num-bers, names, fingerprints.
2.4. SDC Application Domains 15
TABLE2.1: Original Data Table (Salary/Disease).
ZIP Code Age Salary Disease
1 35567 22 4K colon cancer 2 35502 22 5K stomach cancer 3 35560 22 6K lung cancer 4 35817 45 7K diabetes 5 35810 63 12K diabetes 6 35812 40 9K aids 7 35502 35 8K aids 8 35568 35 10K flu 9 35505 32 11K lung cancer
• Quasi-Identifiers/Key Attributes: attributes that do not completely character-ize a respondent but can be combined with others for complete characteriza-tion. Examples of such attributes are: zip code, age, gender...
• Confidential/Sensitive attributes: attributes which contain sensitive informa-tion on the respondent. Examples are: salary, religion, health.
Attributes within a microdata file format can be of different types (Domingo-Ferrer, Sánchez, and Hajian,2015a):
• Continuous: attributes on which numerical and arithmetical operations can be performed. Examples: Age, Salary... The main disadvantage ofcontinuous attributesis that their values are usually completely different from each other and so, can be used to characterize a respondent within a dataset.
• Categorical: attributes that take values over a finite set and over which arith-metical operations can not be performed. We can distinguish two types of such attributes:
– Ordinal: when the values are ordered. We can therefore apply operators like≤, max and min.
– Nominal: when the values are not ordered. The only possible operator is equality (=). Examples are the colors.
Moreover, depending on the context, any attribute can be used for re-identification. This last observation is underlined by (Schwartz and Solove,2011) which presents identifiers as one of the most important concerns for privacy regulation as personal data are inherently linked to identifiers (Personally Identifiable Information). In Chapter4we propose a more formal and quantifiable definition of the identifiers’ terminology which takes into account the context.
2.4
SDC Application Domains
This section presents a description of the three SDC domains which are: tabular data protection, queryable databases protection and micro data protection. While the first two protection mechanisms have been studied from a while (since 1970s (Denning, Den-ning, and Schwartz,1979) (Dalenius,1974)), microdata protection is a relatively new field.
2.4.1 Tabular Data
Tabular data is a specific SDC format which the goal is to publish static aggregate information over data (e.g., sums, averages...) rather than original data in order to limit information leakage. Tabular data can be described as follows:
T∶ D(Mi1) × D(Mi2) × ... × D(Mik) → R or N (2.1)
Where k ≤ s and D refers to the domain where attributes Mij takes its values.
An interesting survey on tabular data is provided by (Willenborg and De Waal,
2012a). Tabular data tables can be of two types (Domingo-Ferrer, Sánchez, and Ha-jian,2015a):
• Frequency tables: that display the count of respondents at the crossing of cat-egorical attributes (inN). For example given a census microdata containing attributes "Marital Status" and "Zip Code", a frequency table can display the count of respondents for each marital status in each Zip Code region.
• Magnitude tables: that display a numerical value at the crossing of categorical attributes (in R). For example if the census data also contain the "Salary", a magnitude table could display the average salary for each marital status in each zip code region.
Tables are called linked if they share some of the crossed categorical attributes. For example "Marital Status"× "Zip Code" is linked to "Marital Status" × "Age".
While the data displayed by tabular data seem to be constrained they can be subject to attacks among which:
• External attack: refers to attacks made by an attacker who is not a respondent. For example suppose an attack targeting a magnitude table displaying average salary and that, there is a single respondent for a given marital status MSi and
living in a given zip code region Zj; the average salary of respondents would
then disclose the actual salary of the only respondent.
• Internal attack: refers to attacks made by an attacker who is a respondent. Suppose now that there are only 2 respondents with marital status MSi and
living in Zjtheir salary would be displayed to each other.
• Dominance attack: is a specific case of the internal attack where the attacker is a respondent who dominates in the contribution to a cell of magnitude table and can therefore upper-bound the contributions of the other respondents. For example if the magnitude table, instead of displaying an average salary, dis-plays the total salary of respondent according to their marital status and Zip Code regions and if a respondent contributes to 90% he can then infer that the other respondents have low incomes.
The methods to counteract these attacks are either perturbative which modify some values of the table (e.g., Controlled Tabular Adjustment (Dandekar and Cox,
2002)) or non-perturbative which do not modify the table values (e.g., Cell Suppres-sion (Fischetti and Salazar,2000)).
2.4. SDC Application Domains 17
2.4.2 Queryable Databases
Queryable databases are a SDC format depicted by on-line databases to which a user can submit statistical queries (e.g., sums, averages...). These restrictions are made to prevent a user to infer information on a specific respondent. The main approaches to implement queryable data protection can be of three types (Domingo-Ferrer, Sánchez, and Hajian,2015a):
• Data perturbation. This is only possible when randomized answers can be enough for the user’s need. Perturbation can either apply on the records to which the queries refer or to the query result after computation over original data.
• Query restriction. This is the mechanism used when the user does not want randomized answers (e.g., a number). The data are simply restricted i.e. no answer is provided since they may carry enough information for characteri-zation and therefore for re-identification. Many criteria can be used to restrict the access to a given request, one of them is the set size control i.e. refusing the access to request referring to a set of records which is too small. (Chin and Ozsoyoglu,1982) propose some examples of query restriction.
• Camouflage. This mechanism is used when the user needs approximate but not randomized answers, for example, when small interval answers can be enough. The idea here is to provide an interval answer which includes the exact answer.
2.4.3 Microdata
There are different approaches for describing Microdata: masking methods and syn-thetic data generation. Masking methods consist in modifying the original data by re-ducing their inner amount of identification information and can be either determin-istic or non-determindetermin-istic (noise addition). Synthetic data generation refers to meth-ods that generate synthetic data that reflect original data to ensure the respondents confidentiality and is a non-deterministic approach. Note that the goal of both ap-proaches is to preserve some statistical properties of the original data within the sanitized data while preventing re-identification of the respondents.
Another way to characterize masking methods is by considering whether they alter original data or not, they can be either perturbative or non-perturbative (Willen-borg and De Waal, 2012b). Perturbative masking methods transform the original data which may disappear in the anonymized version and can use one of the follow-ing mechanisms: noise addition, microaggregation, data/rank swappfollow-ing, microdata round-ing, resampling and the Post-RAndomization Method (PRAM). Examples of perturba-tive masking methods are described in (Hundepool et al.,2012). Non-perturbative masking methods do not alter original data but produce partial suppression or re-duction. Some examples are: sampling, generalization and suppression, top and bottom coding and local suppression.
In this chapter we adopt another classification which is about whether microdata protection mechanisms are deterministic or non-deterministic (Sections2.5and2.6) as it better underlines their capacity to provide privacy vs. utility.
2.4.4 Conclusion
Queryable database protection and the tabular data protection can be obtained from a microdata file by first performing a microdata protection mechanism over the data before performing aggregate information in case of tabular data (cf. Section2.4.1) or a query in case of queryable databases (cf. Section2.4.2).
2.5
Deterministic mechanisms
Deterministic mechanisms do not consider noise addition for protection. Different mechanisms have been proposed in the literature including Generalization and Sup-pression, Anatomy and Microaggregation.
2.5.1 Generalization and Suppression
Generalization and Suppression aim to protect respondents’ privacy by replacing quasi-identifier values by more general values while suppressing identifying at-tributes. Generalization and Suppression aims to counteract identity disclosure (cf. Section 2.4.3). The idea is to reduce the identifying capability of quasi-identifiers by preventing the uniqueness of some specific value or combination of values. The identifier transformation can apply in different ways depending on the quasi-identifier type. For a categorical attribute a specific value can be replaced by a more general value according to a given hierarchy. For a continuous attribute, intervals containing the exact values can be used instead; discretization can also apply (Hun-depool et al., 2005). However, applying generalization on continuous attributes is more tricky as the arithmetic operations that were simple to apply on exact data could become less intuitive.
For example, let consider Table2.2which is a generalized instantiation of Table 2.1 where the categorical attributes Age and ZIP Code are transformed into Age* and ZIP Code*. As we can observe, unlike in the original data (Table2.1), where the Age value 45 can be used to characterize a respondent, no value or combination of values of the transformed attributes can be used to characterize a single respondent. Various schemes of Generalization and Suppression have been proposed in the literature including: full-domain generalization (LeFevre, DeWitt, and Ramakrishnan,
2005) (Sweeney,2002); Subtree Generalization (Bayardo and Agrawal,2005), (LeFevre, DeWitt, and Ramakrishnan,2005); Cell Generalization (Wong et al.,2006). They pro-pose different generalization approaches considering different levels of a given tax-onomy tree.
2.5.2 Local Suppression
Local suppression aims to suppress some of the identifying attributes values instead of suppressing the entire attributes in order to increase the usable set of records by building a cluster of values (referring to the Generalization and Suppression mech-anism). For example in Table2.1we can suppress the subsets of Age values {63, 45, 40}, thus, we would be able to build a new cluster indexed by "≥ 40". As continuous values are all different from each other, this mechanism is only suitable for categori-cal values. (Hundepool et al.,2008) proposes an implementation of local suppression in combination with the Generalization mechanism.
2.5. Deterministic mechanisms 19
TABLE2.2: Generalized Table.
ZIP Code* Age* Disease 1 35*** ≤ 32 colon cancer 2 35*** ≤ 32 stomach cancer 3 35*** ≤ 32 lung cancer 9 35*** ≤ 32 lung cancer 4 35*** > 32 diabetes 5 35*** > 32 diabetes 6 35*** > 32 aids 7 35*** > 32 aids 8 35*** > 32 flu
2.5.3 Top and Bottom Coding
Top and Bottom Coding (Domingo-Ferrer and Torra, 2001a) is a specific applica-tion of the Generalizaapplica-tion and Suppression mechanism. The idea is to rank the data values to form two sets, the top set and the bottom set, and then apply the same gen-eralization for all the values in each set. For this mechanism the attribute should be either continuous or categorical ordinal due to the need of an order relation. Other variants of this mechanism (Domingo-Ferrer and Torra,2001a) (Domingo-Ferrer and Torra, 2002) use either top coding (only values greater than a given value are re-placed), bottom coding (only values lower than a given value are replaced). For example, in Table2.2, two subsets of values are built for attribute Age, the top val-ues referred by "≤ 32" and the bottom valval-ues referred by "> 32".
2.5.4 Anatomy
Anatomy (Xiao and Tao,2006) releases all the quasi-identifiers and confidential at-tributes in two different tables and targets attribute disclosure (cf. Section2.4.3). In-deed, splitting confidential attributes and quasi-identifiers in different tables enable breaking their correspondences with the benefit of no transformation on their values, which provides therefore more granularity for accurate analysis. The intuition is that with the generalized Table, the domain values are lost and the uniform distribution assumption is the best to consider since there is no additional knowledge, whereas with the anatomyzed tables, domain values are kept and more accurate analysis can apply. Anatomy increases therefore data utility with respect to the Generalization and Suppression mechanism.
As an example, let us consider Table2.3which is the Original Data Table (Table 2.1) where we added attribute ID for specifying 2 groups of records (1 and 2). We consider 3 quasi-identifiers (ZIP Code, Age and Salary) and 1 confidential attribute (Disease). When we compute anatomy on this table, we obtain Tables2.4and2.5. As we can observe, there is no more direct links between quasi-identifiers and confiden-tial attributes in the anatomy Tables, the correspondences are rather made through attribute Group-ID.
Let us now compare this instantiation to the Generalization and Suppression in-stantiation according to the following request: "count the number of respondents of age "≥ 35" having aids". The correct number of respondents is 2; if we compute this num-ber using the Generalized Table (Table2.2) we obtain: 2 (the number of aids values
TABLE2.3: Original Data Table (Anatomy).
ID ZIP Code Age Salary Disease
1 35567 22 4K colon cancer 1 35502 22 5K stomach cancer 1 35560 22 6K lung cancer 2 35817 45 7K diabetes 2 35810 63 12K diabetes 2 35812 40 9K aids 2 35502 35 8K aids 2 35568 35 10K flu 1 35505 32 11K lung cancer
TABLE2.4: The Quasi-Identifier Table Obtained with Anatomy (QIT).
ZIP Code Age Salary Group-ID
35567 22 4K 1 35502 22 5K 1 35560 22 6K 1 35817 45 7K 2 35810 63 12K 2 35812 40 9K 2 35502 35 8K 2 35568 35 10K 2 35505 32 11K 1
in the table)×15 (the probability of having a subject with age≥ 35 and who belongs to the subset containing the aids values within Table2.2) = 25. When computed on the anatomyzed Tables (Tables2.4and2.5) we obtain: 2 (the number of aids values in the table)×25 (the probability of having a subject with age≥ 35 and who belongs to the subset containing the aids values within Tables2.4and2.5)= 45which is closer to the real value.
However, anatomy is not suitable for continuous attributes as it does not add any benefit for such attributes. Indeed, continuous values are usually completely differ-ent from each other and this would provide a uniform distribution assumption as well for the anatomy mechanism. Moreover, as for anatomy, data are published in different tables, it is unclear how standard data mining tools (classification, cluster-ing, association...) would apply; then new tools and algorithms need to be designed.
2.5.5 Microaggregation
Microaggregation is a SDC mechanism usually performed on continuous attributes (cf. Section2.3.1) as the common application requires average computation. How-ever some applications exist for categorical attributes (Domingo-Ferrer and Torra,
2.5. Deterministic mechanisms 21
TABLE2.5: The Sensitive Table Obtained with Anatomy (ST).
Group-ID Disease Count
1 colon cancer 1 1 stomach cancer 1 1 lung cancer 2 2 diabetes 2 2 aids 2 2 flu 1
building groups of at least k subjects where the individual confidential values are re-placed by a common value (usually an average over the k subjects, in case of contin-uous attributes). When the original data includes several attributes (variables), there are different approaches for microaggregation: univariate microaggregation (Hansen and Mukherjee,2003), (Nin and Torra,2009) which is applied to each variable inde-pendently, Multivariate microaggregation (Domingo-Ferrer, Sebé, and Solanas,2008) which constructs clusters taking into account all or subsets of variables at a time.
Microaggregation is performed using the two following operations:
• Partition: original records are partitioned into several groups where values correspond to at least k subjects and where no individual subject dominates too much (i.e. where one of the value is not too high or too low with respect to the other values)
• Aggregation: which is applied on attribute values using a specific computa-tion (e.g., the mean for continuous attributes, the median for categorical attributes) To illustrate the microaggregation process, we propose an example of a specific type of microaggregation which is k-anonymity microaggregation (Domingo-Ferrer,2006). Let us consider Table2.1as our original table, Age and Salary as our quasi-identifiers and Disease as our confidential attribute. Table2.6 is a possible microaggregation instantiation with a partition of 3 groups (1-3, 4-6, 7-9); aggrega-tion consists in average computaaggrega-tion for attribute Age and median computaaggrega-tion for attribute Salary. Table2.6provides therefore protection against the identity disclosure as an observer can no longer infer the disease of a specific individual within the table. However, partitioning should ensure the minimal information loss obtained when we reach the optimal k-partition. The optimal k-partition maximizes the within-group homogeneity and the higher the within-within-group homogeneity, the lower the information loss. To measure the within-group homogeneity the sum of squares cri-terion is commonly used (Hansen, Jaumard, and Mladenovic, 1998), (Gordon and Henderson,1977), (Edwards and Cavalli-Sforza,1965).
The sum of squares criterion can be described as follows (Domingo-Ferrer and Mateo-Sanz,2002): let n be the number of records, g the number of groups of size at least k, ni be the number of records in the i-th group (ni ≥ k and n = ∑gi=1ni). Let
xij be the j-th record in the i-th group and ¯xi the average data vector over the i-th
group, let ¯x be the average data vector over the whole set of n individuals. The sum of squares criterion is computed as:
TABLE2.6: Microaggregation Table.
Age Salary Disease
1 22 5K colon cancer 2 22 5K stomach cancer 3 22 5K lung cancer 4 49.33 9K diabetes 5 49.33 9K diabetes 6 49.33 9K aids 7 34 10K aids 8 34 10K flu 9 34 10K lung cancer SSE= g ∑ i=1 ni ∑ j=1(xij− ¯xi) ′(x ij− ¯xi) (2.2)
Where "(xij− ¯xi)′" refers to the micro aggregated instantiation and "(xij− ¯xi)" to
the original microdata. Then the optimal k-partition is the one that minimizes the SSE. However there exist different ways to form groups. Several taxonomies are possible including: (1) fixed group size (Defays and Nanopoulos,1993), (Domingo-Ferrer and Torra,2005) vs. variable group size (Laszlo and Mukherjee,2005), (Domingo-Ferrer and Mateo-Sanz,2002), (2) exact optimal (Hansen and Mukherjee, 2003) vs. heuristic microaggregation, (3) categorical (Domingo-Ferrer and Torra,2005) vs. con-tinuous.
2.6
Non-Deterministic Mechanisms
Non-deterministic protection mechanisms are based on noise addition and random-ization to protect respondents’ data. Different methods exist for noise addition. We first describe the noise addition principle and its related algorithms and then we present the existing protection mechanisms.
2.6.1 Noise Addition
Noise addition refer to a set of perturbative masking methods that aim to protect confidential data by mixing them with noise/fake data. This way, an attacker can no longer distinguish which data actually belong to real respondents. The mix is usually performed by adding or multiplying a sensitive attribute with a random variable with a given distribution.
Let Xj be the jth column (sensitive attribute) of the original microdata table with
N records. There exist many algorithms for noise addition (Brand, 2002) among which:
• Masking by uncorrelated noise addition: The sensitive attribute Xj of the
original data set is replaced by a vector: Yj= Xj+ ej