HAL Id: hal-02302609
https://hal-univ-rennes1.archives-ouvertes.fr/hal-02302609
Submitted on 7 Jul 2020
HAL is a multi-disciplinary open access
archive for the deposit and dissemination of
sci-entific research documents, whether they are
pub-lished or not. The documents may come from
teaching and research institutions in France or
abroad, or from public or private research centers.
L’archive ouverte pluridisciplinaire HAL, est
destinée au dépôt et à la diffusion de documents
scientifiques de niveau recherche, publiés ou non,
émanant des établissements d’enseignement et de
recherche français ou étrangers, des laboratoires
publics ou privés.
Distributed under a Creative Commons Attribution| 4.0 International License
Dynamic Dataflow Applications Based on PAPI
Daniel Madronal, Florian Arrestier, Jaime Sancho, Antoine Morvan, Raquel
Lazcano, Karol Desnos, Ruben Salvador, Daniel Menard, Eduardo Juarez,
Cesar Sanz
To cite this version:
Daniel Madronal, Florian Arrestier, Jaime Sancho, Antoine Morvan, Raquel Lazcano, et al.. PAPIFY:
Automatic Instrumentation and Monitoring of Dynamic Dataflow Applications Based on PAPI. IEEE
Access, IEEE, 2019, 7, pp.111801-111812. �10.1109/ACCESS.2019.2934223�. �hal-02302609�
PAPIFY: Automatic Instrumentation and
Monitoring of Dynamic Dataflow
Applications Based on PAPI
DANIEL MADROÑAL 1, FLORIAN ARRESTIER2, JAIME SANCHO 1, ANTOINE MORVAN2, RAQUEL LAZCANO 1, KAROL DESNOS2, RUBEN SALVADOR 1, (Member, IEEE),
DANIEL MENARD2, (Member, IEEE), EDUARDO JUAREZ1, (Member, IEEE), AND CESAR SANZ 1, (Member, IEEE)
1Research Center on Software Technologies and Multimedia Systems—CITSEM, Universidad Politécnica de Madrid, 28031 Madrid, Spain 2Univ Rennes, INSA Rennes, CNRS, IETR—UMR 6164, 35708 Rennes, France
Corresponding author: Daniel Madroñal (daniel.madronal@upm.es)
This work was supported in part by the European Union’s Horizon 2020 Programme through the CERBERO under Grant 732105, in part by the Ministry of Economy and Competitiveness (MINECO) of the Spanish Government through the PLATINO under Project TEC2017-86722-C4-2-R, and in part by the Universidad Politécnica de Madrid through the Programa Propio Predoctoral under Contract RR01/2016 and Contract RR01/2015.
ABSTRACT The widening of the complexity-productivity gap in application development witnessed in the last years is becoming an important issue for the developers. New design methods try to automate most designers tasks to bridge this gap. In addition, new Model of Computations (MoCs), as those dataflow-based, ease the expression of parallelism within applications, leading to higher designer productivity. Rapid prototyping design tools offer fast estimations of the soundness of design choices. A key step when prototyping an application is to have representative performance indicators to estimate the validity of those design choices. Such indicators can be obtained using hardware information, while new libraries, e.g., Performance Application Programming Interface (PAPI), ease the access to such hardware information. In this work, PAPIFY toolbox is presented as a tool to perform automatic PAPI-based instrumentation of dynamic dataflow applications. It combines PAPIFY with a dataflow Y-chart based design framework,
which is called PREESM, and its companion run-time reconfiguration manager, which is called Synchronous
Parameterized and Interfaced Dataflow Embedded Runtime (SPiDER). PAPIFY toolbox accounts for an
automatic code generator for static and dynamic applications, a dedicated library to manage the monitoring at run-time and two User Interfaces (UIs) to ease both the configuration and the analysis of the captured run-time information. Additionally, its main advantages are 1) its capability of adapting the monitoring according to the system status and 2) adaptation of the monitoring accordingly to application workload redistribution in run-time. A thorough overhead characterization using Sobel-morpho and Stereo-matching dataflow applications shows that PAPIFYrun-time monitoring overhead is up to 10%.
INDEX TERMS Performance monitoring, PMCs, PAPI, automatic code generation, dataflow, models of computation, code instrumentation.
I. INTRODUCTION
During the last few decades there has been an ever increas-ing widenincreas-ing of the gap between platform complexity and application development productivity, as shown, for instance, in the case of modern heterogeneous embedded System-on-Chips (SoCs) used in Cyber-Physical Systems (CPSs) [1].
The associate editor coordinating the review of this article and approving it for publication was Yucong Duan.
On the one hand, modern architectures constantly grow in heterogeneity and number of Processing Elements (PEs). On the other hand, autonomous and multimedia applications also have a constant increase in both algorithmic complexity and computational power requirements while demanding low energy consumption.
In this context, and under the pressure of stringent times to market, evaluating the best architecture for each application and devising an efficient implementation for it becomes
a really challenging task. Among others, this is due to the peculiarities associated with each platform, e.g., effi-cient workload distribution, parallelization strategies, bottle-necks, memory accesses, etc. With current state-of-the-art approaches, achieving well-balanced implementations that fulfill functional and non-functional requirements, incurs in ever increasing (experienced) developer times, who struggle to meet all these often opposing criteria; this situation is reaching the frontiers of what can currently be obtained. As an approach to solve this issue, the Y-chart design strategy [2] tries to bridge this productivity gap by isolating application and architecture concerns and merging them under a set of developer-defined constraints.
Combined with the Y-chart design methodology, dataflow MoCs, Model of Architectures (MoAs), programming methodologies and associated design tools bring the possibil-ity to explore new, improved design flows. This way, Design Space Exploration (DSE) by rapid prototyping of applica-tions on these complex architectures is being tackled through a set of different design automation tools like compiler par-allelization techniques, code generation, task scheduling, etc. However, tools based on Y-chart design and dataflow MoCs, such as ORCC [3], PREESM[4] or SCADE [5], usually provide a generic solution following a predefined methodology for any application, which could imply that the proposed solution does not fulfill the system specifications.
In order to evaluate the quality of automatic deployments, it is necessary to analyze the application execution on the target platform. Properly doing so requires having a deep understanding of the specific characteristics of the architec-ture and its available profiling tools. Thankfully, there is an abstraction layer that exposes a uniform interface to access hardware Performance Monitoring Counters (PMCs). PAPI library [6] offers a common architecture-independent layer coupled with an architecture-specific layer to cope with the individual characteristics of each architecture. Using PAPI, the PMCs can be accessed to profile low level events from a processor execution. This information can, in turn, be used to infer information of a higher level, such as memory usage, code parallelization, workload distribution, I/O utilization, etc. Additionally, other parameters, from an even higher level of abstraction, can be estimated combining this information, e.g., power or energy [7], [8]. The availability of these perfor-mance indicators contributes not only to increase designers’ productivity, but also enables iterative design flows.
In this regard, SPiDER [9], a run-time manager based on PREESM, deals with another current challenge: run-time
reconfiguration and refinement of (dataflow) applications. As mentioned in [10], providing a run-time manager with performance monitoring information would enhance the effi-cient application workload redistribution among the platform resources.
Even though a preliminary version of PAPIFYwas already presented in [11], the application monitoring only supported static executions (without any kind of reconfiguration). On the contrary, this paper contains not only a deeper insight
of the tool, but also presents a new internal structure of PAPIFY, which is now capable of supporting dynamic
moni-toring. This new functionality makes PAPIFYdetect the
work-load redistribution performed by SPiDER and, consequently, it is able to modify the monitored data accordingly. Further-more, transparently to the user, PAPIFYnow adapts different
strategies according to the monitoring status to minimize its overhead. To sum up, this paper presents the following contributions:
• Design time: Y-chart based monitoring configuration.
Application monitoring configuration and platform sup-ported monitors are completely isolated from each other
• Run-time: dynamic monitoring of application
perfor-mance execution that feeds a run-time manager like SPiDER. The user-defined monitoring follows the actor even after application reconfigurations
• PAPIFY-VIEWER: a graphical display showing collected hardware information for improved data analysis
• Thorough overhead toolbox characterization. Analysis for both static and dynamic scenarios when monitoring applications with different complexity levels
The rest of the paper is organized as follows: PAPI, PREESM
and SPiDER are detailed in SectionII; then, PAPIFYtoolbox
is introduced in SectionIII, while, in SectionIV, the toolbox is characterized in terms of execution time overhead. Finally, PAPIFYtool is compared with other state-of-the-art profiling tools in SectionVand the main conclusions are outlined in SectionVI.
II. RELATED TOOLS
In this section, the different composing tools involved in the development of the automatic instrumentation and refine-ment tool of dataflow applications, PAPIFY, are introduced. The section is divided into three main parts: (i) presentation and description of PAPI; (ii) brief introduction to PREESM
framework; and (iii) outline of the SPiDER run-time manager for dynamic execution of dataflow applications.
A. PAPI
PAPI aims at providing a standard API focused on easing the access to hardware monitoring information [6] through a set of PMCs. Even though PAPI can be used as a standalone tool for system and application analysis, it has been widely employed as a middleware component in profiling, tracing and sampling toolkits such as HPCToolkit [12], Vampir [13] and Score-P [14].
Due to the arrival and expansion of multi/many-core pro-cessors and heterogeneous platforms, and the associated increase in complexity, PAPI has been divided into two layers: on the one hand, an upper layer, which is platform-independent, providing a standard hardware monitoring inter-face; on the other, a lower, platform-dependent layer, which is transparent to the user, configured at compile time to automatically deal with the specific characteristics of the architecture [6].
PAPI has been built as a set of components (e.g., Graphics Processing Unit (GPU), x86 processor, etc.) and allows the user to define which ones are included when compiling the library. That is, at compile time, the user can include the dif-ferent components associated to the resources of the platform. Consequently, even when a heterogeneous platform is taken into account, the different hardware resources can be accessed through the same interface. Consequently, the PMC informa-tion can be obtained from a set of hardware resources such as Central Processing Units (CPUs), GPUs, memory or user defined components [15].
B. PREESM
PREESM1 is an open-source rapid prototyping tool [4] that
works with three inputs: (i) a dataflow graph defining the application; (ii) a System-Level Architecture Model (S-LAM) describing the target architecture; and (iii) a sce-nario including a set of parameters and constraints to link both of them. To deploy the algorithm over the target architec-ture, PREESMautomatically maps and schedules the dataflow specification over the available PEs, e.g., over the available CPU cores in a multi-core environment, as the one used in this work.
Applications in PREESM are specified using the Param-eterized and Interfaced Synchronous DataFlow (PiSDF) MoC [4], an extension of the Synchronous DataFlow (SDF) MoC [16], where computations are represented by nodes, called actors, and communications occur through FIFOS.
PiSDF extends SDF by introducing consistent graph hierar-chy using interfaces, parameterized FIFOsizes and run-time
reconfiguration [9].
Likewise, S-LAM [4] describes parallel architectures as a set of PEs transmitting data through a set of communication nodes and data links. By doing so, it supports the defini-tion of SW, HW or heterogeneous platforms [17] connected through different levels of granularity (i.e., Ethernet, shared memory, etc).
The joint node of the Y-chart design flow is the scenario. It relates both the application (PiSDF) and the architecture (S-LAM). Additionally, it provides user defined information to drive the automatic steps of the flow, e.g., actor timing information or actor ↔ PE affinity. Using this information, PREESMschedules, maps and simulates the execution of the
application and generates a compilable code in a language supported by the architecture, thus providing both metrics for system design and a prototype for testing.
It should be noted that there are two main characteris-tics that make PREESM a suitable tool for an architecture-independent DSE strategy compared to other frameworks like, for example, ORCC [3]: (i) the decoupling between application and architecture design and (ii) the static nature and deadlock-freeness of the generated code execution.
1Documentation and tutorials available in: https://preesm.github.io/
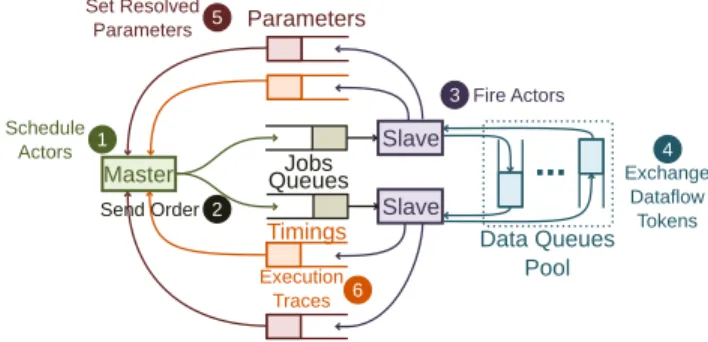
FIGURE 1. SPiDER run-time structure.
C. SPiDER
SPiDER [9] serves as a supporting tool for run-time adaptation. SPiDER is a run-time manager designed for the execution of reconfigurable PiSDF [18] applications on heterogeneous Multi-Processor System on Chips (MPSoCs) platforms.
Figure 1 presents the internal structure and behavior of SPiDER, which is composed of two types of run-times: one Global Runtime (GRT) and multiple Local Runtimes (LRTs). In Figure1, the GRT is displayed as the Master process and the LRTs are the Slave processes. The former is responsible for handling the PiSDF graph and for performing the mapping and scheduling of the dataflow actors onto the different PEs of the platform on which the application is executed. Although the main purpose of the GRT is to distribute the work among LRTs, it can also execute actors. On the other hand, LRTs are lightweight processes whose only purpose is to execute actors. LRTs can be implemented over heterogeneous types of PEs, such as general purpose or specialized processors and accelerators.
The steps of the execution scheme of SPiDER are also depicted in Figure1. First, the GRT analyzes the PiSDF graph and performs the mapping and scheduling of the different actors composing the graphÊ. From the resulting mapping and scheduling, the GRT creates jobs that are sent to the dedicated job queues of each LRT Ë, which are, in turn, associated with each PE. Specifically, a job is a message that embeds all data required to execute one instance of an actor: a job ID, location of actor data and code, and the preceding actors in the graph execution. When an LRT starts the execution of an actorÌ, it waits for the necessary data tokens to be available in the input FIFOspecified by the job message, among a pool of FIFOSÍ. On actor completion, data
tokens are written to output FIFOS.
As the PiSDF MoC can work dynamically, parameters may depend on the execution of some actors. In that case, LRTs send the new values of the parameters to the GRT in order to continue the execution of the graph. LRTs also send back execution trace information to the GRT for monitoring and debugging purposesÎ.
III. PAPIFY TOOLBOX
In this section, the PAPIFYtoolbox and its different composing resources are described. Specifically, this section is divided
FIGURE 2. PAPIFYdiagram.
into four parts: first, a general overview of PAPIFYtoolbox is outlined, stressing the main architectural changes with respect to [11]; secondly, the PAPIFY role in design time to configure application monitoring is detailed; afterwards, the use of PAPIFYat run-time is explained; finally, the PAPIFY -VIEWERtool aimed at graphically representing the monitoring information is described.
A. OVERVIEW
The objective of PAPIFY toolbox is twofold: (i) to ease the instrumentation of dataflow applications to access hardware PMC information at execution time (PAPIFY in design time, hereafter, PAPIFY-DT); (ii) to provide sufficient information
to refine workloads distribution at both design and execution times (PAPIFYin run-time, hereafter, PAPIFY-RT).
As shown in Fig.2, PAPIFYtoolbox is built on top of three
layers: application, library and hardware. Hardware, where the PMCs are found, is accessed using PAPI components. To ease its use from the application layer, a new library called eventLib has been implemented. As a result, PAPIFY
toolbox has been built on top of PAPI as a new abstraction layer which provides architecture and application isolated monitoring configuration. This new layer is able to figure automatically the monitoring after application recon-figurations and, additionally, to select a suitable user-defined monitoring when resources of different nature are employed (i.e., when using either a SW core or an FPGA). Likewise, based on this new library, PAPIFYhas been integrated with
both PREESMand SPiDER to provide them with (i) application
monitoring configuration, (ii) automatic inclusion of eventLib function calls, and (iii) performance monitoring of static and (iv) dynamic scheduling executions, as detailed further down in this section.
In comparison with the version of PAPIFYpresented in [11],
the integration of both PAPIFY and SPiDER has led to the
support of dynamic monitoring. That is, the application workload can be redistributed among the available PEs in execution time and the monitoring configuration will follow the reconfiguration.
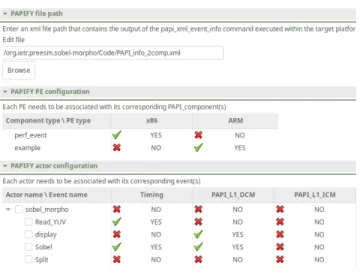
FIGURE 3. PAPIFY-PREESMUser Interface.
B. PAPIFYIN DESIGN TIME - PAPIFY-DT
The role of PAPIFY in design time is to provide the devel-oper with a straightforward methodology to (i) configure PMC-based application monitoring and (ii) automatically instrument dataflow applications independently from the tar-get platform. Regarding the new approach for the design time, two main improvements have been carried out:
• Support of heterogeneous architectures has been
included, e.g., a system in which both SW cores and an FPGA work together can be instrumented
• Instead of configuring the monitoring of the PEs, now the performance monitoring is attached to each actor. This new approach allows the monitoring to follow the actor during application reconfigurations transparently to the developer (or the system manager). This capability will be explained in SectionIII-C
In order to allow the developer to configure the PAPIFY
monitoring, a UI has been developed and included within the PREESMframework (see Fig. 3). In this interface, three different sections are required: (1) PAPIFYfile path, (2) PAPIFY
PE configuration and (3) PAPIFYactor configuration. In the first section, the PAPI monitoring information is uploaded to PAPIFY tab in PREESM using the xml file gen-erated by executing papi_xml_event_info command in the target platform. By doing so, the application can be easily developed in a workstation and, later, launched on the target platform taking into account its specific monitoring information.
Secondly, in the PAPIFY PE configuration section,
the developer can associate each type of PE (in Fig.3, x86 and ARM) to its PAPI component (in this example the PAPI components are the standard CPU component perf_event and one example component that could be replaced by any standard/custom component, e.g., an FPGA component). With this strategy, any type of architecture defined in PREESM
using the S-LAM model can be also customized in terms of supported PAPI monitoring.
Finally, as mentioned before, the monitoring of dataflow applications is now performed following an actor-wise approach. Specifically, in the PAPIFY actor configuration
section, the developer can easily associate the available PAPI events to each actor existing within the application.
As a link between design and run-time, application instru-mentation has been included within PREESMcode generation.
In this process, the user-defined monitoring configurations of PEs and actors are analyzed and the corresponding code is generated. This extra code is based on a set of function calls to a new library called eventLib that will be detailed during the next section.
C. PAPIFYIN RUN-TIME - PAPIFY-RT
After describing PAPIFY-DT objective, PAPIFY in run-time,
i.e., PAPIFY-RT, is detailed in this section. The role of this
part of the tool is to transparently apply and manage the previ-ously user-defined monitoring configuration of the dataflow application.
The new approach proposed during this work (perform-ing actor-wise monitor(perform-ing) implies, at run-time, a complete restructure of the internal behavior of eventLib compared to the previous version of PAPIFY[11]. Currently, PAPIFYis able to select, at run-time, the specific subset of PAPI events supported by the PE executing one actor of the application from the global monitoring configuration defined by the user. To provide these capabilities, eventLib is divided into three stages: configuration, start-stop and store. This scheme allows the users to divide the problem and to efficiently organize/refine the instrumentation to fit their requirements (even when the automatic code generation is not employed). Similarly, each element composing the architecture and the application is characterized with a set of parameters. Specifically, (i) each actor is associated with an actorName; (ii) each PE is linked to a PEName, a PEId and the
PAPICom-ponentName, which is the PAPI component associated with the PE; (iii) each eventSet is characterized by the number of events included (numEvents), their names (eventNames) and a generated eventSetId. It should be noted that all the IDs are unique for the PEs and eventSets so as to distinguish them at run-time.
During the configuration step, the library needs to be initialized through the use of event_init() or event_ init_multiplex(), depending on whether the user wants to enable multiplexing2or not. Additionally, not only the configuration of the monitoring is summarized in two
eventLibcalls, but also the configuration of application func-tions and architecture PEs are isolated from each other:
• configure_papify_PE(): using as input parame-ters PEName, PAPIComponentName and PEId, it sets up the PE and associates an id to the corresponding resource and PAPI component.
2Please, refer to [19], [20] for more information about event multiplexing within PAPI
• configure_papify_actor(): the input
parame-ters are PAPIComponentNames, actorName, numEvents,
eventNames, numConfigs (informing eventLib about the number of PAPI components with a valid monitoring configuration for this actor) and eventSetIds, which will be used to know the eventSets to be monitored for the associated actor in each PE type. Additionally, a PapifyInfo variable where all the monitoring infor-mation will be stored needs to be defined. During the execution of this function call, the eventSets will be analyzed, associating each event with its corresponding PAPI component, and they will be linked to the actor being monitored.
It should be noted that several actors could have the same monitoring configuration and, hence, they will share the same
eventSetIdto simplify the monitoring.
Once system monitoring has been configured, the code instrumentation follows a start-stop strategy. By doing so, the relevant parts of the application can be independently analyzed. Although having a local start-stop monitoring strat-egy increases the flexibility of what can be monitored, it also could introduce a larger overhead compared to sampling monitoring strategies.
Furthermore, the library has been built taking into account the possibility to just monitor the execution time of the application, to retrieve only hardware PMC information, or to profile the system based on both data sources. Consequently, this stage is based on four different function calls, all of them sharing the same input parameters, i.e., the PapifyInfo associated with the actor and the PEId which will execute the actor:
• event_start_papify_timing(): stores the
starting time of the actor being monitored.
• event_stop_papify_timing(): stores the
fin-ishing time of the actor being monitored.
• event_start(): in order to support dynamic
mon-itoring, this function follows Algorithm 1. As can be seen, first, it checks if the PE is currently monitoring the same eventSet and, if so (KeepCounting state), it only reads the value of the counters; if not, it stops the counting of the currently running eventSet. After that, the algorithm checks if the new eventSet has been ever monitored in this PE. In this situation, if it is the first time (FirstConfig state), it configures and launches the new eventSet but, if not, eventLib enters on the
FastSwitching state and uses a previously configured
eventSet, hence speeding up the process of changing monitoring configurations.
• event_stop(): reads the current values of the eventSet PMCs and computes the differences of corre-sponding event values.
It should be highlighted that, compared to the previous version of PAPIFY, the monitoring is now performed by dif-ferences instead of starting-stopping the PMCs every time,
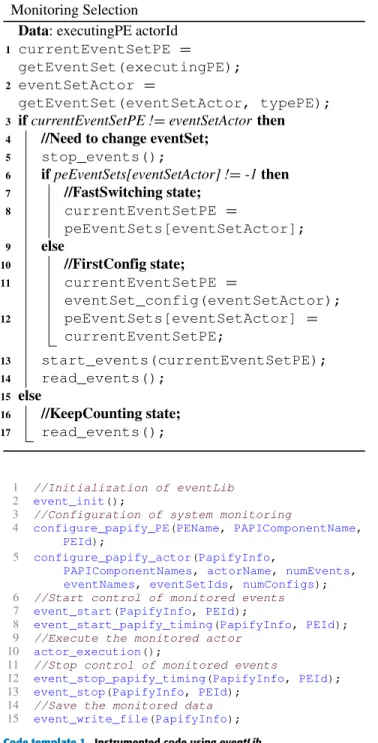
Algorithm 1: eventLib Heterogeneous and Dynamic
Monitoring Selection
Data: executingPE actorId
1 currentEventSetPE =
getEventSet(executingPE); 2 eventSetActor =
getEventSet(eventSetActor, typePE);
3 if currentEventSetPE != eventSetActor then
4 //Need to change eventSet;
5 stop_events(); 6 if peEventSets[eventSetActor] != -1 then 7 //FastSwitching state; 8 currentEventSetPE = peEventSets[eventSetActor]; 9 else 10 //FirstConfig state; 11 currentEventSetPE = eventSet_config(eventSetActor); 12 peEventSets[eventSetActor] = currentEventSetPE; 13 start_events(currentEventSetPE); 14 read_events(); 15 else 16 //KeepCounting state; 17 read_events();
Code template 1. Instrumented code using eventLib.
reducing the number of kernel interruptions and, thus, reduc-ing the overhead.
Finally, the store stage is composed of only one function, event_write_file(), which has as input parameter the
PapifyInfostructure. Currently, the performance information is written into a .csv file. However, this isolation allows the user to define its own store function to, for example, send the data directly to a resource manager (e.g., to be used for further processing and decision making towards self-adaptation).
To sum up, the code instrumentation using eventLib is shown in Code template 1. This example shows that the instrumentation of the code is based on eight function calls:
FIGURE 4. PAPIFY-SPiDER run-time structure.
one to initialize PAPI and eventLib libraries (line 2), two to configure the system monitoring (lines 4-5), four to control the actual monitoring (lines 7-8 and lines 12-13) and one to save the PMC data (line 15).
Once the run-time behavior has been described, it can be easily understood that, currently, PAPIFYis able to monitor not
only static (PREESM) dataflow applications, but also dynamic
(SPiDER) ones, where a resource manager is redistribut-ing the application workload among the available PEs at run-time. On the one hand, for the static applications, all the required eventSets will be configured during the first iteration of the application and, after that, only KeepCounting and
FastSwitching states will be reached, reducing considerably
the impact of the monitoring overhead. On the other hand, in the dynamic case, in one of the redistribution decisions taken by the resource manager, one actor can be associated for the very first time to a PE at any iteration, and PAPIFYwill react by switching to the FirstConfig state.
Additionally, including PAPIFY in the SPiDER workflow
(see Fig. 4) enables self-awareness of the current system status in SPiDER. Specifically, PAPIFY has been embedded
within the slave processes and all the PMC information is retrieved by the master process, together with the previous data.
Once this information is available in the GRT, its mapping and scheduling decisions can be improved by including hard-ware resource utilization within the workload distribution loop. However, the details behind this idea are out-of-scope of this work.
D. PAPIFY-VIEWER
Regarding the analysis of the monitoring information, to help developers in reviewing all the retrieved hardware PMC data, a visualization tool called PAPIFY-VIEWERhas been included
in the toolbox.
PAPIFY-VIEWERdisplays performance data at both
execu-tion and post-execuexecu-tion times. It has two different views: one represents actor-PE workload distribution and the other displays actor hardware utilization.
Fig.5 depicts an example of the workload distribution. As can be seen, on the right side of the image there is a legend in which each actor is associated with a different color.
FIGURE 5. PAPIFY-VIEWERworkload distribution view.
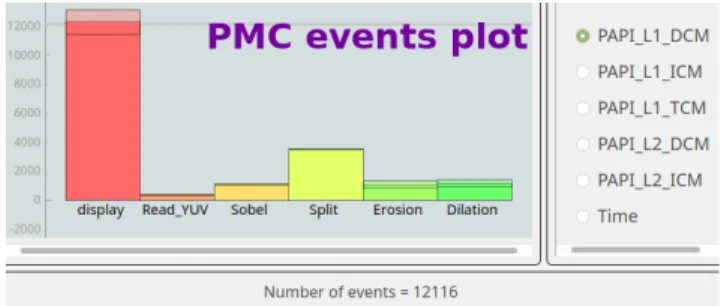
FIGURE 6. PAPIFY-VIEWERhardware utilization for PAPI_L1_DCM event view.
Likewise, the horizontal axis represents the timeline of the application execution. In the vertical axis, each core is rep-resented. Finally, actors execution is displayed as a set of rectangles, whose left and right limits are the starting and finishing times of each actor execution, respectively.
On the other hand, Fig.6displays the hardware utilization view, i.e., the amount of events associated with each actor being monitored. On the right side, the available events are shown, and, on the bottom side, all the actors are associ-ated with a column, offering this way the event information in a histogram-like view. Specifically, the average amount of events associated with each actor is graphically shown, together with a representation of their standard deviation. It should be highlighted that, if actors are configured using different eventSets, only the ones in which the selected event is being monitored will have a value. Please note that, for each view, a dynamic vertical (workload view) and horizontal (event view) line has been included to accurately check the displayed values.
IV. RESULTS: TOOL OVERHEAD CHARACTERIZATION
Relying on PAPI monitoring correctness [21], this section gathers the performance results of the monitoring of static (PREESM) and dynamic (SPiDER) dataflow applications.
Specifically, the overhead associated with the use of PAPIFY
to monitor each type of application is addressed to understand the real-time monitoring drawbacks. The results presented here have been obtained with a quad-core Intel Core i5-4440 processor running at 3.10 GHz with 8 GB of DDR3 RAM memory, under a Ubuntu 14.04 OS. It should
be noted that, in this paper, only a homogeneous architecture has been employed. The overhead of using Hw accelerators with PAPIFYis characterized in [17].
In the experiments, to study the monitoring overhead for different actor granularities, two applications widely used by PREESMdevelopers are tested, Sobel-morpho filter [22] and Stereo matching[4]. The former features simple actors (in terms of computational complexity) while the latter presents complex ones.
In order to profile the overhead associated to the use of PAPIFY, three sections are defined: (1) static dataflow appli-cations using PREESM, (2) dynamic dataflow applications managed by SPiDER and (3) PAPIFY-VIEWER monitoring overhead.
Finally, in order to analyze a wide range of possible sce-narios, three different monitoring environments compose the testbench:
1) The first one compares the application throughput (i.e., images processed per second) with and without
Timingmonitoring using PAPIFY. This test is launched for 1-Core and 4-Core configurations and compared with the experiment without instrumentation, hereafter No Monitoring (NM).
2) Secondly, the 4-Core workload and its overhead are analyzed using the events provided by PAPI. In this case, equivalent eventSets are set up for every actor within each application. Specifically, these eventSets are configured with 1, 2, 4 and 8 events each for the
1-,2-, 4- and 8-EvEq experiments, respectively, to lin-early increase the monitoring complexity.
3) Finally, as the third monitoring environment, the
8-EvEq experiment, which is considered the worst-case scenario, is compared to the 8-EvDiff configura-tion, in which the 7 first events composing each actor
eventSet match, while the 8th event is randomly cho-sen, ensuring that every eventSet is different. With this last experiment, non-uniform monitoring of dataflow applications is characterized.
To generate the eventSets, 8 PAPI events related with tim-ing and data movements have been selected. These events are the ones directly linked to the use of dataflow applica-tions, as the data communication among actors is explicitly described. These events are:
• PAPI_TOT_INS and PAPI_TOT_CYC to profile the workload distribution
• PAPI_L1_DCM, PAPI_L1_ICM and PAPI_L1_TCM to analyze the L1 cache memory usage
• PAPI_L2_DCM, PAPI_L2_ICM and PAPI_L2_TCM to
evaluate the L2 cache memory usage
Every test has been run 50 times and, to compute the throughput average, the same conditions have been consid-ered to retrieve meaningful results. To do so, the warm-up of cache memories have been excluded by removing the 10% of the highest and the 10% of the lowest throughput values.
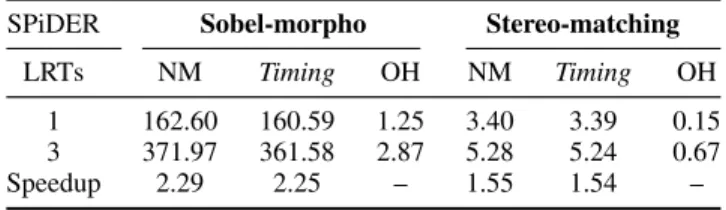
TABLE 1. Throughput (images processed per second) of Sobel-morpho and Stereo-matching static PREESMapplications using 1 and 4 cores. NM tests measure the throughput without instrumentation. Timing column gathers the throughput when profiling the application in terms of execution time. OH column represents (in %) the overhead computed as Timing divided by NM.
FIGURE 7. Overhead (in %) monitoring static PREESMapplications, compared to the no monitoring (NM) experiment. Sobel-morpho is represented in blue and Stereo-matching in red. Timing monitors only time; 1-/2-/4-/8-EvEq monitor from 1 to 8 PAPI events, considering the same events for every actor. 8-EvDiff monitors different events for each actor.
A. MONITORING STATIC DATAFLOW APPLICATIONS This part of the analysis is aimed at addressing the impact of PAPIFY-RT usage in static applications in terms of execution time overhead. Specifically, this evaluation is divided into two parts.
First, the standard C version (NM experiment) of both
Sobel-morphoand Stereo-matching applications is compared to their Timing versions, where PAPIFY is used to profile
them in terms of actor execution time. This test is run for configurations using 1 and 4 cores.
Secondly, the overhead of PAPIFY-RT when accomplishing
a deeper profile is evaluated. Using 4 cores, the NM version is compared to: (i) timing profiling (Timing); (ii) 1-/2-/4-/
8-EvEqexperiments; and (iii) 8-EvDiff, where non-uniform monitoring is considered.
In Table 1, the results of the first part of the analy-sis are gathered. As can be seen, the complexity of the
Stereo-matchingapplication is higher than the Sobel-morpho, as their NM throughput using one core are 2.67 and 168.36, respectively. Additionally, the overhead (column OH ) asso-ciated with the timing profile is around 5% for the simple application, while it is almost negligible for the complex one. This low overhead is also observed when comparing the speedup achieved for each test, as these values are almost equivalent for experiments with and without time profiling.
As a second part of the analysis, the 4-Core experiment is deeply profiled for both applications. In Fig7, the over-head (when compared to the NM configuration) associated with each type of monitoring is depicted. As can be seen, the Sobel-morpho application, which is represented as a blue line with circular markers, presents a higher impact in terms
TABLE 2.Throughput (images processed per second) of Sobel-morpho and Stereo-matching dynamic SPiDER applications using 1 and 3 LRTs, together with 1 GRT. NM measures the throughput without
instrumentation. Timing represents the throughput when profiling the application in terms of execution time. OH represents (in %) the overhead computed as Timing divided by NM.
of performance overhead than the Stereo-matching applica-tion (represented in red with triangular markers).
Specifically, Sobel-morpho, which is an application with simple actors, presents an overhead of around 5% when a tim-ing profiltim-ing (Timtim-ing experiment) is performed. Furthermore, the overhead is fixed to around 10% when monitoring the same events for every actor (1-/2-/4-/8-EvEq tests). Likewise, the 8-EvDiff, which is the worst-case scenario in which every actor has a different monitoring configuration, reaches the maximum overhead: 33%. On the other hand, monitor-ing Stereo-matchmonitor-ing, which is an application with complex actors, presents almost no impact on the system performance and the overhead is always below 1%.
Comparing these results with the results obtained in [11], it can be easily observed that the overhead has been drasti-cally reduced. In [11], the worst-case scenario was the 8-EvEq for the Sobel-morpho application with an average overhead of 67% using 4 cores. In this work, the same experiment has an overhead 6 times lower (10.34%). Likewise, the new inter-nal structure of PAPIFY-RT allows the developer to have a non-uniform application monitoring, which was not supported in the work presented in [11].
It should be noted that, considering the values retrieved from the performance monitoring, there is no difference when compared to the previous work.
B. MONITORING DYNAMIC DATAFLOW APPLICATIONS MANAGED BY SPiDER
Similarly to the analysis of static dataflow applications, this section gathers the results obtained when monitoring dynamic dataflow applications managed by SPiDER. These results are organized as in the previous section: 1) sequential and parallelized timing profiling comparison and 2) deep monitoring analysis of the parallel version. In this case, the Sobel-morpho application is exactly the same than in the PREESMcase but, on the contrary, a Stereo-matching
applica-tion version compliant with SPiDER has been employed [23]. This new version has exactly the same functionality but the dataflow specification is slightly different to fit with the new SPiDER semantics.
Concerning the first part of the study, Table 2 gathers the throughput of both applications using 1 LRT and 3 LRTs together with the GRT. Specifically, experiments with
FIGURE 8. Overhead (in %) monitoring dynamic SPiDER applications using 3 LRTs, compared to the no monitoring (NM) experiment. Sobel-morpho is represented in blue and Stereo-matching in red. Timing monitors only time; 1-, 2-, 4-, 8-EvEq monitor from 1 to 8 PAPI events, considering the same events for every actor. 8-EvDiff monitors different events for each actor.
(Timing) and without (NM) timing profile are compared. Due to the use of a GRT to control the application mapping and scheduling, there are only 3 available cores to execute the application. In this case, the Sobel-morpho application configured to use 3 LRTs is the case in which the system presents the highest overhead (2.87%). Additionally, it can be observed that the speedup reached when parallelizing the application is almost unaffected by the use of PAPIFY.
Fig8depicts the results obtained when SPiDER applica-tions are monitored using different configuraapplica-tions. As seen, the Stereo-matching application (represented in red with triangular markers) is not affected, in terms of performance, by PAPIFYmonitoring, being the maximum overhead below
1%. On the other hand, the overhead of Sobel-morpho appli-cation (represented in blue with circular markers) presents an equivalent behavior to the PREESM case. In this case, monitoring timing and equivalent eventSets for every actor have an overhead of up to 5%, while monitoring different events for each actor reaches a 17%.
C. REAL-TIME MONITORING WITH PAPIFY-VIEWER
As a final part of the analysis of PAPIFY toolbox, PAPIFY
-VIEWER is characterized in terms of overhead. This viewer,
implemented using Python, can be employed for both static and dynamic application analysis. Additionally, it can be not only used to analyze the data after the application execution, but also to study the system behavior at run-time. However, its use at run-time implies an additional overhead.
As the offline usage has no impact on the application performance and both PAPIFY-VIEWER views have already been described in SectionIII-D, this study will be focused on the overhead at run-time.
Table 3 and Table 4 present the performance and over-heads associated with the use of PAPIFY-VIEWERto monitor Sobel-morphoand Stereo-matching applications at run-time, respectively. In this case, the experiments have been carried out for the simplest monitoring (Timing) and the most com-plex one (8-EvDiff ).
As shown, the overhead associated with the use of PAPIFY
-VIEWER at run-time is high, reaching in some cases values over 50%. The rationale behind this fact is that, to perform these experiments, PAPIFY-VIEWERruns on the same platform executing the application. That is, as PAPIFY-VIEWER has to
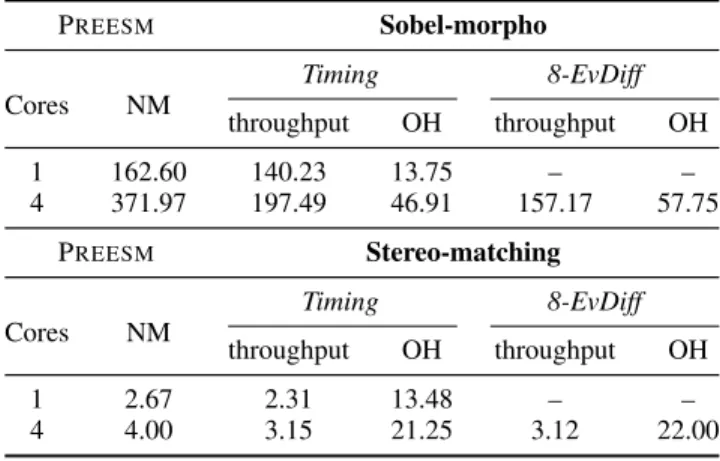
TABLE 3.Throughput (executions per second) and overhead (%) of Sobel-morpho and Stereo-matching static dataflow applications using 1 and 4 cores. NM measures the throughput without instrumentation. Timing represents the throughput when monitoring time. 8-EvDiff measures the throughput when monitoring 8 different events for each actor. OH represents (in %) the overhead computed as Timing or 8-EvDiff divided by NM values when PAPIFY-VIEWERis used at run-time.
TABLE 4.Throughput (images processed per second) and overhead (%) of Sobel-morpho and Stereo-matching dynamic dataflow applications using 1 and 3 LRT, together with the GRT. NM measures the throughput without instrumentation. Timing represents the throughput when monitoring time. 8-EvDiff measures the throughput when monitoring 8 different events for each actor. OH represents (in %) the overhead computed as Timing or 8-EvDiff divided by NM values when PAPIFY
-VIEWERis used in run-time.
be executed using the cores of the architecture, both the viewer and the application itself need to share the resources. Consequently, the system performance is reduced, especially when the level of parallelism is large, e.g., PREESMexecution
of Sobel-morpho using 4 cores. On top of that, as the system resources are shared, the impact of PAPIFY-VIEWER on the PMCs themselves can not be considered negligible.
For all these reasons, the use of PAPIFY-VIEWER at run-time is only recommended to analyze the workload distribu-tion and the specific timing of each actor.
V. DISCUSSION: OVERVIEW OF RELATED TOOLS
Once PAPIFYtoolbox has been introduced and characterized in terms of overhead, this section compares the obtained results with similar State-of-the-Art (SoA) monitoring tools. Table 5 summarizes the comparison with tools based on
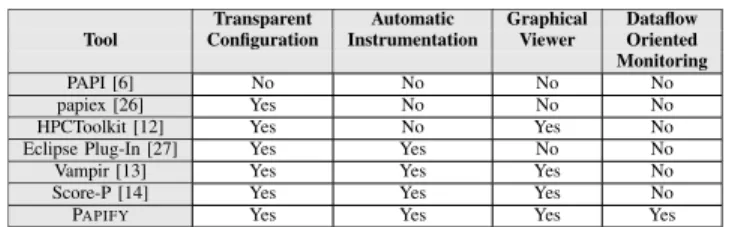
TABLE 5. State-of-the-art PAPI-based monitoring tools.
PAPI according to four aspects: Transparent Configuration,
Automatic Instrumentation, Graphical Viewer and Dataflow
Oriented Monitoring. These characteristics have been con-sidered indispensable by the authors to increase application development productivity. It should be highlighted that, con-sidering the overhead of the tools, the one obtained during the study presented in this work is equivalent to the one obtained using these other tools.
Regarding Transparent Configuration, every tool based on PAPI has provided a solution to it. To ease PAPI usage, all the tools automatically configure the application monitoring based on a set of predefined events or, as in the case of PAPIFY, using the events defined by the user.
Secondly, the Automatic Instrumentation of the application is only available in four of the tools compared. In these cases, the code required to monitor the system is included within the application while, in the rest of tools, the monitoring is performed by a standalone application running in parallel.
Considering the large amount of information that is retrieved by accessing the PMCs, the use of a graphical interface to analyze the data seems to be advisable. This char-acteristic is only addressed by four of the tools considered in this comparison.
With regard to Dataflow Oriented Monitoring, to asso-ciate the resource utilization with each part of the system execution, PAPIFYhas been integrated with both PREESMand SPiDER tools. By doing so, the analysis is performed using a dataflow oriented perspective. This methodology allows the developer to define a different type of monitoring for each part of the application. Among the tools based on PAPI, this kind of analysis is only covered by the toolbox presented in this paper.
Among the tools not based on PAPI, Turnus [24], [25] can be considered a firm competitor. This tool also covers the whole list of characteristics exposed in Table5, but the information retrieved by Turnus is related to higher levels of abstraction. That is, it bases its analysis in actor firings, data transfers and data dependencies. On the contrary, PAPIFY
not only provides an overview of the high-level in execution time (e.g., actor firings, actor timing, application timing, etc) that can be easily analyzed with PAPIFY-VIEWER, but also retrieves low-level information of the real execution of each actor, which allows the user to locate the resources acting as bottlenecks on their implementations.
VI. CONCLUSION
In this work, PAPIFYtoolbox has been presented as a set of
tools aiming at easing the profiling of dataflow applications
specified using PREESM framework. By using this tool,
developers are able to automatically instrument dataflow specifications to retrieve hardware information from the PMCs accessed through PAPI. Additionally, an extra abstrac-tion layer (eventLib) has been included where the actor per-formance monitoring continues after application workload redistribution, hence, supporting monitoring for dynamic dataflow applications.
Likewise, static and dynamic dataflow applications are used to characterize PAPIFYin terms of overhead. Moreover, it has been demonstrated that uniform monitoring of dataflow applications has a low impact in terms of execution time (overhead below 10%) for the static applications and one even lower (below 5%) when using dynamic applications. This means that the overhead when compared to previous PAPIFY
approaches has been drastically reduced, while, additionally, support for both dynamic application monitoring has been included in this work. Although results for heterogeneous platform are not included in this work, the monitoring of this kind of systems is supported now thanks to the actor-wise monitoring configuration and the run-time monitoring selection per PE.
Additionally, the information obtained using PAPIFY is graphically represented by PAPIFY-VIEWER. As a result, developers are provided with an interpretation of the PMC information, which allows them to improve their application development efficiency at design time. Even though the per-formance loss when all the processing resources are shared can reach the 50%, its use is encouraged when free proces-sors are available, as its overhead is below the 20%. This issue is only found when developing, profiling or debugging the application. In the near future, based on this run-time information collected by PAPIFY, an automatic analysis and
its corresponding decision making will be added to SPiDER to help increasing the self-awareness of the system.
Finally, PAPIFYtoolbox has been compared to several
state-of-the-art profiling tools. After this analysis, it has been demonstrated that PAPIFYis a firm competitor, as the most important features of a profiling tool are already fulfilled. Furthermore, the Dataflow Oriented Monitoring presented in this tool is an added value, as it both (i) introduces automatic monitoring of dynamic dataflow specifications and, conse-quently, (ii) enables an alternative, competitive approach to help developers in locating application bottlenecks and their sources.
REFERENCES
[1] E. A. Lee, ‘‘Cyber physical systems: Design challenges,’’ in Proc. 11th IEEE Int. Symp. Object Compon.-Oriented Real-Time Distrib. Comput. (ISORC), May 2008, pp. 363–369.
[2] B. Kienhuis, E. F. Deprettere, P. van der Wolf, and K. Vissers, ‘‘A method-ology to design programmable embedded systems,’’ in Proc. Int. Workshop Embedded Comput. Syst.Berlin, Germany: Springer, 2001, pp. 18–37. [3] H. Yviquel, A. Lorence, K. Jerbi, G. Cocherel, A. Sanchez, and M. Raulet,
‘‘Orcc: Multimedia development made easy,’’ in Proc. 21st ACM Int. Conf. Multimedia, Oct. 2013, pp. 863–866.
[4] M. Pelcat, K. Desnos, J. Heulot, C. Guy, J.-F. Nezan, and S. Aridhi, ‘‘Preesm: A dataflow-based rapid prototyping framework for simplifying multicore DSP programming,’’ in Proc. 6th Eur. Embedded Design Educ. Res. Conf. (EDERC), Sep. 2014, pp. 36–40.
[5] B. Pagano, C. Pasteur, G. Siegel, and R. Knížek, ‘‘A model based safety critical flow for the aurix multi-core platform,’’ in Proc. Embedded Real-Time Softw. Syst. (ERTS), 2018, pp. 1–10.
[6] D. Terpstra, H. Jagode, H. You, and J. Dongarra, ‘‘Collecting performance data with PAPI-C,’’ in Tools for High Performance Computing. Berlin, Germany: Springer, 2010, pp. 157–173.
[7] R. Ren, E. Juarez, C. Sanz, M. Raulet, and F. Pescador, ‘‘Energy estima-tion models for video decoders: Reconfigurable video coding-CAL case-study,’’ IET Comput. Digit. Techn., vol. 9, no. 1, pp. 3–15, Jan. 2014. [8] R. Ren, J. Wei, E. Juarez, M. Garrido, C. Sanz, and F. Pescador, ‘‘A
PMC-driven methodology for energy estimation in RVC-CAL video codec spec-ifications,’’ Image Commun., vol. 28, no. 10, pp. 1303–1314, Nov. 2013. [9] J. Heulot, M. Pelcat, K. Desnos, J.-F. Nezan, and S. Aridhi, ‘‘Spider:
A synchronous parameterized and interfaced dataflow-based RTOS for multicore DSPS,’’ in Proc. 6th Eur. Embedded Design Educ. Res. Conf. (EDERC), Sep. 2014, pp. 167–171.
[10] M. Masin, F. Palumbo, H. Myrhaug, J. A. de Oliveira Filho, M. Pastena, M. Pelcat, L. Raffo, F. Regazzoni, A. A. Sanchez, A. Toffetti, E. de la Torre, and K. Zedda, ‘‘Cross-layer design of reconfigurable cyber-physical systems,’’ in Proc. Design, Automat. Test Eur. Conf. Exhib. (DATE), Mar. 2017, pp. 740–745. [Online]. Available: https://www.cerbero-h2020.eu/wp-content/uploads/2017/10/date17-CERBERO-v1.0.pdf
[11] D. Madroñal, A. Morvan, R. Lazcano, R. Salvador, K. Desnos, E. Juáre, and C. Sanz, ‘‘Automatic instrumentation of dataflow applications using PAPI,’’ in Proc. 15th ACM Int. Conf. Comput. Frontiers, 2018, pp. 232–235.
[12] L. Adhianto, S. Banerjee, M. Fagan, M. Krentel, G. Marin, J. Mellor-Crummey, and N. R. Tallent, ‘‘HPCTOOLKIT: Tools for performance analysis of optimized parallel programs,’’ Concurrency Comput., Pract. Exper.-Scalable Tools High-End Comput., vol. 22, no. 6, pp. 685–701, Apr. 2010.
[13] A. Knüpfer, H. Brunst, J. Doleschal, M. Jurenz, M. Lieber, H. Mickler, M. S. Müller, and W. E. Nagel, ‘‘The vampir performance analysis tool-set,’’ in Proc. 11th Int. Workshop Parallel Tools High Perform. Comput., 2008, pp. 139–155.
[14] M. Schlütter, B. Mohr, L. Morin, P. Philippen, and M. Geimer, ‘‘Profiling hybrid HMPP applications with score-P on heterogeneous hardware,’’ in Proc. Int. Conf. Parallel Comput., 2014, pp. 773–782.
[15] A. Haidar, H. Jagode, A. YarKhan, P. Vaccaro, S. Tomov, and J. Dongarra, ‘‘Power-aware computing: Measurement, control, and performance anal-ysis for Intel Xeon Phi,’’ in Proc. IEEE High Perform. Extreme Comput. Conf. (HPEC), Sep. 2017, pp. 1–7.
[16] E. A. Lee and D. G. Messerschmitt, ‘‘Synchronous data flow,’’ Proc. IEEE, vol. 75, no. 9, pp. 1235–1245, Sep. 1987.
[17] L. Suriano, A. Rodriguez, K. Desnos, M. Pelcat, and E. de la Torre, ‘‘Anal-ysis of a heterogeneous multi-core, multi-hw-accelerator-based system designed using PREESM and SDSoC,’’ in Proc. 12th Int. Symp. Recon-figurable Commun.-Centric Syst.-Chip (ReCoSoC), Jul. 2017, pp. 1–7. [18] K. Desnos, M. Pelcat, J.-F. Nezan, S. S. Bhattacharyya, and S. Aridhi,
‘‘PiMM: Parameterized and interfaced dataflow meta-model for MPSoCs runtime reconfiguration,’’ in Proc. Int. Conf. Embedded Comput. Syst., Archit., Modeling, Simulation (SAMOS), Jul. 2013, pp. 41–48.
[19] R. V. Lim, D. Carrillo-Cisneros, W. Alkowaileet, and I. Scherson, ‘‘Com-putationally efficient multiplexing of events on hardware counters,’’ in Proc. Linux Symp., 2014, pp. 101–110.
[20] J. Dongarra, K. London, S. Moore, P. Mucci, and D. Terpstra, ‘‘Using PAPI for hardware performance monitoring on linux systems,’’ in Proc. Conf. Linux Clusters, HPC Revolution, vol. 5, 2001, pp. 1–11.
[21] W. Korn, P. J. Teller, and G. Castillo, ‘‘Just how accurate are perfor-mance counters?’’ in Proc. IEEE Int. Perform., Comput., Commun. Conf., Apr. 2001, pp. 303–310.
[22] G. Georgakarakos, S. Kanur, J. Lilius, and K. Desnos, ‘‘Task-based execu-tion of synchronous dataflow graphs for scalable multicore computing,’’ in Proc. IEEE Int. Workshop Signal Process. Syst. (SiPS), Oct. 2017, pp. 1–6. [23] J. Heulot, J. Menant, M. Pelcat, J.-F. Nezan, L. Morin, M. Pressigout, and S. Aridhi, ‘‘Demonstrating a dataflow-based RTOS for heterogeneous MPSoC by means of a stereo matching application,’’ in Proc. DASIP, Oct. 2014, pp. 1–2.
[24] ‘‘Analysis and optimization of dynamic dataflow programs,’’ Ph.D. disser-tation, École Polytechnique Fédérale de Lausanne, Lausanne, Switzerland, 2015.
[25] S. Casale-Brunet, M. Mattavelli, and J. W. Janneck, ‘‘TURNUS: A design exploration framework for dataflow system design,’’ in Proc. IEEE Int. Symp. Circuits Syst. (ISCAS), May 2013, p. 654.
[26] P. J. Mucci, ‘‘PapiEx-execute arbitrary application and measure hardware performance counters with PAPI,’’ Innov. Comput. Lab., Univ. Tennessee, Knoxville, TN, USA, 2007.
[27] F. G. Tinetti and M. Méndez, ‘‘An automated approach to hardware per-formance monitoring counters,’’ in Proc. Int. Conf. Comput. Sci. Comput. Intell. (CSCI), Mar. 2014, pp. 71–76.
DANIEL MADROÑAL received the B.Sc. degree in communication electronics engineering and the M.Sc. degree in systems and services engi-neering for the information society from Uni-versidad Politécnica de Madrid (UPM), Spain, in 2014 and 2015, respectively, where he is cur-rently pursuing the Ph.D. degree in systems and services engineering for the information society with the Electronic and Microelectronic Design Group (GDEM). In 2015, he was with the National Institute of Applied Sciences (INSA), France, as an Interchange Student of the M.Sc. degree. He is the author or coauthor of nine indexed jour-nals and 18 contributions to technical conferences. His research interests include high-performance multi- and many-core processing systems, real-time hyperspectral image processing, and the automatic optimization of the energy consumption in high-performance systems.
FLORIAN ARRESTIER received the Engineering degree in electronics and computer engineering from the National Institute of Applied Sciences in Rennes (INSA), in 2017. He is currently pur-suing the Ph.D. degree in electrical and computer engineering with the Institute of Electronics and Telecommunications of Rennes (IETR) Laboratory.
JAIME SANCHO received the B.Sc. degree in telecommunication engineering and the M.Sc. degree in systems and services engineering for the information society from Universidad Politéc-nica de Madrid (UPM), Spain, in 2017 and 2018, respectively, where he is currently pursuing the Ph.D. degree in systems and services engineering for the information society with the Electronic and Microelectronic Design Group (GDEM). His research interests include high-performance graphics processing systems, real-time hyperspectral image processing, and inmersive computer vision applications.
ANTOINE MORVAN received the M.Sc. degree in computer science from the University of Rennes 1, in 2009, and the degree from Ecole Nor-male Suprieure of Cachan—Antenne de Bretagne, in 2013. He then worked on his Ph.D. thesis about Polyhedral Compilation for High-Level Synthesis in the CAIRN team at IRISA, Rennes, France. He is currently a full-time Research Engineer on the Cerbero Project within the VAADER Team with IETR—INSA, Rennes. His main activities consist in maintaining the PREESM tool and integrating the tool in the project toolchain. His interests include program transformation and design productivity, and ranging from hardware design to software optimisations, including code quality aspects.
RAQUEL LAZCANO received the B.Sc. degree in communication electronics engineering and the M.Sc. degree in systems and services engineer-ing for the information society from the Uni-versidad Politécnica de Madrid (UPM), Spain, in 2014 and 2015, respectively, where she is cur-rently pursuing the Ph.D. degree in systems and services engineering for the information society with the Electronic and Microelectronic Design Group (GDEM). In 2015, she was with the Insti-tute of Electronics and Telecommunications of Rennes (IETR), National Institute of Applied Sciences (INSA), France, as an Interchange Student of the M.Sc. degree. She is the author or coauthor of nine indexed journals and 17 contributions to technical conferences. Her research interests include high-performance multicore processing systems, real-time hyperspectral image processing, and the automatic optimization of the parallelism in real-time systems.
KAROL DESNOS received the Ph.D. degree in signal and image processing from the INSA Rennes, in 2014. Since 2011, he contributes to the development of the PREESM open-source rapid prototyping. In fall 2012, he was a Visit-ing Researcher with the University of Maryland, DSPCAD Research Group led by Pr. Shuvra Bhattacharyya. Since 2015, he has given an invited Lecturers with INSA Euromediterranee (Fés, Morocco), Universidad Politecnica de Madrid, Madrid, Spain, and the University of Rennes 1. He is currently an Asso-ciate Professor with the National Institute of Applied Science (INSA) of Rennes. He holds a joint appointment with the Institute of Electronics and Telecommunications of Rennes (IETR). This work was Co-Supervised by the Pr. Jean-François Nezan and Dr. Maxime Pelcat from the IETR, and by Dr. Slaheddine Aridhi from Texas Instruments, France. He has coauthored more than 20 articles in peer-reviewed international journals and conferences. His research interests include dataflow models of compu-tation and associated implemencompu-tation techniques for the rapid prototyping of applications running on heterogeneous MPSoCs. In particular, his Ph.D. thesis focuses on the memory characterization and optimization of dataflow applications on MPSoCs. He has been actively involved in several projects including H2020 Project (CERBERO), French ANR Projects (COMPA, ARTEFACT), U.S. NSF Project (COMPACTS-SL-MODELS), and a young researcher project funded by the French research society ‘‘GdR ISIS’’ (MORDRED), which he leads. He took part in the creation of the MTAPI standard with the Multicore Association. He has served as a member for the technical program committee of three international conferences (SiPS, DASIP, and ASR-MOV).
RUBEN SALVADOR holds a Ph.D. degree in elec-trical and computer engineering from the Uni-versidad Politécnica de Madrid (UPM). He was a Research Assistant with the Center of Indus-trial Electronics (CEI-UPM), from 2006 to 2011, and with the Intelligent Vehicle Systems Divi-sion, University Institute for Automobile Research (INSIA-UPM), from 2005 to 2006. In 2009, he was a Visiting Research Student with the Depart-ment of Computer Systems, Brno University of Technology. In 2017, he was a Visiting Professor with IETR/INSA Rennes. He is currently an Assistant Professor with the Department of Telematics and Electronics Engineering, Universidad Politécnica de Madrid (UPM), and a Researcher Associated with the Center on Software Technolo-gies and Multimedia Systems for Sustainability (CITSEM-UPM). He is the author/coauthor of around 40 peer-reviewed publications in interna-tional journals/conferences
and one book chapter. He has participated in nine EU/national research projects and nine industrial projects. His research interests include high performance and self-adaptive computer systems, with a particular focus in the design of reconfigurable and parallel heterogeneous accelerators for embedded systems. Applications of his work have included evolvable hard-ware for systems self-adaptation in harsh environments and acceleration of machine learning applied to hyperspectral image processing for cancer detection. He serves as a TPC member for various international conferences and acts as a Reviewer in a number of international journals/conferences.
DANIEL MENARD received the Ph.D. and HDR (habilitation to conduct researches) degrees in signal processing and telecommunications from the University of Rennes, in 2002 and 2011, respectively. He is currently a Professor with the Electronics and Computer Engineering (ECE) Department, INSA-Rennes (graduate engineering school). From 2003 to 2012, he was an Associate Professor with the ECE Department, University of Rennes Engineering School, ENSSAT. He is also the author of more than 80 international papers distributed in the areas of embedded systems, computer-aided design, and arithmetic and signal pro-cessing. His research interests include implementation of image and signal processing applications in embedded systems, approximate computing, fixed point arithmetic, low power systems, and video compression. He is also a member of the IETR/CNRS Laboratory and IRISA/INRIA Laboratory.
EDUARDO JUAREZ received the Ph.D. degree from the École Polytechnique Fédérale de Lau-sanne (EPFL), in 2003. From 1994 to 1997, he was a Researcher with the Digital Architec-ture Group, Universidad Politécnica de Madrid (UPM), and he was a Visiting Researcher with the École Nationale Supérieure des Télécommunica-tions (ENST), Brest, France, and the University of Pennsylvania, Philadelphia, USA. From 1998 to 2000, he was an Assistant with the Integrated Sys-tems Laboratory (LSI), EPFL. From 2000 to 2003, he was a Senior SysSys-tems Engineer with the Design Centre of Transwitch Corporation, Switzerland, while continuing his research toward the Ph.D. at EPFL. He has held a post-doctoral position with the Grupo de Diseño Electrónico y Microelectrónico (GDEM), UPM, in December 2004. Since 2007, he has been an Assistant Professor with UPM. He is the coauthor of one book and author or coau-thor of more than 50 papers and contributions to technical conferences. He has participated in 12 competitive research projects and 19 noncom-petitive industrial projects. His research activity interests include solving, from a holistic perspective and the power/energy consumption optimization problem of embedded systems, automatic parallelism extraction in dataflow specifications, and hyperspectral imaging for health applications. In 2011, he became a member of the Researcher Center on Software Technologies and Multimedia Systems (CITSEM) of UPM.
CESAR SANZ received the Ph.D. degree from the Universidad Politécnica de Madrid (UPM), Madrid, Spain, in 1998. He was the Director of the ETSIS de Telecomunicación. Since 2013, he has been a Researcher with CITSEM. He is currently a Full Professor with the ETSIS de Telecomu-nicación, UPM. In addition, he leads the Elec-tronic and MicroelecElec-tronic Design Group, UPM, involved in Research and Development Projects. His current research interest includes microelec-tronic design applied to real-time image processing.