HAL Id: tel-01186321
https://tel.archives-ouvertes.fr/tel-01186321
Submitted on 24 Aug 2015
HAL is a multi-disciplinary open access
archive for the deposit and dissemination of sci-entific research documents, whether they are pub-lished or not. The documents may come from teaching and research institutions in France or abroad, or from public or private research centers.
L’archive ouverte pluridisciplinaire HAL, est destinée au dépôt et à la diffusion de documents scientifiques de niveau recherche, publiés ou non, émanant des établissements d’enseignement et de recherche français ou étrangers, des laboratoires publics ou privés.
Profiling professional and regular users on popular
Internet services based on implementation of large scale
Internet measurement tools
Reza Farahbakhsh
To cite this version:
Reza Farahbakhsh. Profiling professional and regular users on popular Internet services based on implementation of large scale Internet measurement tools. Networking and Internet Architecture [cs.NI]. Institut National des Télécommunications, 2015. English. �NNT : 2015TELE0012�. �tel-01186321�
Doctor of Philosophy (PhD) Thesis
Institut Mines Telecom, Telecom SudParis
and Universit´
e Pierre & Marie Curie - Sorbonne Universit´
es
Specialization
COMPUTER
NETWORKS
presented by
Reza Farahbakhsh
Profiling professional and regular users
on popular Internet services based on
Implementation of large scale Internet measurement tools
21th May 2015Thesis no: 2015TELE0012
Committee:
David Hausheer Reviewer Professor, TU Darmstadt, Germany
Danny De Vleeschauwer Reviewer Assoc. Professor/Senior Researcher, UGent/Alcatel-Lucent - Belgium Pierre Sens Examiner Professor, UPMC - Sorbonne Universit´es - France
Xiaoming Fu Examiner Professor, University of Goettingen - Germany Nishanth Sastry Examiner Professor, Kings College London - UK
Jean-Michel Portugal Examiner Area Director, Orange Labs - France
Leandros A. Maglaras Invited Assoc. Professor, De Montfort University - UK
No¨el Crespi Advisor Professor, Institut Mines Telecom/Telecom SudParis - France ´
Th`
ese de Doctorat (PhD) de
Institut Mines Telecom, Telecom SudParis et l’universit´
e
Pierre & Marie Curie - Sorbonne Universit´
es
Sp´ecialit´e
SYST`
EMES INFORMATIQUES
pr´esent´ee par
Reza Farahbakhsh
Profilage d’usagers professionnels et non-professionnels
de services Internet bas´
es sur l’impl´
ementation d’outils de
mesure Internet ´
a grande ´
echelle
21th May 2015Th´ese no : 2015TELE0012
Jury compos´e de :
David Hausheer Rapporteur Professeur, TU Darmstadt, Germany
Danny De Vleeschauwer Rapporteur Maˆıtre de Conf´erences/Chercheur, UGent/Alcatel-Lucent-Belgium Pierre Sens Examinateur Professeur, UPMC - Sorbonne Universit´es - France
Xiaoming Fu Examinateur Professeur, University of Goettingen - Germany Nishanth Sastry Examinateur Professeur, Kings College London - UK
Jean-Michel Portugal Examinateur Directeur Terrain de Conqu´ete, Orange Labs - France Leandros A. Maglaras Invit´e Maˆıtre de Conf´erences, De Montfort University - UK No¨el Crespi Directeur de Th´ese Professeur, Institut Mines Telecom - France
´
Declaration
This Thesis :
- is the result of my own research work and contains nothing which is outcome of work other studies except where specifically indicated in the text by references.
- has not previously been submitted for a degree or diploma, or other qualification at any other university.
Reza Farahbakhsh May 2015
Dedication
To My Family
Acknowledgements
This thoroughly enjoyable research is largely a result of the interaction that I have had with my supervisor Prof. No¨el Crespi who I feel very privileged to have worked with him. I owe a great debt of gratitude for his patience, support, inspiration and friendship. I owe my gratitude to my Co-Supervisor, ´Angel Cuevas. I received his personal support and I would like to thank him for his continuous efforts to show me the path to follow. Sincere thanks to both of them for having always been there to listen to and comment upon whatever I had thought out or wanted to discuss about and patiently reviewing all my work.
This thesis would not have been possible without many collaborative efforts and sup-port of a lot of people whose help has been fundamental during the years of my PhD, especially Ruben Cuevas, Reza Rejaie, Xiao Han, Roberto Gonzales and Reza Motamedi. I would like also thank Walter Willinger, Bruce Maggs, Elie Najm, Djamal Zeghlache and Joerg Widmer, who gave me constructive comments on different presented studies in the manuscript. I also would like thank the reviewers of my thesis who patiently read this dis-sertation ; Prof. David Hausheer and Prof. Danny De Vleeschauwer and many thanks go to Prof. Pierre Sens for serving as the chairman of the jury committee and other member of the committee including Prof Xiaoming Fu, Mr. Jean-Michel Portugal and Prof. Nishanth Sastry.
A special thank to all my colleagues (and former colleagues) in Service Architecture Lab (SAL) at TSP specially Rebecca Copeland for her constructive comments on my ma-nuscript.
During my Phd I had a great chance to be involved in two international projects, FP7 eCOUSIN and ITEA TWIRL, and I would like also to address special thanks for people who were involved in.
Finally, I would like to express my deep gratitude to my family and friends, and espe-cially my parents, for their love and support during the ups and downs of graduate school. I am grateful beyond words for all that they have given me.
Reza Farahbakhsh May 2015
Abstract
Popular Internet services are fundamentally shaping and reshaping the traditional ways of people communication, thus having a major impact on their social life. Two of the very popular Internet services with this characteristic are Online Social Networks (OSNs) and Peer-to-Peer (P2P) systems. OSNs provide a virtual environment where people can share their information and interests as well as being in contact with other people. On the other hand, P2P systems, which are still one of the popular services with a large proportion of the whole Internet traffic, provide a golden opportunity for their customers to share different type of content including copyrighted content.
Apart from the huge popularity of OSNs and P2P systems among regular users, they are being intensively used by professional players (big companies, politician, athletes, celebrities in case of OSNs and professional content publishers in case of P2P) in order to interact with people for different purposes (marketing campaigns, customer feedback, public reputation improvement, etc.).
In this thesis, we characterize the behavior of regular and professional users in the two mentioned popular services (OSNs and P2P systems) in terms of publishing strategies, content consumption and behavioral analysis. To this end, five of our conducted studies are presented in this manuscript as follows:
• “The evolution of multimedia contents”, which presents a thorough analysis on the
evolution of multimedia content available in BitTorrent by focusing on four relevant metrics across different content categories: content availability, content popularity, content size and user’s feedback.
• “The reaction of professional users to antipiracy actions”, by examining the impact
of two major antipiracy actions, the closure of Megaupload and the implementation of the French antipiracy law (HADOPI), on professional publishers behavior in the largest BitTorrent portal who are major providers of online copyrighted content.
• “The amount of disclosed information on Facebook”, by investigating the public
exposure of Facebook users’ profile attributes in a large dataset including half million regular users.
• “Professional users Cross Posting Activity”, by analyzing the publishing pattern of
professional users which includes same information over three major OSNs namely Facebook, Google+ and Twitter.
12
• “Professional Users’ Strategies in OSNs”, where we investigate the global strategy
of professional users by sector (e.g., Cars companies, Clothing companies, Politician, etc.) over Facebook, Google+ and Twitter.
The outcomes of this thesis provide an overall vision to understand some important behavioral aspects of different types of users on popular Internet services and these contri-butions can be used in various domains (e.g. marketing analysis and advertising campaign, etc.) and different parties can benefit from the results and the implemented methodologies such as ISPs and owners of the Services for their future planning or expansion of the current services as well as professional players to increase their success on social media.
Keywords
Online Social Networks, User Behavior Analysis, Content Consumption, Publishing Strate-gies, Facebook, Google+, Twitter, Peer-to-Peer (P2P), BitTorrent, Privacy.
Table of contents
1 Introduction 21
1.1 Motivation . . . 22
1.2 Thesis Contributions . . . 23
1.2.1 Summary of the main outcomes . . . 23
1.2.2 Measurement Methodologies . . . 25
1.2.3 Implemented Large Scale Measurement Tools . . . 26
1.2.4 Available Datasets . . . 26
1.2.4.1 Ethics Considerations . . . 27
1.3 Publication List . . . 28
1.4 Structure of the Thesis . . . 30
2 State of the Art 33 2.1 Summary . . . 34
2.2 Internet applications Characterizations . . . 34
2.2.1 Social Networks . . . 34
2.2.2 Peer-to-Peer . . . 36
2.3 Large scale measurement tools implementation . . . 37
2.3.1 Social Networks . . . 37
2.3.2 Peer-to-Peer . . . 37
2.4 Conclusion . . . 37
3 Profiling regular and professional users in BitTorrent 39 3.1 Summary . . . 40
3.2 Evolution of multimedia content in the Internet through BitTorrent glasses 41 3.2.1 Introduction . . . 41
3.2.2 Background . . . 42
3.2.3 Related Work . . . 43
3.2.4 Measurement Methodology . . . 43
3.2.5 Content Evolution Analysis . . . 44
3.2.5.1 Content Availability Evolution . . . 44
3.2.5.2 Content Popularity Evolution . . . 46 15
16 TABLE OF CONTENTS
3.2.5.3 Content Availability Vs Content Popularity Discussion . . 48
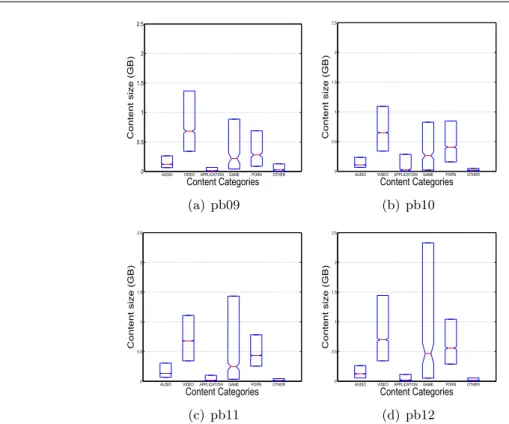
3.2.6 BitTorrent’s Content Size Analysis . . . 49
3.2.6.1 Aggregate Content Size Distribution . . . 49
3.2.6.2 Content Size per Category . . . 50
3.2.6.3 Content Size Increment Discussion and Implications . . . . 51
3.2.7 User Comments on BitTorrent Contents . . . 52
3.2.8 Conclusion . . . 53
3.3 Reaction of BitTorrent Content Publishers to Antipiracy Actions . . . 55
3.3.1 Introduction . . . 55
3.3.2 Related Work . . . 57
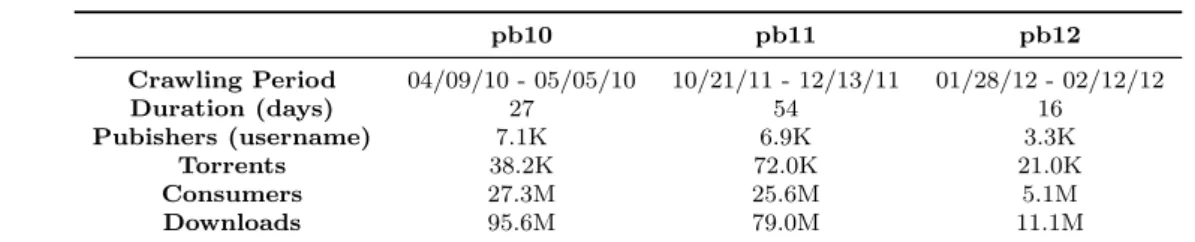
3.3.3 Data Collection and Datasets . . . 58
3.3.3.1 Background on The Pirate Bay . . . 59
3.3.3.2 An Overview of the Measurement Methodology . . . 59
3.3.3.3 Datasets . . . 60
3.3.4 Effect of a Global Antipiracy Event . . . 60
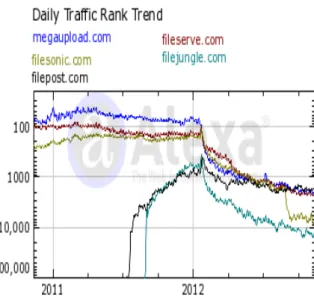
3.3.4.1 The Closure of Megaupload . . . 61
3.3.4.2 Effect on BitTorrent Publishers Activity . . . 62
3.3.5 Effect of a Local Antipiracy Law . . . 67
3.3.5.1 Effect on Publishers Activity . . . 69
3.3.6 Conclusions . . . 72
4 Profiling regular and professional in major Online Social Networks 75 4.1 Summary . . . 77
4.2 Analysis of publicly disclosed information in Facebook profiles . . . 78
4.2.1 Introduction . . . 78
4.2.2 Related work . . . 80
4.2.3 Data Collection and Attributes Definition . . . 82
4.2.4 Public exposure of Facebook profile attributes . . . 83
4.2.4.1 Degree of attributes disclosure . . . 83
4.2.4.2 Correlation of Facebook Attributes . . . 85
4.2.5 Public Exposure of Facebook Users . . . 87
4.2.6 Examples of Public Facebook Information Usage . . . 88
4.2.6.1 Gender attribute: Men vs. Women public exposure . . . . 89
4.2.6.2 Age distribution analysis . . . 90
4.2.6.3 CurrentCity population analysis . . . 91
4.2.7 Conclusion . . . 93
4.3 Cross-posting activity of professional users across Facebook, Twitter and Google+ . . . 94
4.3.1 Introduction . . . 94
4.3.2 Related Work . . . 96
4.3.3 Data Collection Methodology . . . 97
4.3.3.1 Methodology to Identify Cross-posts . . . 99
4.3.4 Cross-Posting Characterization . . . 102
TABLE OF CONTENTS 17
4.3.4.2 Inter-OSN Cross-Posting . . . 104
4.3.4.3 Engagement Analysis . . . 104
4.3.5 Preference of Professional Publishers . . . 106
4.3.5.1 OSN-based Analysis . . . 106
4.3.5.2 User-based Analysis . . . 108
4.3.6 Cross-posting Behavioural Patterns . . . 109
4.3.6.1 Cross-Posting behaviour based on Preference . . . 110
4.3.6.2 Cross-Posting behaviour based on Inter-Posting Interval . . 111
4.3.7 Conclusions . . . 113
4.4 Characterization of Professional Users’ Strategies in major OSNs . . . 115
4.4.1 Introduction . . . 115
4.4.2 Related Work . . . 117
4.4.3 Dataset . . . 118
4.4.4 Detection of Common Strategies by Sectors . . . 119
4.4.4.1 Metrics to Capture the Behaviour . . . 119
4.4.4.2 Identifying Categories Whose Users Present a Similar Strategy120 4.4.4.3 Similarity Between Categories’ Behaviour . . . 123
4.4.5 Unveiling Strategies . . . 124
4.4.5.1 Evaluation of Strategies Success . . . 127
4.4.5.2 Methodology to Measure the Success Degree of Strategies . 127 4.4.5.3 Discussion of Strategies’ Success . . . 129
4.4.6 Conclusions . . . 130
5 Conclusion and Future Work 133 5.1 Conclusion . . . 134
5.1.1 Summary of Contributions . . . 134
5.1.2 Impact on the Community . . . 136
5.2 Ongoing and future work . . . 136
5.2.1 Ongoing and future work on Social Network . . . 136
5.2.1.1 Characterizing Group-Level User Behavior in Major Online Social Networks . . . 136
5.2.1.2 Facebook Network Architecture Analysis, How Far is Face-book from Me! . . . 137
5.2.1.3 Community Similarity Degree: Community Selection for Community Recommendation . . . 138
5.2.1.4 Real life Change effect on the Facebook Profile Attributes information . . . 138
5.2.1.5 Popularity Trend Analysis of Professional Users in Facebook 138 5.2.2 Ongoing and future work on P2P networks . . . 139 5.2.2.1 Film Factory Losses: Is BitTorrent a Major Responsible? . 139
References 141
18 TABLE OF CONTENTS
Chapter
1
Introduction
Contents
1.1 Motivation . . . . 22 1.2 Thesis Contributions . . . . 23 1.2.1 Summary of the main outcomes . . . 23 1.2.2 Measurement Methodologies . . . 25 1.2.3 Implemented Large Scale Measurement Tools . . . 26 1.2.4 Available Datasets . . . 26 1.3 Publication List . . . . 28 1.4 Structure of the Thesis . . . . 30
22 1.1. MOTIVATION
1.1
Motivation
The rapid expansion of Online Social Networks (OSN) has made a profound influence on our global community’s communication patterns especially on the Internet which tends to reshape its utility and even the future design of it. This exponentially increasing number of users of social network services such as Facebook, Google+ and Twitter is creating a potentially dramatic change in people behavior and is bringing a huge change on traditional industries of content, media, and communications.
On the other hand, Peer-to-Peer services (P2P) are still getting a significant part of the whole Internet traffic and with the huge growth of end-users accessibility in terms of bandwidth, new type of services based on P2P technologies attract their customers by providing updated services such as online TV and games based on P2P phenomena.
In this era, different group of users are utilizing those services both from regular and normal users to very professional users with clear business strategies behind their activities. Regular users are getting the basic services from BitTorrent such as download the available contents and rarely share contents with others as well as doing normal activities in social networks such as building personal profiles, share posts in the profile and follow their friends and interests. On the other hand, professional users are benefiting from these popular internet services with other strategic goals. In term of BitTorrent, there are many professional users that actively publish contents (mostly copyrighted contents) and try to attract regular users to their activities. In social networks, the presence of professional users from different sectors is noticeable and there are provided services for those type of users, such as “Fan Page” in Facebook.
Analysing the behavior of users in each of these two systems is an important track of research in different communities from ISPs’ Internet architecture designers to business and management sectors. Having the knowledge from end-users interests and predicting their behavior provide the opportunity to target right communities of users for different aspects such as advertising and recommendation systems.
The main goal of this thesis is to analyze the professional and regular user’s behavior in these two main arena of Internet, online social networks and Peer-to-Peer systems. To this end, we study some aspects of professional and regular users behavior such as their content consumption, publishing strategies.
CHAPTER 1. INTRODUCTION 23
1.2
Thesis Contributions
The contributions and innovations of this thesis can be categorized in four parts: i) Main Outcomes, ii) Measurement Methodologies, iii) Implemented Measurement Tools, and iv) Available Datasets. Next, a summary of each mentioned categories will be presented.
1.2.1 Summary of the main outcomes
This part presents a summary of different studies that is presented in this manuscript as the main outcomes of this thesis. In P2P domain, the main focus is on “ThePirateBay” which is one the most popular bit-torrent portals and we study two group of users; i. Regular users who use this system to download contents and ii. Professional users who are content publishers with business strategies behind their activities. Next we present a short abstraction of the two studies in this domain:
• Multimedia Evolution on P2P: Today’s Internet traffic is mostly dominated by
multimedia content and the prediction is that this trend will intensify in the fu-ture. Therefore, main Internet players, such as ISPs, content delivery platforms (e.g. Youtube, BitTorrent, Netflix, etc.) or CDN operators, need to understand the evolution of multimedia content availability and popularity in order to adapt their infrastructures and resources to satisfy clients requirements while they minimize their costs. This study presents a thorough analysis on the evolution of multimedia content available in BitTorrent. Specifically, we analyze the evolution of four relevant metrics across different content categories: content availability, content popularity, content size and user’s feedback. To this end we leverage a large-scale dataset formed by four snapshots collected from the most popular BitTorrent portal, namely The Pirate Bay, between Nov. 2009 and Feb. 2012. Overall our dataset is formed by more than 160k content that attracted more than 185M of download sessions.
• Reaction to Antipiracy actions: Based on the economic and social impact of
copyrighted content infringement in recent years, few countries have put in place online antipiracy laws and there have been some major enforcement actions against violators. This raises the question to what extent antipiracy actions have been effective
in deterring online piracy? This is a challenging issue to explore because it is difficult
to capture user behavior, and to identify the subtle effect of various underlying (and potentially opposing) causes. In this study, we tackle this question by examining the impact of two major antipiracy actions, the closure of Megaupload and the imple-mentation of the French antipiracy law, on publishers in the largest BitTorrent portal who are major providers of copyrighted content online. We capture snapshots of
Bit-24 1.2. THESIS CONTRIBUTIONS
Torrent publishers at proper times relative to the targeted antipiracy event and use the trends in the number and the level of activity of these publishers to assess their reaction to these events. Our investigation illustrates the importance of examining the impact of antipiracy events on different groups of publishers and provides valuable insights on the effect of selected major antipiracy actions on publishers’ behavior. In the OSN part of my thesis, the focus is on three major OSNs (Facebook, Twitter and Google+) and we analyze two types of users: i. Regular profiles who are normal users that use social networks for their everyday social activities. ii. Professional users who are interested in social networks for some business aspects and behind these users are usually companies or individual figures and celebrities with huge number of fans. In this thesis, three of our studies in this domain are presented.
• Disclosed Information on Facebook: Facebook, as the most popular online social
network which according to Alexa [1], is the 2nd most popular website in the world at the time of writing this thesis. There is a large amount of personal and sensitive information publicly available that is accessible to external entities/users. In this study we look at the public exposure of Facebook profile attributes to understand what type of attributes are considered more sensitive by Facebook users in terms of privacy, and thus are rarely disclosed, and which attributes are available in most Facebook profiles. Furthermore, we also analyze the public exposure of Facebook users by analyzing the number of attributes that users make publicly available in average. To complete our analysis we have crawled the profile information of 479K randomly selected Facebook users. Finally, in order to demonstrate the utility of the publicly available information in Facebook profiles we show in this study three case studies. The first one carries out a gender-based analysis to understand whether men or women share more or less information. The second case study depicts the age distribution of Facebook users. The last case study uses data inferred from Facebook profiles to map the distribution of worldwide population across cities according to its size.
• Cross Posting Activity: On-line Social Networks (OSNs) are being intensively
used by professional players (e.g., big companies, politician, athletes, celebrities, etc.) in order to interact with a huge number of regular OSN users with different purposes (marketing campaigns, customer feedback, public reputation improvement, etc.). Hence, due to the large catalog of existing OSNs, professional players are usu-ally involved in different OSNs. In this context an interesting question is whether professional users publish the same information across their OSN accounts, or actu-ally they use different OSNs in a different manner. We define as cross-posting activity
CHAPTER 1. INTRODUCTION 25
the action of publishing the same information in two or more OSNs. In this study we aim at characterizing the cross-posting activity of professional OSN users across three major OSNs, Facebook, Twitter and G+. To achieve this goal we perform a large-scale measurement-based analysis across more than 2M posts collected from 616 professional users with active accounts in the three referred OSNs.
• Professional Users’ Strategies in OSNs: The intensive use of professional players
led to an increasing research interest that aims at understanding what are the strate-gies of professional users in OSNs. In this study we investigate the global strategy of professional users by sector (e.g., Cars companies, Clothing companies, Politician, etc.). To perform that analysis we have to first validate that users belonging to the same sector/category present a similar strategy in their use of OSNs. To find whether there are some sectors fulfilling that requirement, we use a dataset of 616 professional users with active accounts in the three most popular OSNs: Facebook (FB), Twitter (TW) and Google+ (G+). We find 8 categories in which users present similar behavioural elements: Athletes, Cars, Media News, Movie, Musician-Band, News Website, Politician, and Sports Teams. We describe the behaviour for these categories across FB, TW and G+ highlighting those elements that differentiate each strategy. Finally, we present a simple methodology that allows us to estimate the success of each strategy based on the number of reactions per post that a category is able to attract.
1.2.2 Measurement Methodologies
Apart from the mentioned outcomes of this thesis, there are some measurement method-ologies that were implemented during this thesis as follows:
• Methodology to evaluate the effect of an antipiracy action on the publishers and
consumers of P2P contents in a country.
• Methodology to find cross posting activity of professional users across multi social
networks.
• Methodology to find and classify different strategies that professional users are
fol-lowing in different sectors and evaluate the success of their strategies.
• Methodology to evaluate the architecture of a large CDN to understand how different
26 1.2. THESIS CONTRIBUTIONS
1.2.3 Implemented Large Scale Measurement Tools
This part of thesis includes a list of implemented data collection tools during this thesis. The implemented tools are available for further research collaboration.
• “Facebook Fan Page crawler” This tool is able to collect popularity, activity and
attracted reactions for a list of Facebook professional users (Fan pages).
• “Facebook Fan Page Popularity monitoring” This tool is able to monitor
pe-riodically a list of Fan Pages and collect the popularity and its’ relevant parameters.
• “Facebook regular users’ profile crawler” This tool is able to collect Facebook
regular users’ profile including the general information of the users public profile and the activity of a users that contains published/shared posts in the wall pages.1
• “Facebook physical network discovery tool” This tool is able to monitor
reach-ability to a list of Facebook servers by using planetlab infrastructure distributed in the world. This tool can be modified and utilized for other large scale networks such as Google or YouTube network.
• “Facebook Traffic analyzer” Main function of this tool is to monitor the network
packet level traffic and collect the packets of Facebook sessions. By running this tool in the gateway of a network, we are able to collect all users packets for their Facebook activities and sessions to see what is the amount of each individual FB users’ traffic and generally what type of activity have been performed by users.
• “BitTorrent Trackers Crawler” This tool is able to connect to the BitTorrent
trackers and collect downloads’ detail information as well as many other useful data per torrent.
• “Movie industry data collector” This tool collects movies’ general and business
related information from three online resources including IMDB portal.
1.2.4 Available Datasets
• “Facebook Fan pages dataset” includes popularity, activity and reactions of
around 300K very popular Facebook Fan pages.
• “Facebook regular profiles” includes around 500K users profile information as
well as their social connections and their public activity.
1
CHAPTER 1. INTRODUCTION 27
• “Facebook services’ server reachability” includes more than one year ping and
trace route data (6 times per day) for 47 facebook services (servers from Akamai and FB) from 473 planet lab nodes across the world.
• “Facebook Fan pages popularity evolution” includes evolution of #Fans for
10K of top Fan Pages more than 18 months (snapshots captured 6 times per day).
1.2.4.1 Ethics Considerations
Although we only collected publicly available data from both regular and professional users, we enforced a few steps to protect user privacy specially for social network data. During our analysis, all data were encrypted and not re-distributed, and no personal and sensitive information was extracted, and we only analyzed aggregated statistics.
28 1.3. PUBLICATION LIST
1.3
Publication List
The following papers, (published, submitted or under submission) are the partial outputs during my PhD.
Journal Articles:
• R. Farahbakhsh, A. Cuevas, R. Cuevas, R. Gonzalez, N. Crespi, “Understanding
the evolution of multimedia content in the Internet through BitTorrent glasses”, IEEE Networks Magazine, Volume:27 Issue:6, Dec. 2013.
• M. Mani, W. Seah, N. Crespi, R. Farahbakhsh, “P2P IP Telephony over
Wire-less Ad-hoc Networks A Smart Approach on Super Node Admission”, Peer-to-Peer Networking and Applications Journal, Springer, June 2012.
• Reza Farahbakhsh, Angel Cuevas, Antonio Ortiz, Xiao Han, Noel Crespi, “How
Far is Facebook from Me!, Facebook Network Architecture Analysis”, Under revision on IEEE Communication Magazine, 2015.
• Xiao Han, Reza Farahbakhsh, Angel Cuevas, Ruben Cuevas and Noel Crespi,
“Community Similarity Degree: Finding Similarity to Improve Recommendations in Online Social Networks”, submitted to Expert Systems with Applications, Elsevier, 2015.
• Reza Farahbakhsh, Angel Cuevas, Ruben Cuevas, Noel Crespi, “Characterization
of Professional Users Strategies in major OSNs”, submitted to Communication of ACM, 2015.
• Reza Farahbakhsh, Xiao Han, Angel Cuevas, Noel Crespi,“Privacy Evolution of
Publicly Disclosed Information in Facebook Profiles”, submitted to IEEE Security & Privacy magazine, 2015.
CHAPTER 1. INTRODUCTION 29
Conference Papers:
• Reza Farahbakhsh, Angel Cuevas, Ruben Cuevas, Reza Rejaie, Michal Kryczka,
Roberto Gonzalez and Noel Crespi, “Investigating the Reaction of BitTorrent Content Publishers to Antipiracy Actions”, IEEE P2P, Trento, Italy, Sep. 2013.
• Reza Farahbakhsh, Xiao Han, Angel Cuevas and Noel Crespi, “Analysis of publicly
disclosed information in Facebook profiles”, IEEE/ACM ASONAM, Niagara fall, Canada, 2013.
• W. Chanthaweethip, X. Han, N. Crespi, Y. Chen, R. Farahbakhsh and A. Cuevas,
“Current City Prediction for Coarse Location Based Applications on Facebook”, IEEE Globecom, USA, Dec. 2013.
• Xiao Han, Leye Wang, Son N. Han, Chao Chen, Noel Crespi, Reza Farahbakhsh,
“Link Prediction for New Users in Social Networks”, IEEE ICC, Oxford, UK, 2015.
• R. Farahbakhsh, N. Crespi, A. Cuevas, Neetya Shrestha, M. Mani, Poompat
Saen-gudomlert, “Improved P2P Content Discovery by Exploiting User Social Patterns”, ICNC, San-Diego, USA 2013.
• R. Farahbakhsh, N. Crespi, A. Cuevas, S. Adhikari, M. Mani, T. Sanguankotchakorn,
“socP2P: P2P Content Discovery Enhancement by considering Social Networks Char-acteristics”, IEEE ISCC, Cappadocia, Turkey, July 2012.
• Reza Farahbakhsh, Angel Cuevas, Noel Crespi, “Characterization of cross-posting
activity for professional users across Facebook, Twitter and Google+”, submitted to IEEE/ACM ASONAM 2015.
• R. Gonzales, Reza Motamedi, Reza Farahbakhsh, Angel Cuevas, Ruben Cuevas,
Reza Rajae, “Head-to-Head Comparison of Major OSNs”, under submission for ACM CoSN 2015.
• Roberto Gonzalez, Reza Farahbakhsh, Reza Motamedi, Angel Cuevas, Ruben
Cuevas and Reza Rejaie, “Characterization of information propagation in Google+ and its Comparison with Twitter”, under submission for ACM CoSN 2015.
30 1.4. STRUCTURE OF THE THESIS
1.4
Structure of the Thesis
This contributions of this thesis can be divided in two parts: i) Social networks and ii) P2P systems. To follow the contributions, this manuscripts is also organized in two main sections to overview separately the works that has been done in each domain.
First of all an overall overview of the related work and state of the art is presented in section 2. Section 3 presents two of the studies regarding to the user behavior analysis in P2P systems. The first one explores evolution of Internet multimedia content in the past few years presented in subsection 3.2 and the second study, which is presented in subsection 3.3, is an investigation about the effects of two major antipiracy actions on the P2P content publishers.
The second part of the thesis, section 4, presents three studies related to social net-works. It starts with a study presented in subsection 4.2, in which the publicly disclosed information of Facebook profile users has been analyzed. Second and third studies are re-lated to professional users’ behavior characterization over Cross OSNs which are presented in subsections 4.3 and 4.4 respectively. Those studies includes characterizing cross-posting activity of professional users across Facebook, Twitter and Google+ which is presented in 4.3 and characterization of Professional Users’ Strategies in those major OSNs at subsection 4.4.
Finally section 5 concludes this report by describing some of the ongoing and future works.
Chapter
2
State of the Art
Contents
2.1 Summary . . . . 34 2.2 Internet applications Characterizations . . . . 34 2.2.1 Social Networks . . . 34 2.2.2 Peer-to-Peer . . . 36 2.3 Large scale measurement tools implementation . . . . 37 2.3.1 Social Networks . . . 37 2.3.2 Peer-to-Peer . . . 37 2.4 Conclusion . . . . 37
34 2.1. SUMMARY
2.1
Summary
Related work and state of the art to this thesis can be divided in two groups. Studies that characterize some of the large Internet applications and works that implemented large scale measurement tools to collect datasets from popular Internet applications. In this chapter we overview major studies on the two mentioned groups, specifically in those ones measuring Online Social Networks and Peer to Peer systems. The literature review presented in this chapter overview the general studies relevant to the two mentioned topic and later for each presented study in this thesis, a separate and detail overview of the related work will be presented.
2.2
Internet applications Characterizations
Characterization of the popular and large scale Internet applications have attracted the attention of the research communities in the last decade. One of the main reason is that this type of studies are crucial and useful for different players: i) Internet service providers with the goal of evaluating their popular applications that is implemented, ii) for the network expansion plan to the companies that are running this type of application such as Facebook or Akamai iii) or companies that aim to create a successful large scale application. To this end, next we overview the recent studies which aim to characterise different aspect of Social networks and P2P systems.
2.2.1 Social Networks
The research community has dedicated a fair amount of work to characterize OSNs in the last years. The conducted studies can be classified into three broad classes:
Connectivity properties & social graph: The connectivity properties of the social
graph for Facebook [2–4], Twitter [5, 6], Google+ [7–9] and other less popular OSNs [10] have been carefully analyzed by the referred works. The results presented in those studies along with the results in our studies depict a complete comparison study of the activity and connectivity of these OSNs.
In addition, we can find works analyzing the graph of other social players different than the main OSNs like [10] that analyze the graph properties for static snapshots of four social systems Orkut, Flickr, LiveJournal, and YouTube. In particular, Magno et. al in [7] perform an early analysis on G+ and identify the main similarities and differences with other OSNs like FB and TW. However, their comparison only focuses on the social graph level, and does not cover user activities or reactions, which is the actual scope of our
CHAPTER 2. STATE OF THE ART 35
conducted studies. Finally in [9], authors compare the connectivity properties of the social graph of FB, TW and G+.
Temporal Evolution of OSN properties: Previous works have studied the evolution
of the relative size of the network elements for G+ [9] or Flickr and Yahoo [11]. Further-more, other works have analyzed the evolution of the social graph properties [9, 12–17], the evolution of the interactions between users [18] and the evolution of users’ availability over time [19]. In addition in [17] the authors have analyzed the evolution of users’ activity in MySpace and Twitter.
Information Disclosure in Social Networks. There are several studies that investigate
the level of information disclosure in social networks focusing a group of users from a specific country [20, 21] or city [22] or users from a university [23] but just few studies are available that look on a random sample of users [24]. Conceptually similar to our efforts, Quercia et al. (2012) [20] found a correlation between the degree of openness and gender, using a dataset of 1323 profiles from the United States. Gross et al. in [23] studied the patterns of information revelation in Facebook. They analyzed around 4K Carnegie Mellon University students’ profiles, specifically those that joined a popular social networking site catering to college students. In other work, Chang et al. [21] studied the privacy attitudes of U.S. Facebook users of different ethnicities. Another U.S.-based study [25] used a questionnaire and with considering 1,710 students’ profiles shows that women are more likely to maintain a higher degree of profile privacy than men; and that having a private profile is associated with a higher level of online activity. Authors in [26] examined disclosure in Facebook profiles looking at only 400 Facebook profiles. In a similar work to the previous one, authors in [27] employed surveys and interviews to study the factors that influence university students to disclose personal information on Facebook. In addition, we also study the amount of disclosed information on Facebook profiles on a dataset including half million users [24].
Some other studies provide methodologies which use available Facebook users’ profile attributes to do different type of estimation or prediction such as estimating the birth year [22], predicting the friendship [28, 29] or predicting the attributes of another user [30].
Users’ Behavior in Online Social Networks: Users’ behavior needs to be characterized
from real data collected from OSNs. In particular, previous works have used two different strategies: Passive measurements [31, 32] vs. Active measurements [9, 33, 34]. The former captures traces of traffic or click streams that allow the reconstruction of the behavior of users whereas the latter uses crawling techniques similar to those described in our studies. Many studies has been conducted to characterize the behavior of users based on the
36 2.2. INTERNET APPLICATIONS CHARACTERIZATIONS
real data collections. Gyarmati et al. [34], in accordance to our studies, used active mea-surements to characterize users’ activity in few different OSNs. Gyarmati et al. analyzed less popular OSNs such as Bebo, MySpace, Netlog, and Tagged and they defined activity as the time a user stays on the system but they do not characterize users’ reactions which, as we have demonstrated, are key features. Authors in [35] investigate emotional contagion of facebook users which occurs outside of in-person interaction between individuals. In another work, author conducted a large scale experiment over 61-million facebook users and study the social influence and political mobilization [36].
2.2.2 Peer-to-Peer
Popularity Evolution of P2P Applications: P2P networks are already widely used
around the Internet, mainly for file sharing. The massive sizes of some P2P networks contain huge numbers of all kinds of content. There are several papers that look at the evolution of P2P traffic along the time e.g., [37, 38]. The most recent one [38] studies the Inter-AS traffic associated to several ISPs across the Internet. The authors suggest that P2P traffic is becoming less representative and mention the migration process discussed in this paper as a possible cause. Furthermore, [39] studies the impact of BitTorrent in the Internet traffic over a period of two years between Nov 2008 and Nov 2010. The authors briefly mention a reduction of 10% in the number of peers that partially validates our observations. They argue that this reduction may be due to a drop in the system popularity and at the same time acknowledge the difficulty of validating this hypothesis so that they do not explore it. Our study which is presented in section 3.2, is different in nature than the previous works in the literature since we do not analyze the network footprint of BitTorrent, instead we perform a comprehensive analysis of the evolution of BitTorrent popularity at aggregate and local level across both publishers and consumers. In addition, we face the difficult task of finding the root causes for the discovered trends that to the best of our knowledge has not been addressed before.
Socio-economic Studies in BitTorrent: The popularity of BitTorrent attracted the
attention of the research community to examine various aspects of swarming mechanism in BitTorrent [40–43] and propose different techniques to improve its performance [44, 45]. Furthermore, other aspects of BitTorrent such as demographics of its ecosystem [46–48] along with security [49] and privacy issues [50, 51] have also been studied. However (to the best of the author’s knowledge) despite of its importance, little work has been conducted on the understanding of socio-economic aspects of P2P applications in general and BitTorrent ecosystem in particular [47, 50, 52]. Authors in [52] studied the incentives that drive users to publish content in BitTorrent.
CHAPTER 2. STATE OF THE ART 37
2.3
Large scale measurement tools implementation
2.3.1 Social Networks
Considering the ongoing researches that aim to understands the phenomena of social media, a necessary first step is to collect good enough data from various available OSNs and other types of social media. To this end, proper data collection tools and crawlers are being developed to gather data from different sources. Large-scale data collection from OSN services mainly depends on the functionality provided by the analysed system. Possible solutions to collect data include the use of a systems available APIs, as in Google+ and Twitter [9, 53], and the integration of their own applications to attract people and to provide access to their profile information, as in Facebook [54]. Alternatively, web crawling techniques have been used to analyse Facebook [4,55,56] and other platforms, e.g., Myspace [57], Flickr [12, 58], and YouTube [59]. Usually, web crawling is applied in cases where the required data cannot be accessed via an available API, or when the revealed data is insufficient for subsequent analysis. The research community uses the collected data to analyse social media from different perspective [7, 22, 24, 60–62].
2.3.2 Peer-to-Peer
In recent years, several studies measure the P2P ecosystem from various perspective and different measurement methodologies for implementing large scale measurement tools. Au-thors in [63] conduct a complete survey on different methods of measurement and simulation in BitTorrent. In summary two popular way to collect data from P2P systems is observing the trackers log [64] or using mirror script such as HTML script [65]. Authors in [66] sur-veys the existing measurement studies and also collected BitTorrent traffic at four major European ISPs and investigate how is the BitTorrent traffic pattern from ISPs perspective. There are several other studies such as [67, 68] which investigate different aspects of P2P system by implementing large scale data collection tools.
2.4
Conclusion
This section provided a general overview over the major previous efforts relevant to this thesis. In summary it provided some key studies on two research lines “characterizing a large Internet application” and “Implementation of large scale measurement tools” for OSNs and P2P systems. In addition to this section, for each of the presented studies in this thesis, a separate related work will be provided which focuses on the main relevant studies to that specific study.
Chapter
3
Profiling regular and
professional users in BitTorrent
Contents
3.1 Summary . . . . 40 3.2 Evolution of multimedia content in the Internet through
Bit-Torrent glasses . . . . 41 3.2.1 Introduction . . . 41 3.2.2 Background . . . 42 3.2.3 Related Work . . . 43 3.2.4 Measurement Methodology . . . 43 3.2.5 Content Evolution Analysis . . . 44 3.2.6 BitTorrent’s Content Size Analysis . . . 49 3.2.7 User Comments on BitTorrent Contents . . . 52 3.2.8 Conclusion . . . 53 3.3 Reaction of BitTorrent Content Publishers to Antipiracy Actions 55 3.3.1 Introduction . . . 55 3.3.2 Related Work . . . 57 3.3.3 Data Collection and Datasets . . . 58 3.3.4 Effect of a Global Antipiracy Event . . . 60 3.3.5 Effect of a Local Antipiracy Law . . . 67 3.3.6 Conclusions . . . 72
40 3.1. SUMMARY
3.1
Summary
The main focus of this chapter is to characterize professional and regular users behavior on P2P systems. To this end, two studies are presented that look to some aspects of the users characterizations such as their content consumptions trend on a major BitTorrent portal namely “ThePirateBay” as well as how the professional and regular users react to antipiracy actions in terms of their activity and publishing behavior.
More specifically, subsection 3.2 presents a measurement study which show us how the evolution of multimedia contents in BitTorrent has been changed over 3 years and follow-ing to that, subsection 3.3 includes a study about the reaction of professional BitTorrent Content Publishers to two major Antipiracy Actions (shutdown of Megaupload and Hadopi law).
Keywords
Multimedia Content, P2P, BitTorrent, Content Availability, Content Popularity, Content Size, Piracy, law, Cyberlocker, Megaupload, P2P, BitTorrent, Hadopi.
CHAPTER 3. PROFILING REGULAR AND PROFESSIONAL USERS IN
BITTORRENT 41
3.2
Evolution of multimedia content in the Internet through
BitTorrent glasses
3.2.1 Introduction
In the last years Internet traffic has been mostly dominated by multimedia content [69]. This has led to the development of new technologies to distribute this content: (i) P2P technologies that allow end-users to share content without the necessity of a dedicated infrastructure, (ii) Cyberlockers that are web-based portals that allow users to both upload and download content, (iii) multimedia content distribution platforms such as YouTube (video), Netflix (TV shows and Movies) or Spotify (music). In addition, in order to reduce the cost and improve the efficiency of the content distribution a new network infrastructure namely Content Delivery Network (CDN) was proposed [70]. A CDN uses caching and prefetching strategies in order to store the content close to those users that are likely to consume it so that the amount of data crossing long paths in the Internet is reduced and the user’s experience is enhanced. Some of the main players in the business of CDNs are Akamai and Limelight that provide their service worldwide to a large number of customers. Furthermore, some Content Providers such as Google have also deployed their own CDNs. Finally, network operators have to continuously adapt their network infrastructures in order to efficiently serve the large demand of multimedia content. For instance, some of the major operators have recently started to develop their own CDN.
The described scenario, along with the expected steady growth of the traffic associated to multimedia content in the near future [71], makes it interesting to study the evolution of such content. Understanding this evolution will help the aforementioned players to adapt their algorithms, infrastructures and resources to meet the needs of their clients and, at the same time, increment their revenues.
In this study, we present a first step to study the evolution of different types of content in the Internet using BitTorrent as reference system. We believe that BitTorrent is the most appropriate platform to conduct our study due to the following reasons: (i) BitTorrent is the application that aggregately contributed more Internet traffic in the last decade [72] [73] and it is still among the three that generate more traffic [69]; (ii) The most popular (and recent) content (e.g. last Hollywood movies) are typically available in BitTorrent; (iii) Other successful platforms such as Neftflix, YouTube or Spotify are specialized in a single type of content. Instead, BitTorrent offers a broader catalogue of content types (e.g, video, audio, games, etc). Therefore, it allows to perform a comparative study across different types of multimedia content.
Our study is based on a large scale dataset collected from the most popular BiTorrent portal, namely The Pirate Bay (TPB), over a period longer than two years between Nov.
42
3.2. EVOLUTION OF MULTIMEDIA CONTENT IN THE INTERNET THROUGH BITTORRENT GLASSES
2009 and Feb. 2012. Note that TPB received more than twice daily visits compared to the second most popular BitTorrent portal, according to Alexa ranking [1]. We have collected 4 different snapshots over this time window that collectively account for more than 160K content that attracted more than 185M download sessions. This dataset constitutes a solid ground to provide meaningful insights regarding the content evolution in BitTorrent and by extension in the Internet. In particular, our study address three concrete but very relevant issues: (i) We analyze the evolution of the content availability and popularity associated to different content types over the considered period; (ii) We study the evolution of the content size for all aggregate content and its division into the different categories; and, (iii) We quantify the end-users’ feedback activity by means of the number of comments that each content receives.
Our main insights are:
• Video of different types (Movies, TV Shows, Porn) represents 40-50% of the overall
content and attracts 80% of the download sessions.
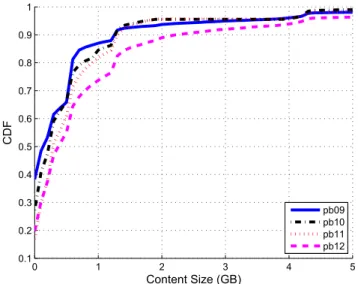
• The median size of the available content has doubled in a two years period.
• High-resolution content has multiplied by 5 its availability and popularity to represent
10% of the multimedia content and downloads in Feb. 2012.
• Finally, we have observed that end-users’ feedback is typically very reduced.
3.2.2 Background
There are two separated processes in BitTorrent functionality. On the one hand, we find the process in which a user (publisher) makes a content available, or publishing phase. On the other hand, once the content is available end-users (consumers) download it in the
downloading phase.
In the publishing phase, the publisher generates a .torrent file associated to that content and uploads it in a BitTorrent portal such as The Pirate Bay (TPB). In addition, the publisher registers the content in one (or more) Tracker(s), which is a server that manages and monitors the swarm (the set of peers sharing a content) associated with a given content. As part of its services, the Tracker keeps track of all the peers (i.e. IP addresses) that share the content and classifies them either as seeders (which have the full content) or leechers (which have only some pieces of the content). The .torrent file includes (among other information): the IP address of the Tracker (and optionally a list of other backup trackers) that manages the swarm associated to the content, the content size and its name. In addition, major torrent portals like TPB provide a web page for every uploaded content
CHAPTER 3. PROFILING REGULAR AND PROFESSIONAL USERS IN
BITTORRENT 43
that includes information such as size, category, number of leechers and seeders, content description, users’ comments, etc.
In the downloading phase, a BitTorrent client gets the .torrent file associated to the desired content from a BitTorrent Portal (e.g. TPB). That client subsequently sends a request to the Tracker included in the .torrent file. The Tracker replies with: (i) the number of seeders and leechers that are currently connected to the swarm, and (ii) N (typically 50 with a limit of 200) random IP addresses of peers participating in the swarm. Next, the BitTorrent client connects to those peers in order to start receiving pieces of the content (and after getting some pieces serves them to other peers). From time to time, during the downloading process, the BitTorrent client may contact the Tracker to obtain more peers.
3.2.3 Related Work
The demonstrated weight of BitTorrent in the Internet has attracted the attention of many computer scientists, who have made in depth studies of the functionality of the BitTorrent ecosystem [47] [48], have generated models that capture its behaviour [40], have provided new algorithms to improve its performance [45] [44], have analyzed and proposed mech-anisms regarding its security [49] [51], and have evaluated socio-economic reasons that motivate users to upload and consume BitTorrent content [52]. Therefore, the technical and socio-economical aspects of BitTorrent have been thoroughly studied. However, to the best of our knowledge, except [72] [73] which are technical reports that provide some general insights to the evolution of P2P protocols in different countries, there is no study that analyzes the evolution of the BitTorrent content in a long term.
3.2.4 Measurement Methodology
The goal of our measurement process is to collect a large number of contents and the following information for each one of them: (i) the content Category/Subcategory as defined by TPB, (ii) the number of download sessions, (iii) the content size, (iv) the number of comments provided by end-users.
Towards this end, we leverage the RSS feed of TPB to detect the availability of any new .torrent file. When a new torrent is detected, in addition to gather its size (from the .torrent file) and Category/Subcategory from TPB, our crawler tool periodically queries the tracker in order to obtain the IP addresses of the participants in the content swarm and always solicits the maximum number of IP addresses (i.e. 200) from the Tracker. To avoid being blacklisted by the Tracker, we issue our queries at the maximum rate that is allowed by the tracker (i.e. 1 query every 10 to 15 minutes depending on the tracker load). Given this constraint, we query the tracker from several geographically-distributed
44
3.2. EVOLUTION OF MULTIMEDIA CONTENT IN THE INTERNET THROUGH BITTORRENT GLASSES
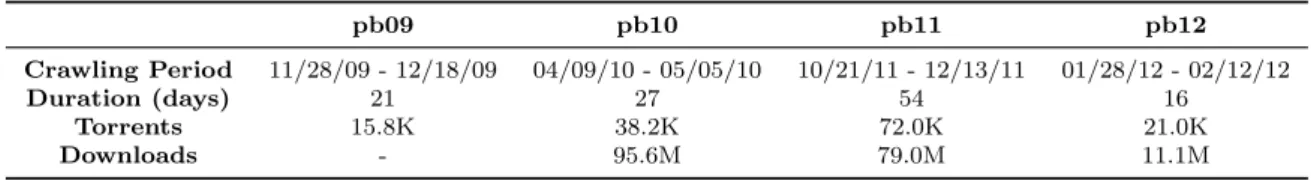
Table 3.1: Datasets Description
pb09 pb10 pb11 pb12
Crawling Period 11/28/09 - 12/18/09 04/09/10 - 05/05/10 10/21/11 - 12/13/11 01/28/12 - 02/12/12
Duration (days) 21 27 54 16
Torrents 15.8K 38.2K 72.0K 21.0K
Downloads - 95.6M 79.0M 11.1M
machines so that the aggregated information by all these machines provides an adequate high resolution view of the participating peers (i.e. number of download sessions). We continue to monitor a target swarm until we receive 10 consecutive empty replies from the Tracker. This allows us to capture for each new content its size, Category/Subcategory and the number of associated download sessions.
Finally, in order to gather the number of comments for a given content, we crawled TPB page of all collected content in June 2012. It must be noted that at that time some of the contents collected by our crawling tool had been removed from TPB, and thus we could not gather their number of comments.
Using the described methodology we have collected four snapshots of TPB content between Nov. 2009 and Feb. 2012. We refer to them as pb09, pb10, pb11 and pb12 based on the year in which each dataset was collected. Table 3.5 summarizes the main characteristics of these datasets (as it is shown in the table we do not have the number of download sessions for pb09). All the snapshots together contribute more than 160K torrents (i.e. contents) and 185M download sessions. These numbers allow us to perform a comprehensive analysis on how the content (and its division into different categories) has evolved over the two years period that separates the four datasets.
3.2.5 Content Evolution Analysis
In this subsection we investigate how the relative weight (in %) of the different content categories evolves in the period under study. For that, we first classify all the collected contents following the Category/Subcategory schema defined by TPB. Next, we analyze each of them from an availability (portion of content available in each category) and a popularity (portion of downloads for each category) perspective.
3.2.5.1 Content Availability Evolution
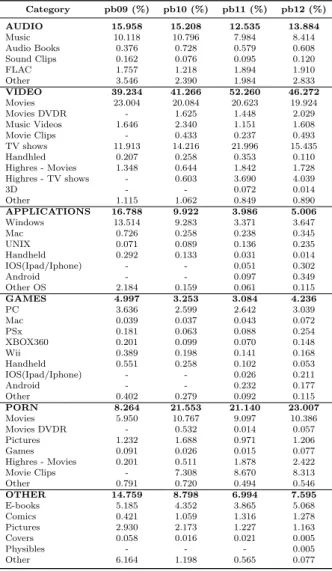
Table 3.2 shows the portion of content available in each Category/Subcategory for pb09, pb10, pb11 and pb12 snapshots.
VIDEO is the dominant category and doubles, in all the snapshots, the number of contents available in any other category. The VIDEO category shows a very slight increment
CHAPTER 3. PROFILING REGULAR AND PROFESSIONAL USERS IN
BITTORRENT 45
Table 3.2: Distribution of content availability (proportion of available content) by cate-gories/subcategories and datasets (pb09, pb10, pb11 and pb12)
Category pb09 (%) pb10 (%) pb11 (%) pb12 (%) AUDIO 15.958 15.208 12.535 13.884 Music 10.118 10.796 7.984 8.414 Audio Books 0.376 0.728 0.579 0.608 Sound Clips 0.162 0.076 0.095 0.120 FLAC 1.757 1.218 1.894 1.910 Other 3.546 2.390 1.984 2.833 VIDEO 39.234 41.266 52.260 46.272 Movies 23.004 20.084 20.623 19.924 Movies DVDR - 1.625 1.448 2.029 Music Videos 1.646 2.340 1.151 1.608 Movie Clips - 0.433 0.237 0.493 TV shows 11.913 14.216 21.996 15.435 Handhled 0.207 0.258 0.353 0.110 Highres - Movies 1.348 0.644 1.842 1.728 Highres - TV shows - 0.603 3.690 4.039 3D - - 0.072 0.014 Other 1.115 1.062 0.849 0.890 APPLICATIONS 16.788 9.922 3.986 5.006 Windows 13.514 9.283 3.371 3.647 Mac 0.726 0.258 0.238 0.345 UNIX 0.071 0.089 0.136 0.235 Handheld 0.292 0.133 0.031 0.014 IOS(Ipad/Iphone) - - 0.051 0.302 Android - - 0.097 0.349 Other OS 2.184 0.159 0.061 0.115 GAMES 4.997 3.253 3.084 4.236 PC 3.636 2.599 2.642 3.039 Mac 0.039 0.037 0.043 0.072 PSx 0.181 0.063 0.088 0.254 XBOX360 0.201 0.099 0.070 0.148 Wii 0.389 0.198 0.141 0.168 Handheld 0.551 0.258 0.102 0.053 IOS(Ipad/Iphone) - - 0.026 0.211 Android - - 0.232 0.177 Other 0.402 0.279 0.092 0.115 PORN 8.264 21.553 21.140 23.007 Movies 5.950 10.767 9.097 10.386 Movies DVDR - 0.532 0.014 0.057 Pictures 1.232 1.688 0.971 1.206 Games 0.091 0.026 0.015 0.077 Highres - Movies 0.201 0.511 1.878 2.422 Movie Clips - 7.308 8.670 8.313 Other 0.791 0.720 0.494 0.546 OTHER 14.759 8.798 6.994 7.595 E-books 5.185 4.352 3.865 5.068 Comics 0.421 1.059 1.316 1.278 Pictures 2.930 2.173 1.227 1.163 Covers 0.058 0.016 0.021 0.005 Physibles - - - 0.005 Other 6.164 1.198 0.565 0.077
in its presence between pb09 and pb10 from 39% to 41%. It keeps a stable growth to reach 52% (i.e. at this point there was more video content than the sum of all other categories) of the overall content in pb11, and then it surprisingly shows a considerable drop of 6 percentage points (to 46%) in the two months separating pb11 and pb12.
We now turn our attention to the PORN category that shows an important increment in its representativeness during the five months between pb09 and pb10. This increase allows PORN to scale from the 5th category in terms of availability in pb09 (8%) up to the 2nd position in pb10 accounting for 21% of the total content. From this moment on, it remained in the 2nd position and maintained its weight, 21% in pb11 and 23% in pb12.
46
3.2. EVOLUTION OF MULTIMEDIA CONTENT IN THE INTERNET THROUGH BITTORRENT GLASSES
similar trend over time. They steadily reduce their weight between pb09 and pb11 and change this slope in pb12. Although the trend is similar we can find a much more marked representativeness loss in the APPLICATIONS and OTHER categories. The APPLICA-TIONS category almost halves its presence between pb09 (16.8%) and pb10 (10%), and maintains that descendent line to only accounts for 4% of the contents in pb11, followed by a small increase up to 5% in pb12. The OTHER category shows a strong decrement of its weight between pb09 (15%) and pb10 (8.7%) to later slows down the slope of this loss to end up in 7% of the total content in pb11 and slightly increases this value (7.5%) in pb12. Contrary to these cases, GAMES and AUDIO categories present a smoother contribution reduction between pb09 and pb11 of 3 percentage points for AUDIO and 2 percentage points for GAMES, to later increase 1 percentage point in pb12.
After analyzing the evolution of each category we can present three interest insights:
• Movies and TV Shows (in the VIDEO category) are the most available contents. Both
subcategories together always sum up more than 34% of the total content, and they reach a peak of presence in pb11 when both together surpassed 40%. Furthermore, if we add the PORN-Movies subcategory, we end up with a range between 40%-50% for Movies and TV Shows.
• There is a relevant increment of the High Resolution content. While that type of
content only represented about 1.5% in pb09 and pb10 (summing up Highres-Movies from PORN and VIDEO and Highres-TV Shows from VIDEO), it grew to 7.4% and 8.2% in pb11 and pb12, respectively.
• The presence of Windows related content has dramatically decreased. It represented
13% of the total available content in pb09, while in the most recent snapshots its presence is reduced to a mere 3%.
3.2.5.2 Content Popularity Evolution
The previous subsection has analyzed the content availability in TPB. We now study the popularity of the different Categories/Subcategories over time based on the number of download sessions associated with each content in our snapshots.
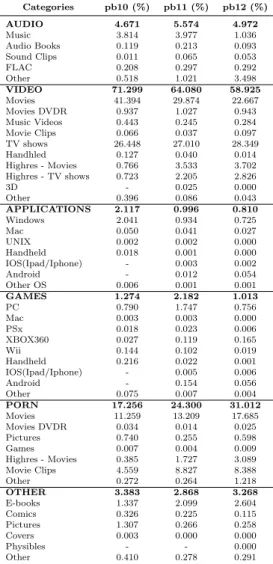
Table 3.3 shows the portion of download sessions in each Category/Subcategory for pb10, pb11 and pb12 snapshots. As we mentioned earlier, we did not collect download information for pb09.
VIDEO is the most popular category by attracting more than 3/5 of the downloads in all the snapshots. However, it shows a relevant drop in its popularity over the time. VIDEO represented 71% of the downloads in pb10 and steadily decreased after that, to 64% and 59% in pb11 and pb12 respectively.
CHAPTER 3. PROFILING REGULAR AND PROFESSIONAL USERS IN
BITTORRENT 47
Table 3.3: Distribution of content popularity (proportion of download sessions) by cate-gories/subcategories and datasets (pb09, pb10, pb11 and pb12)
Categories pb10 (%) pb11 (%) pb12 (%) AUDIO 4.671 5.574 4.972 Music 3.814 3.977 1.036 Audio Books 0.119 0.213 0.093 Sound Clips 0.011 0.065 0.053 FLAC 0.208 0.297 0.292 Other 0.518 1.021 3.498 VIDEO 71.299 64.080 58.925 Movies 41.394 29.874 22.667 Movies DVDR 0.937 1.027 0.943 Music Videos 0.443 0.245 0.284 Movie Clips 0.066 0.037 0.097 TV shows 26.448 27.010 28.349 Handhled 0.127 0.040 0.014 Highres - Movies 0.766 3.533 3.702 Highres - TV shows 0.723 2.205 2.826 3D - 0.025 0.000 Other 0.396 0.086 0.043 APPLICATIONS 2.117 0.996 0.810 Windows 2.041 0.934 0.725 Mac 0.050 0.041 0.027 UNIX 0.002 0.002 0.000 Handheld 0.018 0.001 0.000 IOS(Ipad/Iphone) - 0.003 0.002 Android - 0.012 0.054 Other OS 0.006 0.001 0.001 GAMES 1.274 2.182 1.013 PC 0.790 1.747 0.756 Mac 0.003 0.003 0.000 PSx 0.018 0.023 0.006 XBOX360 0.027 0.119 0.165 Wii 0.144 0.102 0.019 Handheld 0.216 0.022 0.001 IOS(Ipad/Iphone) - 0.005 0.006 Android - 0.154 0.056 Other 0.075 0.007 0.004 PORN 17.256 24.300 31.012 Movies 11.259 13.209 17.685 Movies DVDR 0.034 0.014 0.025 Pictures 0.740 0.255 0.598 Games 0.007 0.004 0.009 Highres - Movies 0.385 1.727 3.089 Movie Clips 4.559 8.827 8.388 Other 0.272 0.264 1.218 OTHER 3.383 2.868 3.268 E-books 1.337 2.099 2.604 Comics 0.326 0.225 0.115 Pictures 1.307 0.266 0.258 Covers 0.003 0.000 0.000 Physibles - - 0.000 Other 0.410 0.278 0.291
PORN appears as the second most popular category among BitTorrent users. Contrary to VIDEO, PORN presents a steady increase in its weight since it accounts for 17% of the download sessions in pb10, 24% in pb11 and 31% in pb12. The growth in the PORN’s share (14 percentage points) almost matches the VIDEO category drop (12 percentage points). Finally, it is very important to notice that the sum of these two categories represents about 90% of the total downloads for the three snapshots. More interestingly, by zooming in our analysis into the subcategories, we realize that out of that 90%, 80% belongs to the subcate-gories: VIDEO/Movies, VIDEO/TV Shows, VIDEO/Highres-Movie, VIDEO/Highres-TV Shows, PORN/Movies, PORN/Highres-Movies.
48
3.2. EVOLUTION OF MULTIMEDIA CONTENT IN THE INTERNET THROUGH BITTORRENT GLASSES
availability of this type of content. While it only attracted 1.87% of the downloads in pb10, it has increased its popularity 5 times by receiving 9.62% of the downloads in pb12. If we analyze the remaining categories: (i) we find that AUDIO contributes 5% of the downloads (with variations smaller than 1 percentage point over the trhee snapshots). (ii) APPLICATIONS goes from 2% in pb10 to less than 1% in pb11 and pb12. It is worth noting that APPLICATIONS category contribution is mainly due to Windows applications. (iii) GAMES starts at 1.2% in pb10, gains 1 percentage point in pb11, and loses it again in pb12. (iv) Finally, the OTHER category remains stable around a 3% with variations smaller than 0.5 percentage points.
In a nutshell, PORN is compensating for loss in VIDEO, which in the worst case attracts 3/5 of the downloads. Both categories together account for 90% of the downloads. Furthermore, we observe a significant increase in the High-resolution content. Finally, the rest of the categories remains steady over the time with very small variations showing a small but stable interest from BitTorrent consumers in each one of them.
3.2.5.3 Content Availability Vs Content Popularity Discussion
The most relevant content in BitTorrent (according to its major portal, TPB) in terms of availability and popularity are Movies (including porn ones) and TV Shows. Although this type of content represents only 1/2 of the available content, it accounts for 4/5 of the downloads.
In the case of PORN content we perceive a stable presence in the available content (a bit higher than 20%), but an increment of its popularity based in the portion of downloads, from 17% to 31%. In particular, PORN is taking up the popularity reduction suffered by the VIDEO category. Similarly to VIDEO, the proportion of available content for PORN is lower than its weight in number of downloads (except in pb10).
For the rest of the categories the portion of available content exceeds the portion of downloads. The AUDIO category represents between 12%-15% of the available content but only attracts 5% of the downloads. In the case of the GAMES category, it contributes between 3%-5% of the content to get 1%-2% of the downloads. The OTHER category feeds 7%-9% of the content (without considering pb09) and only captures 3% of the downloads. Finally, the APPLICATIONS category contributes 10%, 4% and 5% of the content in pb10, pb11 and pb12, to attract 2%, 1% and 0.8% of the downloads, respectively.
Therefore, we can conclude that if TPB removes all the categories except VIDEO and PORN, although it would lose half of its available content, it would not suffer a significant reduction in the downloading activity. In addition, the results suggests that High-resolution content is rapidly increasing its availability and popularity.