HAL Id: dumas-00909960
https://dumas.ccsd.cnrs.fr/dumas-00909960
Submitted on 27 Nov 2013HAL is a multi-disciplinary open access archive for the deposit and dissemination of sci-entific research documents, whether they are pub-lished or not. The documents may come from teaching and research institutions in France or abroad, or from public or private research centers.
L’archive ouverte pluridisciplinaire HAL, est destinée au dépôt et à la diffusion de documents scientifiques de niveau recherche, publiés ou non, émanant des établissements d’enseignement et de recherche français ou étrangers, des laboratoires publics ou privés.
Does cross-border regulation really influence
cross-border trade? Evidence from the Services Trade
Restrictions Index
Marine George
To cite this version:
Marine George. Does cross-border regulation really influence cross-border trade? Evidence from the Services Trade Restrictions Index. Economics and Finance. 2013. �dumas-00909960�
UNIVERSITY OF PARIS I – PANTHEON SORBONNE MASTER 2 Research DEVELOPMENT AND GLOBALIZATION
UFR 02 SCIENCES ECONOMIQUES
Does cross-border regulation really influence
cross-border trade?
Evidence from the Services Trade Restrictions Index
Defended by Marine GEORGE
L’UNIVERSITE PARIS I Panthéon Sorbonne n’entend donner ni approbation ni disapprobation
Does border regulation really influence
cross-border trade?
Evidence from the Services Trade Restrictions Index
ABSTRACT
This paper uses the recent Services Trade Restrictions Database and the Services Trade Restrictons Index provided by the World Bank to assess the specific impact of Mode 1 regulation on cross-border services trade. The article follows an augmented gravitational model to evaluate the determinents of imports and exports between country pairs, and to assess their correlation with Mode 1 regulation of both the home country and the partner country. At the aggregated level, there is evidence of a negative correlation between services trade values and the level of restrictions of both the home country and the partner country. The partner country regulation doesn’t keep its impact at the sectoral level.
1. Introduction
Since the 1970s, international trade in services drastically increased. Nowadays, it represents over 20% of total trade within OECD countries (Lennon, 2011). Studies exploring this theme aroused recently, and much still has to be done to shed light on the various determinants of trade and their differences with trade in goods. In particular, the impact of regulation on trade in services led to recent literature (see below) but very little has been done regarding the impact of cross-border regulation on cross-border trade (imports and exports). Until July 2012 and the creation of the Services Trade Restrictions Index (STRI), it was indeed very difficult to assess the actual impact of cross-border regulation since this regulation had not been specifically measured. The recent creation of the STRI and the Services Trade Restrictions Database (STRD) leads to great potential for further research and recommendations. Firms’ decisions to import and export services may indeed depend on the actual regulation faced, but can also depend on the overall regulatory climate of a country. In the later case, the firm’s decision depends on the way the partner country is perceived, and the signal sent by the overall regulatory climate of a country may have a stronger
impact on firms’ decision to trade with another territory, than the actual specific regulation.
Assessing the impact of cross-border regulation on cross-border trade appears to have potential major implications on further research.
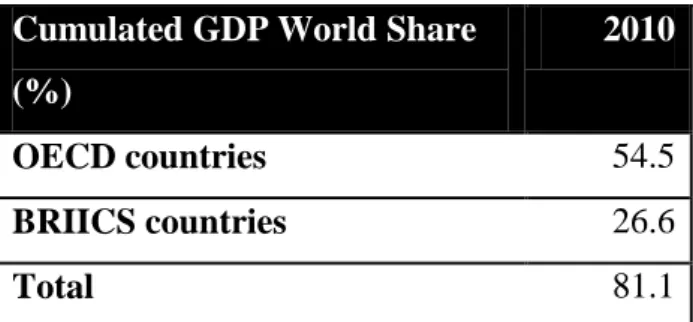
In order tosolve this issue, this paper uses a simple gravity model framework, using the newly created (STRI) developed in July 2012, and following the framework developed by Kimura & Lee (2006). The goal of the analysis is to isolate the correlation between the regulation on cross-border services and the values of imports and exports.The countries selected are all OECD and BRIICS countries (Brazil, Russia, India, Indonesia, China and South Africa), which cumulated GDP accounts for over 80% of the World GDP (See Annex Table A1). Without being exhaustive, this sample presents the advantage of providing information on the main trends in international trade. Also, it presents a variety of countries across five continents with various regulatory behaviors. For example, BRIICS countries are less open than OECD countries on average, except in the professional sector. Especially, in the transportation sector, the STRI is 2.6 times higher in the BRIICS than in the OECD (See Figure1).
Figure 1: Mode 1 STRI level across country areas
Source: OECD EBOPS2010
Sectors taken into account are the Financial, the Transportation and the Professional sectors, which are the only sectors for which cross-border trade regulation indexes are given by the STRI. The overall cross-country regulation index (all sectors included) is also included.
The analyses are first ran with the log-linear regression method, and corrected through the Poisson Quasi-Maximum Likelihood (PQML) method. They provide clear evidence of a negative correlation between cross-border trade in services and the level of countries’ restrictions to services trade. In other words, the more a country is legally open to trade in services, the more it exchanges services with other countries. These results are consistent and resist to robustness checks. However, when analyzing the sectoral level, the magnitude of the correlation differs from home country to partner country and across sectors. The transportation sector provides evidence of a significant correlation between the value of services trade and both home country and partner country regulatory environments. The financial sector provides the same evidence for home country only, while the impact of the regulatory environment for the professional sector appears only in the home country in the case of imports. In any case, endogeneity could not be controlled for and these findings are only providing evidences of a correlation. These evidences should not be misinterpreted for direct causalities.
0 5 10 15 20 25 30 35 40
Overall Financial Transportation Professional
Mode 1 STRI level across country
areas
OECD BRIICS
Since the mid-1980s, the focus of theoretical literature on international trade in services has increased, leading to a variety of studies. In particular, the impact of regulations on trade flows was largely explored, in the past decade. The methodology used to assess the determinants of trade in services and of regulation in particular is the same as the one used for the assessment of the determinants of trade in goods: gravity models appear to provide conclusive results even though trade in services presents specificities in comparison to trade in goods (Mirza & Nicoletti, 2004; Schwellnus, 2007; Lennon, 2011). A strong negative link between regulatory restrictions and the level of trade was found (Van der Marel & Shepherd, 2011). Regulatory measures affect the fixed cost of entering the market as well as the variable costs of servicing that market (Kox & Nordås, 2007). Especially, the impact of regulation differs, depending on the type of services traded (Crozet, Milet, & Mirza, 2013). Overall, the regulatory environment has a potentially stronger impact on trade in services than on trade in goods; cooperation and liberalization may have great spillovers (Francois & Hoekman, 2010).
Furthermore, the analysis of trade in services differs from the analysis of trade in goods by the fact that there are four different modes of trade. The General Agreement on Trade in Services (GATS) defines the following four modes of services: “Cross-border supply is defined to cover services flows [...]; Consumption abroad refers to situations where a service consumer (e.g. tourist or patient) moves into another […] territory to obtain a service; Commercial presence implies that a service supplier […] establishes a territorial presence […] in another […] territory to provide a service […]; and Presence of natural persons consists of persons […] entering [another] territory to
supply a service”. The economic literature has recently shown interest in the modal approach of
trade in services, since this approach has the advantage of providing specific conclusions and having direct policy implications. Using a list of regulatory policy variables, Nordås and Kox (2008) found complementarity between the different modes of services. Regulatory heterogeneity between the different modes also has a strong negative impact on trade in services. Especially, it negativelly affects commercial presence (Mode 3) and drives firms’ decisions towards cross-border trade (Mode1). These findings are supported by Christen and Francois (2010) who also emphasize the impact of the market size in the choice of mode. However, until the dissemination of the STRI, there was no index assessing the legal openness of a country to trade in services and
studies specifically focusing on modal regulation. Furthermore, to the author’s knowledge, no
Such a study can help specifying if firms’ decisions rely on specific measures or on the general
regulatory environment of the partner country.
Furthermore, the current article focuses on OECD and BRIICS countries. Besides assessing the impact of cross-border regulations on cross-border trade, it provides a panel of different countries and reviews the regulatory differences between these countries. It was already shown that the least protected countries are the developed countries (Fontagné, Guillin, & Mitaritonna, 2011). Liberalizing their economy, developing and emerging countries with high regulatory bareers could potentially get great gains from more services trade (Mattoo, 2001). However, liberalization encounters strong resistances: historically, industrialized countries are the main exporters of services, and developing/emerging economies fear te results of opening their economies to further services imports (Sapir, 1985; Stern, 2002). Furthermore, trade liberalization could lead to an increase in services exports within the South area. South-South exports represented 10% of world services exports in 2006 (Dihel, Eschenbach, & Shepherd, 2006), and liberalization can potentially lead to great gains for South economies and the BRIICS especially, which dominate this area. There are also strong disparities with country areas. While India is the closest economy of this
article’s panel, with a Mode 1 STRI of 70.75, South Africa is the most opened (1.8). Even within
the European Union, regulation on trade in services is heterogeneous (Kox, Lejour, & Montizaan, 2004) and Mode 1 STRIs vary from 6.09 (Poland) to 37.95 (Hungary). Also, countries are heterogeneous across sectors. The transportation sector is extremely liberalized in the OECD countries and very protected in the BRIICS, whereas BRIICS countries are on average more open in the Professional sector (see Figure 1). Assessing the impact of border regulation on cross-border trade with a specific focus on countries disparities appears to be relevant for further recommendations on policies for potential gains for the different country areas.
Section 2 explores the methodology used to assess the effects of cross-border regulation on trade in services, and presents the data used for the estimates. Results are presented and tested in section 3. Finally, section 4 provides conclusions based on the observations realized, and recommendations towards further studies and policies.
2. The Gravity Model
2.1 Empirical strategy
The gravity equation founded by Tinbergen (1962) has empirically proven to be the most efficient economic tool to assess the impact of the different determinants of trade. Its low theoretical justification led to further research and extensions, and to new models, econometrically exploitable and with theoretical justifications (Anderson, 1979; Bergstrand, 1985; Anderson & Van Wincoop, 2003; Baier & Bergstrand, 2009). In particular, Anderson & Van Wincoop’s augmentation of the model appears to be particularly adapted to trade in services, as long as services specificities are taken into account. In particular, trade costs differ: Trade in goods requires physical transportation and depends thus on cross-border goods regulation as well as freight costs. Trade in services, on the other hand, is not subject to physical transportation and depends on specific services regulation (Anderson & Van Wincoop, 2003; Schwellnus, 2007). The determinants of bilateral flows can be decomposed in a standard gravity equation, following Kimura & Lee’s model (2006):
(1)
with
= value of imports of country i from country j,
= economic mass of country i, = economic mass of country j,
= geographic distance between the capitals of country i and country j,
= relative distance of country i,
= relative distance of country j,
= error term.
Thus, the basic gravity equation takes the following form:
( )
with
ln(gdpi) = log of GDP of country i,
ln(gdpj) = log of GDP of country j,
ln(dist) = log of geographical distance between capital cities of country i and country j, Remotenessi = log of relative distance of country i
= ln(dist/GDPsharei)
with GDPsharei = share of country i in world GDP,
Remotenessj = log of relative distance of country j
= ln(dist/GDPsharej)
with GDPsharej = share of country j in world GDP,
= country i fixed effects, = country j fixed effects
εij = random disturbance term.
This first simple equation shows the importance of home country and partner country factors, as well as bilateral factors. It can be augmented with geographic economic and cultural determinents of trade. Moreover, the STRI is introduced to the equation:
( )
with
adjacency = dummy for country pairs which share a common border, com_lang = dummy for country pairs which share an official language, com_lang = dummy for country pairs sharing a colonial link,
M1ix = value of sector x Mode 1 STRI in country i,
M1j x= value of sector x Mode 1 STRI in country j,
EIA = dummy for country pairs which are part of a common economic integration agreement.
The empirical analysis is conducted for year 2010 only. Having cross-section data, time fixed effects are absent from the equation. Following Kimura & Lee’s approach (2006), GDP and (3)
population are not ran in the same regression in order to avoid multicollinearity. The same applies for country fixed effects. Membership in a free-trade agreement appears to be particularly difficult to implement into the gravity equation. Indeed, 17 countries out of the sample of 32 countries are part of the European Union, and this membership has a direct impact on their openness to trade. However, including a dummy for a membership to a common economic integration agreement helps controlling for the relationship between the home and the partner country.
Zero-values are an important issue in gravity models: some country pairs may lack trade value data, while other country pairs might not exchange, and it is important not to mix these two different phenomena. Log-linear estimations encounter two main caveats: First, log-linear regressions do not take zero-trade flows into account, which biases the results. Second, they over-estimate the impact of geographical distance, colonial link and membership of a free-trade agreement on the value of trade flows (Silva & Tenreyro, 2003). The Poisson Quasi-Maximum Likelihood (PQML) method appears to be the most appropriate to assess the determinants of bilateral trade through a gravity equation (Silva & Tenreyro, 2003; Schwellnus, 2007; Siliverstovs & Schumacher, 2009). However, this does not solve the issue related to missing data, which will be explored later in section 2.
2.2. Variables
The data provided to build the gravity equation used to assess the correlation between Mode 1 regulation and cross-border trade come from different data sources.
2.2.1 Country characteristics
Three different databases provide data for the main determinants of trade (GDP, distance, adjacency, common language, colonial link, regulation and economic integration agreement). First,
the Centre d’Etudes Prospectives et d’Informations Internationales (CEPII) provides bilateral
distance values, and adjacency and language dummy variables for 224 different countries, including all OECD countries and BRIICS (Mayer & Zignago, 2011). Second, the Monetary Fund
(IMF)’s World Economic Outlook provides data for country GDP and world GDP values for year
2010, which corresponds to the OECD cross-border services trade database data collection year. GDP values are current prices values, expressed in billions of US Dollars. Since the model focuses
on year 2010 exclusively, current prices values expressed in the common currency are the most appropriate for cross-country comparison. remotenessi and remotenessj are computed through
these variables. Third, the GATS provide a list of economic membership agreements in services.
2.2.2 Cross-border services trade values
Cross-country services trade values are provided by the OECD Statistics on International Trade in Services by Partner Country. This database provides trade in services imports & exports values for all OECD countries and BRIICS counties. These values are expressed in US Dollars. To the
author’s best knowledge, this database provides the most accurate and exhaustive data on
international trade in services values. 2010 services trade values were perceived as optimal to fit the STRI data collection dates (see below). It is important to notice that values are still missing for a fair amount of country pairs: out of the 1024 observed country pairs, only 608 provide data for imports 614 for exports (See Table 1). Besides lowering the exhaustivity of the observations, this potentially biases the results, since missing values are under most probabilities lower than the average trade values.
2.2.3 Services trade restrictions
The regulation indicator used for the purpose of the analysis is the STRI developed by the World
Bank Services. The Services Trade Restrictions Database is the first and today’s only attempt to
collect mode-specific regulation indexes by country. It provides one index by country, by trade
mode and by sector. It aims to measure “policies and regulations that discriminate against foreign
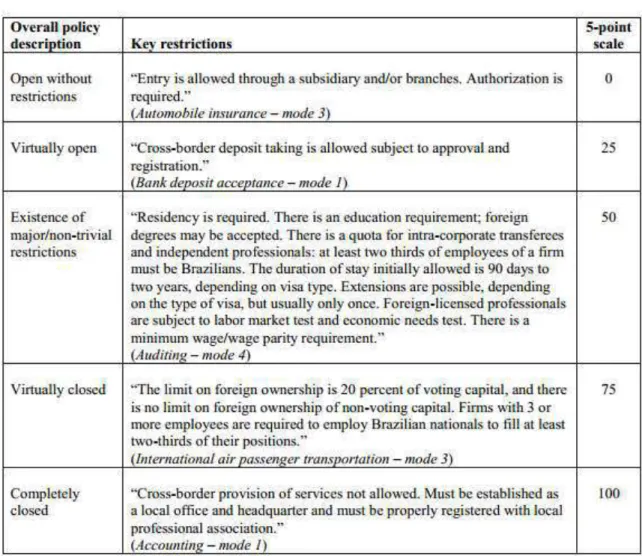
service providers, as well as certain key aspects of the overall regulatory environment that have a significant impact on trade in services” and provides an indicator for every sector and sub-sector affected by country regulation. The data are first collected through questionnaires submitted to local firms from every country. Results are then submitted to governments for feedback. Finally, they are processed and harmonized to allow cross-country comparability. Thus, the index is based on the policy information alone and is built through the assignment of an openness value for every sub-indicator (see Annex Table A2) and its weighted aggregation (Borchert, Gootiiz, & Mattoo, Guide to the Services Trade Restrictions Database (Working Paper), 2012). Among three major methods to measure services trade policy (STRI, ordinal ranking of policy combinations, econometric approach), the authors of the STRI chose the first, due to its simplicity, its
transparency and its robustness. They find that it has the weakness of being subjective, but that its assessments of restrictions are similar to those based on the other methods (Borchert, Gootiiz, & Mattoo, Policy Barriers to International Trade in Services: Evidence from a New Database, 2012). Such an approach also has the advantage of enabling gravity models: the construction of the STRI
doesn’t take trade values into account and this instrument can be incorporated into a gravity
equation. The reverse causality issue between trade in services and the regulatory environment of trading countries always remains a challenge since openness to trade is a cause as well as a consequence of trade flows. However, the STRI limits this caveat, and correlations between services trade values and the STRI can reasonably be established. The STRI is computed for 103 countries, including 26 OECD-countries and the 6 BRIICS countries. The data were collected
between 2008 and 2011. Each country’s STRI provides Most Favored Nation trade restrictions
level, except in the case of European Union countries, where the STRI designs the level of restrictions within the European Union. An “EU-20” country is added, and provides the STRI adopted by European Union countries towards non-European Union countries (Borchert, Gootiiz, & Mattoo, Guide to the Services Trade Restrictions Database (Working Paper), 2012). The current study takes EU-membership into account to determine bilateral level of restrictions. However, some country-specificities could not be assessed and membership to a common economic integration agreement is used as a tool to control for the lack of specification of the index. It is noticeable that most countries have an homogeneous regulatory environment across sectors, but seven countries report total openness to transportation (Chile, China, Indonesia, Mexico, New Zealand, Russia & South Africa). A summary of all regulation indexes is reported in Annex Figures A1 to A4.
2.2.4 More on variables
Considering the data availability, this paper focuses on 2010 cross-border trade in services in 26 OECD countries and the 6 BRIICS countries. For the full list of countries covered, please see Annex Table A3. The services sectors nomenclature differing between the STRD and the OECD databases, logical linkages were produced to fit sectors. Mode 1 trade is not applicable to every sector, and this paper focuses on sectors considered tradable by the STRI, i.e. Financial (all sub-sectors), Transportation (Maritime Shipping International only) and Professional (Accounting and Auditing and Legal Advice Foreign Law). Although the sub-sector specificities are taken into
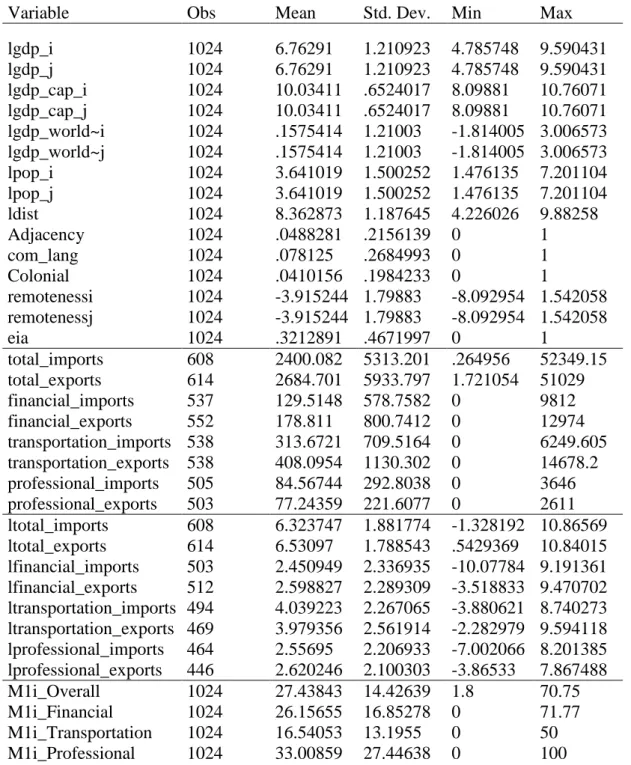
account to determine linkages between the OECD database and the STRD, the analysis focuses on sectors only (Overall, Transportation and Professional) in order to use a larger sample and to facilitate economic interpretation. For the full list of sectors and sub-sectors covered and the link assessed between the OECD database and the STRD, please see Annex Table A4. Table 1 summarizes data used in the analyses.
Table 1: Variables summary
Variable Obs Mean Std. Dev. Min Max
lgdp_i 1024 6.76291 1.210923 4.785748 9.590431 lgdp_j 1024 6.76291 1.210923 4.785748 9.590431 lgdp_cap_i 1024 10.03411 .6524017 8.09881 10.76071 lgdp_cap_j 1024 10.03411 .6524017 8.09881 10.76071 lgdp_world~i 1024 .1575414 1.21003 -1.814005 3.006573 lgdp_world~j 1024 .1575414 1.21003 -1.814005 3.006573 lpop_i 1024 3.641019 1.500252 1.476135 7.201104 lpop_j 1024 3.641019 1.500252 1.476135 7.201104 ldist 1024 8.362873 1.187645 4.226026 9.88258 Adjacency 1024 .0488281 .2156139 0 1 com_lang 1024 .078125 .2684993 0 1 Colonial 1024 .0410156 .1984233 0 1 remotenessi 1024 -3.915244 1.79883 -8.092954 1.542058 remotenessj 1024 -3.915244 1.79883 -8.092954 1.542058 eia 1024 .3212891 .4671997 0 1 total_imports 608 2400.082 5313.201 .264956 52349.15 total_exports 614 2684.701 5933.797 1.721054 51029 financial_imports 537 129.5148 578.7582 0 9812 financial_exports 552 178.811 800.7412 0 12974 transportation_imports 538 313.6721 709.5164 0 6249.605 transportation_exports 538 408.0954 1130.302 0 14678.2 professional_imports 505 84.56744 292.8038 0 3646 professional_exports 503 77.24359 221.6077 0 2611 ltotal_imports 608 6.323747 1.881774 -1.328192 10.86569 ltotal_exports 614 6.53097 1.788543 .5429369 10.84015 lfinancial_imports 503 2.450949 2.336935 -10.07784 9.191361 lfinancial_exports 512 2.598827 2.289309 -3.518833 9.470702 ltransportation_imports 494 4.039223 2.267065 -3.880621 8.740273 ltransportation_exports 469 3.979356 2.561914 -2.282979 9.594118 lprofessional_imports 464 2.55695 2.206933 -7.002066 8.201385 lprofessional_exports 446 2.620246 2.100303 -3.86533 7.867488 M1i_Overall 1024 27.43843 14.42639 1.8 70.75 M1i_Financial 1024 26.15655 16.85278 0 71.77 M1i_Transportation 1024 16.54053 13.1955 0 50 M1i_Professional 1024 33.00859 27.44638 0 100
M1j_Overall 1024 27.43843 14.42639 1.8 70.75 M1j_Financial 1024 26.15655 16.85278 0 71.77 M1j_Transportation 1024 16.54053 13.1955 0 50 M1j_Professional 1024 33.00859 27.44638 0 100
3. Estimations results
3.1 Estimated results
Table 2 and 3 show the estimated results for imports and exports, respectively. Both tables are divided in two sections: OLS regressions and PQML regressions. Let’s first analyse the results provided in Table 2. The first column provides results for a linear regression. The absence of
significativity of countries’ GDP is explained by three factors. First, the country selection provides
data for countries with high GDPs, and the disparity of the countries’ GDPs is relatively small. Second, the analysis does not take country fixed effects into account. Distance and remoteness variables are also not significant, due to the presence of a dummy for economics integration agreement, which is correlated with these variables. However, this does not affect the coefficient of the regulation index. Sharing a common language, a colonial link or the membership to an economic integration agreement is positively correlated to the values of trade, as expected. Sharing a common border appears to be negatively correlated with the values of trade. This result is contradictory with former studies which find that common border has a positive correlation with trade in services. Finally, a closed regulatory environment (high STRI) appears to have a low but significant negative correlation with the value of trade. In column (2), the regression is ran with te PQML method. The significativity of the GDPs of both home and partner country is restored, as
well as both countries’ remoteness. Also, sharing a common border looses its significativity, which
resolves partially the paradox of the log-linear regression. As expected, the value of the coefficient of colonial link decreases. Finally, the impact of regulation is confirmed: the more closed a country is, the less it trades.
Table 2: Determinants of services imports (1) (2) OLS Poisson Quasi-Maximum Likelihood lgdp_i 3.357 8.697** (2.803) (3.643) lgdp_j -4.436 -10.80*** (2.782) (3.327) ldist -3.507 -4.054 (4.076) (4.988) remotenessi 2.532 7.988** (2.792) (3.614) remotenessj -5.287* -11.56*** (2.778) (3.340) adjacency -0.268* -0.199 (0.139) (0.135) com_lang 0.818*** 0.480** (0.170) (0.221) colonial 0.677*** 0.329* (0.134) (0.186) i_m1r -0.0185*** -0.0116* (0.00496) (0.00637) j_m1r -0.0116*** -0.00847** (0.00349) (0.00364) Eia 0.699*** 0.413*** (0.132) (0.143) Constant 32.51 41.38 (45.72) (55.99) Observations 608 608 R-squared 0.720
Note: For column (1), estimates are made using the the log-linear regression method, the explained variable is
ln(total_imports). For column (2), estimates are made using the Poisson Quasi-Maximum Likelihood method, the explained variable is total_imports. Estimates are made without home country fixed effects model. GDP values are in logarithms, adjacency, com_lang , colonial and eia are dummies, and i_m1r and j_m1r are the actual index values. Standard errors are shown in parentheses. ∗∗∗, ∗∗, and ∗ denote 1, 5, and 10 percent level of significance, respectively.
Table 3 describe the regression ran on the value of services exports, using the same method as in Table 2. In the first column, the only significant variables are com_lang, colonial and partner country regulation. The PQML method corrects the results and provides evidence of a negative correlation betwenn trade restrictiveness and exports for both the home country and the partner country. The results obtained confirm the expectations of the analysis: cross-border regulations are highly correlated with trade in services, both for imports and exports.
Table 3: Determinants of services exports
(1) (2)
OLS Poisson Quasi-Maximum Likelihood
lgdp_i 0.421 0.820 (2.995) (3.435) lgdp_j 0.881 -2.805 (3.230) (3.339) ldist -0.774 -3.836 (4.662) (4.761) remotenessi -0.291 0.110 (2.987) (3.419) remotenessj 0.0485 -3.536 (3.221) (3.352) adjacency -0.101 -0.175 (0.146) (0.139) com_lang 1.066*** 0.480*** (0.149) (0.151) colonial 0.664*** 0.570*** (0.134) (0.163) i_m1r -0.00467 -0.0122** (0.00503) (0.00615) j_m1r -0.0154*** -0.00961*** (0.00384) (0.00345) eia 1.018*** 0.633*** (0.123) (0.127) Constant 3.169 39.40 (52.31) (53.35) Observations 614 614 R-squared 0.647
Note: For column (1), estimates are made using the the log-linear regression method, the explained variable is ln(total_exports).
For column (2), estimates are made using the Poisson Quasi-Maximum Likelihood method, the explained variable is
total_exports. Estimates are made without home country fixed effects model. GDP values are in logarithms, adjacency, com_lang , colonial and eia are dummies, and i_m1r and j_m1r are the actual index values. Standard errors are shown in parentheses. ∗∗∗, ∗∗, and ∗ denote 1, 5, and 10 percent level of significance, respectively.
For further precision, analyses were ran on all sectors for which the STRI specific to this sector was available: Financial,Transportation and Professional sectors. Table 4 and 5 present the resuts of PQML estimates on imports and exports, respectively. The correlation between the home
country’s regulatory environment and its level of trade is verified in all sectors except for
professional exports. However, a clear distinction can be made between the effect of the home country and regulation and the effect of the partner country regulation. For both imports and exports flows, the partner country’s regulatory environment only affects the transportation sector, whereas financial and professional sectors seem to be insensitive to it. These results are subject to
caution. Imports data are missing for 416 country pairs, and exports data for 410. Moreover, the scarcity of sectoral data leads to a much smaller sample than at the aggregated level. In particular, the professional sector estimates rely on 505 data points for imports, and 503 data points for exports. Also, 7 countries out of the 32 selected have a zero-value for professional regulation, whereas no more than 1 country have such low values in all other sectors. This singularity of the professional sector may affect the coefficients and lead to an underestimation of the impact of the regulation on trade.
Table 4: Determinants of services imports (Sectors: Financial, Trasnportation, Professional)
(1) (2) (3)
Financial Transportation Professional
lgdp_i -12.15 8.005 40.46*** (10.77) (9.588) (5.174) lgdp_j -31.09** -1.265 -18.47*** (12.94) (6.460) (5.321) ldist -45.40*** 5.190 19.38*** (14.86) (13.27) (6.293) remotenessi -12.83 7.581 39.67*** (10.70) (9.557) (5.160) remotenessj -31.93** -2.025 -19.55*** (12.88) (6.460) (5.336) adjacency -0.982* -0.0141 -0.220 (0.527) (0.285) (0.175) com_lang 1.580*** -0.241 0.520** (0.363) (0.239) (0.216) colonial 0.424 0.0529 0.417* (0.476) (0.259) (0.236) i_m1r_financial -0.0592*** (0.0179) j_m1r_financial -0.00400 (0.00956) eia -0.534 (0.533) i_m1r_transportation -0.0365*** (0.00683) j_m1r_transportation -0.0194*** (0.00650) eia -0.319 (0.299) i_m1r_professional 0.0112*** (0.00375) j_m1r_professional -0.00275 (0.00260) eia 1.013*** (0.213) Constant 502.0*** -61.15 -229.9*** (167.3) (148.8) (70.58) Observations 537 538 505
Note: All estimates are made using the Poisson Quasi-Maximum Likelihood method. In column (1), the explained variable is financial_imports.
In column (2), the explained variable is transportation_imports. In column (3), the explained variable is personal_imports. Estimates are made without home country fixed effects model. GDP values are in logarithms, adjacency, com_lang , colonial and eia are dummies, and
i_m1r_financial, j_m1r_financial, i_m1r_transportation, j_m1r_transportation, i_m1r_professional and j_m1r_professional are the actual index values. Standard errors are shown in parentheses. ∗∗∗, ∗∗, and ∗ denote 1, 5, and 10 percent level of significance, respectively.
Table 5: Determinants of services exports (Sectors: Financial, Trasnportation, Professional)
(1) (2) (3)
Financial Transportation Professional
lgdp_i -17.63 8.991 28.25*** (11.04) (14.91) (5.967) lgdp_j -23.90*** -9.309 -18.29*** (8.960) (7.269) (4.552) ldist -43.54*** -1.629 7.481 (14.29) (19.77) (7.101) remotenessi -18.47* 8.738 27.44*** (10.94) (14.85) (5.972) remotenessj -24.71*** -10.06 -19.24*** (8.932) (7.299) (4.568) adjacency -0.360 -0.0397 -0.616*** (0.498) (0.294) (0.223) com_lang 1.283*** 0.0431 0.701*** (0.273) (0.333) (0.204) colonial 0.625 0.227 0.580** (0.415) (0.328) (0.232) i_m1r_financial -0.0465*** (0.0139) j_m1r_financial -0.00658 (0.00865) i_m1r_transportation -0.0323*** (0.00682) j_m1r_transportation -0.0179*** (0.00692) i_m1r_professional 0.000697 (0.00348) j_m1r_professional -0.000568 (0.00288) eia 0.239 -0.312 0.859*** (0.358) (0.368) (0.217) Constant 480.7*** 16.88 -95.01 (161.0) (221.8) (79.45) Observations 552 538 503
Note: All estimates are made using the Poisson Quasi-Maximum Likelihood method. In column (1), the explained variable is
financial_exports. In column (2), the explained variable is transportation_exports. In column (3), the explained variable is personal_exports. Estimates are made without home country fixed effects model. GDP values are in logarithms, adjacency, com_lang , colonial and eia are dummies, and i_m1r_financial, j_m1r_financial, i_m1r_transportation, j_m1r_transportation, i_m1r_professional and j_m1r_professional are the actual index values. Standard errors are shown in parentheses. ∗∗∗, ∗∗, and ∗ denote 1, 5, and 10 percent level of significance, respectively.
3.2 Robustness checks
In order to avoid multicollinearity, the gravity model used did not take country fixed effects into account. In order to check the robustness of the results found, a new analysis is run, including home country fixed effects. In order to confront the collinearity issue, all variables depending on both home and partner country are merged by being summed together.
Thus, the following equation applies:
with
lgdp = ln(gdpi) + ln(gdpj),
Remoteness= remotenessi + remotenessj,
M1i_x= M1i_x + M1j _y.
The estimated results are reported in the Annex, in Tables A5 and A6. The formerly obtained results hold. In fact, results are as significant or more significant than in the former analyses.
4. Concluding remarks
Among the different determinants of trade in services, regulation plays a major role. In particular, cross-border trade is clearly affected by cross-border regulation. Measuring this effect is difficult since unresolved issues remain. First, there is a potential reverse causality between cross-border regulation and cross-border trade, even though the index used in this study limits the issue. Second, the scarcity of data may have led to biased results, at the aggregated level and at the sectoral level. However, a strong link between cross-border regulation and cross-border trade appears. At the aggregated level, imports and exports are affected by both the home country and
the partner country’s regulation. The financial sector shows a sensitivity to home country’s regulation only. The transportation sector is sensitive to both the home and the partner country’s
regulation, for both imports and exports. Finally, the professional sector is sensitive to home country regulation only, for imports exclusively. The coefficients found are significant but low,
which asks the question of the actual impact of specific cross-border regulation on cross-border trade. If firms react more to overall regulation than to cross-border regulation, this could potentially mean that the effects of a regulation reside more in the signal it sends to potential exports and importers than in the actual bareers built by the legislation. Further research, comparing the impact on cross-border trade of both cross-border specific regulation and overall regulation, could provide elements for policy recommendations. Assessing the complementarity between overall regulation and cross-border regulation can indeed provide evidence on the signals firms react to. This could lead to different types of policy recommendations, and impact the effect of new policies. In particular, openness-oriented policies could benefit from such research. Furthermore, the results highlighted in this article tend to encourage openness regulatory measures. Indeed, there is a strong heterogeneity of regulation across countries, and the most closed countries could gain greatly from liberalization. This applies for emerging countries in particular, since OECD countries remain nowadays the main exporters of services. In the context of an increase in the services trade worldwide, emerging countries might gain much from liberalization, both by becoming the leading trade exporters of their geographic area, but also by catching up on OECD countries.
REFERENCES
Anderson, J. E. (1979). A Theoretical Foundation for the Gravity Equation. AER, 69(1), 106-116.
Anderson, J. E., & Van Wincoop, E. (2003). Gravity with Gravitas: A Solution to the Border Puzzle. American Economic Review, American Economic Association, vol. 93 (1), 170-192.
Baier, S. L., & Bergstrand, J. H. (2009). A Simple Bonus Vetus OLS: "A Simple Method for Approximating International Trade-Cost Effects Using the Gravity Equation". Journal of International Economics.
Bergstrand, J. H. (1985). The Gravity Equation in International Trade: Some Microeconomic Foundations and Empirical Evidence. The Review of Economics and Statistics, Vol. 67, No. 3, 474-481.
Borchert, I., Gootiiz, B., & Mattoo, A. (2012, June). Guide to the Services Trade Restrictions Database (Working Paper). World Bank Policy Research Working Paper.
Borchert, I., Gootiiz, B., & Mattoo, A. (2012). Policy Barriers to International Trade in Services: Evidence from a New Database. World Bank Policy Research Working Paper.
Christen, E., & Francois, J. (2010). Modes of Delivery in Services. Economics working papers 2010-08, Department of Economics, Johannes Kepler University Linz, Austria.
Crozet, M., Milet, E., & Mirza, D. (2013). The Discriminatory Effect of Domestic Regulations on International Trade in Services: Evidence from Firm-Level Data. Université Paris1 Panthéon-Sorbonne (Post-Print and Working Papers) .
Dihel, N., Eschenbach, F., & Shepherd, B. (2006). South-South Services Trade. OECD Trade Policy Working Paper No.39.
Fontagné, L., Guillin, A., & Mitaritonna, C. (2011). Estimations of Tariff Equivalents for the Services Sectors. CEPII.
Francois, J., & Hoekman, B. (2010). Services Trade and Policy. Journal of Economic Literature 48, 642-692.
Kimura, F., & Lee, H.-H. (2006). The Gravity Equation in International Trade in Services. Review of World Economics, vol. 142, no. 1, 92-121.
Kox, H., & Nordås, H. K. (2007). Services Trade and Domestic Regulation. OECD.
Kox, H., Lejour, A., & Montizaan, R. (2004). The free movement of services within the EU . CPB Document 69, CPB Netherlands Bureau for Economic Policy Analysis.
Lennon, C. (2011). Trade in Services and Trade in Goods: Differences and Complementarities. Paris School of Economics, Working Paper N° 2008 - 52.
Mattoo, A. (2001). Developing Countries in the New Round of GATS Negotiations: Towards a Pro-Active Role. Legal Aspect of International Bank, The World Bank.
Mayer, T., & Zignago, S. (2011, December). Notes on CEPII's distances measures: The GeoDist database (Working Paper). CEPII.
Mirza, D., & Nicoletti, G. (2004). Is There Something Special About Trade in Services? Research Paper No. 2002/02, University of Nottingham.
Nordås, H. K., & Kox, H. (2008). Quantifying Regulatory Barriers to Services Trade. OECD.
Pöyhönen, P. (1963). A Tentative Model for the Volume of Trade Between Countries. Weltwirtschaftliches Archiv, Vol 90, 93-100.
Sapir, A. (1985). North-South issues in trade in services. ULB Institutional Repository 2013/8264, ULB -- Université Libre de Bruxelles, 27-42.
Schwellnus, C. (2007). The Effect of Domestic Regulation on Services Trade Revisited. CEPII, Working Paper No 2007-08.
Siliverstovs, B., & Schumacher, D. (2009). Estimating gravity equations: to log or not to log? Empirical Economics, Springer, vol. 36(3), 645-669.
Silva, J. M., & Tenreyro, S. (2003). Gravity-Defying Trade. Working Papers 03-1, Federal Reserve Bank of Boston.
Stern, M. (2002). Predcting South African Trade in Services. Muldersdrift: South African Trade and Industrial Policy Strategies.
Tinbergen, J. (1962). Shaping the World Economy. New York: Twentieth Century Fund.
Van der Marel, E., & Shepherd, B. (2011). Services Trade, Regulation, and Regional Integration: Evidence from Sectoral Data. MPRA Paper No. 34343.
Annex
Table A1: GDP World Share
Cumulated GDP World Share (%)
2010
OECD countries 54.5
BRIICS countries 26.6
Total 81.1
Table A2: Key restrictions and STRI scores for Brazil
Source: “Guide to the Services Trade Restrictions Database” Working Paper, Borchert, I., Gootiiz,
B., Mattoo, A., The World Bank Development Research Group, 2012.
Table A3: List of countries
Region Country
High Income OECD Australia
High Income OECD Austria
BRIICS Brazil
High Income OECD Canada
High Income OECD Chile
BRIICS China
High Income OECD Czech Republic
High Income OECD Denmark
High Income OECD Finland
High Income OECD France
High Income OECD Germany
High Income OECD Greece
High Income OECD Hungary
BRIICS India
BRIICS Indonesia
High Income OECD Ireland
High Income OECD Italy
High Income OECD Japan
High Income OECD Korea
High Income OECD Mexico
High Income OECD Netherlands
High Income OECD New Zealand
High Income OECD Poland
High Income OECD Portugal
BRIICS Russia
BRIICS South Africa
High Income OECD Spain
High Income OECD Sweden
High Income OECD Turkey
High Income OECD United Kingdom
Table A4: Sector linkage between STRI and OECD Databases
STRI Sector STRI Sub-Sector OECD Sector
Overall Total Services
Financial Banking Financial Services
Financial Insurance Insurance Services
Transportation Maritime Shipping
International
Sea transport
Transportation Maritime Shipping
International
Sea transport, passenger
Transportation Maritime Shipping
International
Sea transport, freight
Transportation Maritime Shipping
International
Sea transport, other
Transportation Maritime Shipping
International
Sea freight
Professional Accounting and Auditing Accounting, auditing,
book-keeping and tax consulting services
Professional Legal Legal, accounting, management
consulting and public relations services
F ig u re A1 : Mod e 1 ov er all r eg ulation b y c ount ry S ourc e: S ervic es T ra de R estrictions Da taba se F ig u re A2 : Mod e 1 fina n cial re g ulation b y c ountr y S ourc e: S ervic es T ra de R estrictions Da taba se 0 10 20 30 40 50 60 70 80 AUSTRALIA AUSTRIA BELGIUM BRAZIL CANADA CHILE CHINA CZECH REPUBLIC DENMARK FINLAND FRANCE GERMANY GREECE HUNGARY INDIA INDONESIA IRELAND ITALY JAPAN KOREA MEXICO NETHERLANDS NEW ZEALAND POLAND PORTUGAL RUSSIA SOUTH AFRICA SPAIN SWEDEN TURKEY UNITED KINGDOM UNITED STATES 0 10 20 30 40 50 60 70 80 AUSTRALIA AUSTRIA BELGIUM BRAZIL CANADA CHILE CHINA CZECH REPUBLIC DENMARK FINLAND FRANCE GERMANY GREECE HUNGARY INDIA INDONESIA IRELAND ITALY JAPAN KOREA MEXICO NETHERLANDS NEW ZEALAND POLAND PORTUGAL RUSSIA SOUTH AFRICA SPAIN SWEDEN TURKEY UNITED KINGDOM UNITED STATES
F ig u re A 3 : Mod e 1 t ra ns porta ti on re g ulation b y c ountr y S ourc e: S ervic es T ra de R estrictions Da taba se F ig u re A 4 : Mod e 1 p rof essi ona l re g ulation b y c ou ntr y S ourc e: S ervic es T ra de R estrictions Da taba se 0 10 20 30 40 50 60 AUSTRALIA AUSTRIA BELGIUM BRAZIL CANADA CHILE CHINA CZECH REPUBLIC DENMARK FINLAND FRANCE GERMANY GREECE HUNGARY INDIA INDONESIA IRELAND ITALY JAPAN KOREA MEXICO NETHERLANDS NEW ZEALAND POLAND PORTUGAL RUSSIA SOUTH AFRICA SPAIN SWEDEN TURKEY UNITED KINGDOM UNITED STATES 0 20 40 60 80 10 0 12 0 AUSTRALIA AUSTRIA BELGIUM BRAZIL CANADA CHILE CHINA CZECH REPUBLIC DENMARK FINLAND FRANCE GERMANY GREECE HUNGARY INDIA INDONESIA IRELAND ITALY JAPAN KOREA MEXICO NETHERLANDS NEW ZEALAND POLAND PORTUGAL RUSSIA SOUTH AFRICA SPAIN SWEDEN TURKEY UNITED KINGDOM UNITED STATES
Table A5: Determinants of services imports and exports (1) (2) Imports Exports lgdp -11.31*** -4.793 (3.474) (3.202) ldist -24.67*** -11.56* (6.962) (6.410) remoteness -12.10*** -5.563* (3.477) (3.198) adjacency -0.110 -0.00884 (0.138) (0.127) com_lang 0.361* 0.345** (0.191) (0.163) colonial 0.276 0.455*** (0.177) (0.166) m1r -0.0120*** -0.0120*** (0.00350) (0.00318) eia 0.396*** 0.502*** (0.143) (0.117) Constant 271.3*** 125.3* (77.85) (71.83) Observations 608 614
Note: All estimates are made using the Poisson Quasi-Maximum Likelihood method. In column (1), the explained variable is total_imports. In
column (2), the explained variable is total_exports. Estimates are made with home country fixed effects model. GDP values are in logarithms, adjacency, com_lang , colonial and eia are dummies, and m1r is the the actual index value. Standard errors are shown in parentheses. ∗∗∗, ∗∗, and ∗ denote 1, 5, and 10 percent level of significance, respectively.
Table A6: Determinants of services imports and exports (Sectors: Financial, Transportation, Professional) (1) (2) (3) (4) (5) (6) financial Imports Financial Exports Transportation Imports Trasnportation Exports Professional Imports Professional Exports lgdp -21.22* -19.65*** -1.434 -9.190** -17.62*** -19.85*** (11.30) (6.525) (4.869) (4.525) (4.134) (4.205) ldist -44.91** -41.46*** -4.823 -20.16** -38.00*** -42.20*** (22.40) (13.00) (9.729) (9.059) (8.238) (8.404) remoteness -22.04** -20.45*** -2.205 -9.959** -18.66*** -20.74*** (11.20) (6.483) (4.860) (4.530) (4.120) (4.203) adjacency -1.410*** -0.767** -0.0288 0.0876 -0.228 -0.560*** (0.392) (0.328) (0.203) (0.221) (0.174) (0.216) com_lang 1.151*** 0.621** 0.0697 0.676** 0.520*** 0.479** (0.318) (0.255) (0.239) (0.271) (0.191) (0.223) colonial 0.498 0.497* -0.120 -0.127 0.239 0.454* (0.350) (0.271) (0.298) (0.337) (0.264) (0.249) m1r_financial -0.0196** -0.0146** (0.00962) (0.00625) m1r_transportation -0.0195*** -0.0155*** (0.00469) (0.00521) m1r_professional -0.00334* -0.000963 (0.00187) (0.00238) eia -0.299 0.265 -0.339 -0.103 0.809*** 0.509** (0.467) (0.270) (0.274) (0.301) (0.211) (0.231) Constant 494.8** 457.6*** 47.10 217.2** 409.9*** 460.9*** (252.1) (146.2) (109.1) (101.4) (92.58) (94.21) Observations 537 552 538 538 505 503
Note: All estimates are made using the Poisson Quasi-Maximum Likelihood method. In column (1), the explained variable is financial_imports. In
column (2), the explained variable is financial_exports. In column (3), the explained variable is transportation_imports. In column (4), the explained variable is transportation_exports. In column (5), the explained variable is professional_imports. In column (6), the explained variable is professional_exports. Estimates are made with home country fixed effects model. GDP values are in logarithms, adjacency, com_lang , colonial and eia are dummies, and m1r is the the actual index value. Standard errors are shown in parentheses. ∗∗∗, ∗∗, and ∗ denote 1, 5, and 10 percent level of significance, respectively.