www.atmos-meas-tech.net/7/333/2014/ doi:10.5194/amt-7-333-2014
© Author(s) 2014. CC Attribution 3.0 License.
Atmospheric
Measurement
Techniques
Spectrometric monitoring of atmospheric carbon tetrafluoride (CF
4
)
above the Jungfraujoch station since 1989: evidence of continued
increase but at a slowing rate
E. Mahieu1, R. Zander1, G. C. Toon2, M. K. Vollmer3, S. Reimann3, J. Mühle4, W. Bader1, B. Bovy1, B. Lejeune1, C. Servais1, P. Demoulin1, G. Roland1, P. F. Bernath5,6, C. D. Boone7, K. A. Walker8,7, and P. Duchatelet1,*
1Institute of Astrophysics and Geophysics of the University of Liège, Liège, Belgium 2Jet Propulsion Laboratory, California Institute of Technology, Pasadena, California, USA
3Empa, Laboratory for Air Pollution/Environmental Technology, Swiss Federal Laboratories for Materials Science and
Technology, Duebendorf, Switzerland
4Scripps Institution of Oceanography, University of California at San Diego, La Jolla, California, USA 5Department of Chemistry and Biochemistry, Old Dominion University, Norfolk, Virginia, USA 6Department of Chemistry, University of York, York, UK
7Department of Chemistry, University of Waterloo, Ontario, Canada 8Department of Physics, University of Toronto, Toronto, Canada *now at: Controlatom, Vilvoorde, Belgium
Correspondence to: E. Mahieu (emmanuel.mahieu@ulg.ac.be)
Received: 14 August 2013 – Published in Atmos. Meas. Tech. Discuss.: 21 August 2013 Revised: 22 November 2013 – Accepted: 17 December 2013 – Published: 31 January 2014
Abstract. The long-term evolution of the vertical column
abundance of carbon tetrafluoride (CF4) above the
high-altitude Jungfraujoch station (Swiss Alps, 46.5◦N, 8.0◦E,
3580 m a.s.l.) has been derived from the spectrometric anal-ysis of Fourier transform infrared solar spectra recorded at that site between 1989 and 2012. The investigation is based on a multi-microwindow approach, two encompassing pairs of absorption lines belonging to the R-branch of the strong ν3 band of CF4centered at 1283 cm−1, and two
ad-ditional ones to optimally account for weak but overlapping HNO3interferences. The analysis reveals a steady
accumu-lation of the very long-lived CF4 above the Jungfraujoch
at mean rates of (1.38 ± 0.11) × 1013molec cm−2yr−1from 1989 to 1997, and (0.98 ± 0.02) × 1013molec cm−2yr−1 from 1998 to 2012, which correspond to linear growth rates of 1.71 ± 0.14 and 1.04 ± 0.02 % yr−1 respectively
refer-enced to 1989 and 1998. Related global CF4anthropogenic
emissions required to sustain these mean increases corre-spond to 15.8 ± 1.3 and 11.1 ± 0.2 Gg yr−1 over the above specified time intervals. Findings reported here are compared and discussed with respect to relevant northern mid-latitude
results obtained remotely from space and balloons as well as in situ at the ground, including new gas chromatography mass spectrometry measurements performed at the Jungfrau-joch since 2010.
1 Introduction
Carbon tetrafluoride (CF4) or tetrafluoromethane is a
per-fluorocarbon (PFC-14) whose unambiguous presence in the earth’s atmosphere, from the boundary layer (Rasmussen et al., 1979) to the stratosphere (Goldman et al., 1979), as well as its “near inertness” in the atmosphere (Cicerone, 1979) have raised increasing attention and concern among the sci-entific community since the 1980s.
Its main anthropogenic source is primary aluminum pro-duction, during which CF4 is released through “anode
ef-fect” episodes (e.g., Penkett et al., 1981; Khalil et al., 2003). Since the 1980s, non-negligible CF4 emissions have also
been released increasingly by manufacturing of semiconduc-tors and other electronic devices (e.g., “plasma etching”; Tsai
et al., 2002). The only known but poorly quantified natural sources of CF4 are of lithospheric origin (e.g., Gassmann,
1974; Cicerone, 1979; Harnisch et al., 1996a; Harnisch and Eisenhauer, 1998; Harnisch, 2000). Recently, Deeds et al. (2008) presented the first in situ evidence for this litho-spheric flux, which leads to a background contribution to atmospheric carbon tetrafluoride that lies between 35 and 45 ppt (parts per trillion dry air mole fraction) with the lower value favored on the basis of reported accuracies and preci-sions (for an overview, see Table 2 of Mühle et al., 2010).
PFCs are long-lived species with lifetimes of many thou-sand years (e.g., Ravishankara et al., 1993). With an atmo-spheric lifetime estimated to exceed 50 000 yr, CF4 is by
far the longest lived PFC (WMO-2010, 2011). Combined with a high global warming potential of at least 7390 on a 100 yr time horizon (WMO-2010, 2011), this compound is a strong greenhouse gas whose anthropogenic emissions are deservedly targeted for regulation under the Kyoto Protocol (IPCC, 2001). Because of the absence of atmospheric sinks, CF4shows a nearly constant mixing ratio profile throughout
the atmosphere (e.g., Zander et al., 1992, 1996; Nassar et al., 2006) and its vertical gradient – as quantified, for example, by Fabian et al. (1996), and Harnisch et al. (1996b) using stratospheric balloon-borne cryogenic air sampling between 1987 and 1995 – is only caused by a delayed propagation of the ground-based emissions to higher altitudes. The presence of CF4 in the stratosphere was first reported by Goldman
et al. (1979) who identified the strong ν3 band of CF4 at
1283 cm−1 in a solar limb spectrum recorded in 1978 at 25 km altitude, from aboard a balloon platform. Its verti-cal profile between 15 and 50 km was derived by Zander et al. (1987) from ATMOS (Atmospheric Trace MOlecule Spectroscopy; Farmer, 1987) solar limb observations during the Spacelab 3 shuttle mission in 1985, from subsequent MkIV FTIR balloon flights (e.g., Toon, 1991; Sen et al., 1996), and from the satellite ACE-FTS instrument (Atmo-spheric Chemistry Experiment Fourier Transform Spectrom-eter, e.g., Bernath et al., 2005; Brown et al., 2011).
Recent ground-level air sampling and in situ measure-ments of CF4in both hemispheres (e.g., Khalil et al., 2003;
Mühle et al., 2010) or remotely from space (e.g., Rinsland et al., 2006; Brown et al., 2011) have indicated a signifi-cant slowdown in the rate of increase of atmospheric CF4,
attributed to efforts undertaken by the aluminum industry to limit its emissions during “anode effect” episodes (Inter-national (Primary) Aluminium Institute, 1996, 2009). How-ever, significant uncertainties remain, amongst others due to the increase of Chinese aluminum production and insuffi-ciently defined emission factors for Chinese smelters (Inter-national Aluminium Institute, 2013). Additionally, the mag-nitude and temporal evolution of CF4 emissions from the
semi-conductor industry remain very unclear, despite efforts by the World Semiconductor Council to reduce their emis-sions (WSC, 2013). Based on the inversion with a 2-D box model of a selected subset of AGAGE (Advanced Global
Atmospheric Gases Experiment) ground-level measurements in both hemispheres from the early 1970s to 2008, Mühle et al. (2010, Fig. 4) derived global CF4emissions which
in-creased during the 1970s to reach their maximum during the early 1980s (17.5 ± 1 Gg yr−1) and subsequently declined progressively to stabilize at about 11 Gg yr−1 by 2000 un-til 2008. We refer the reader to Mühle et al. (2010) and ref-erences therein, for a detailed and exhaustive discussion re-garding the evolution of CF4in the global troposphere from
1973 to 2008.
This paper reports on the mean evolution of the vertical carbon tetrafluoride loading integrated over the free tropo-sphere and stratotropo-sphere above the high-altitude Jungfrau-joch station, derived from the spectrometric analysis of Fourier transform infrared (FTIR) solar observations made at that site between 1989 and 2012. Related findings are compared with relevant ones also obtained remotely from space- and balloon-borne solar observations, with new in situ gas chromatography mass spectrometry (GCMS) mea-surements performed by Empa (Laboratory for Air Pollu-tion/Environmental Technology) at the Jungfraujoch since 2010, as well as with recently reconstructed in situ ground level baseline growth rates of CF4 in both hemispheres,
re-ported by Mühle et al. (2010). Our concluding remarks in-clude recommendations for improving the relative accuracies of spectroscopic CF4line parameters which currently remain
estimated at ± 6 %, as compared to the achieved 1–2 % for the in situ data.
Since 1990, the University of Liège research activities are performed within the frame of the Network for the De-tection of Atmospheric Composition Change (NDACC; see http://www.ndacc.org).
2 Instrumentation and original data sets
2.1 FTIR remote-sensing measurements and retrieval strategy
The long-term CF4time series presented and analyzed in this
study has been derived from the analysis of solar spectra recorded between January 1989 and December 2012 under clear-sky conditions at the high-altitude International Scien-tific Station of the Jungfraujoch (hereafter ISSJ; Swiss Alps, 46.5◦N, 8.0◦E; 3580 m a.s.l.). The recordings were made with two very high spectral resolution FTIR spectrometers, a “home-made” instrument primarily used until 1995, and pro-gressively replaced by a faster, more sensitive commercial Bruker-120 HR instrument (Zander et al., 2008).
The initial database investigated here consists of over 5500 spectra recorded with an optical filter covering the 750 to 1400 cm−1spectral region, thus encompassing the strongest infrared band of CF4 – the ν3 centered at 1283 cm−1.
Spectral resolutions (defined as the reciprocal of twice the maximum optical path difference) alternate between 0.004
and 0.006 cm−1, depending on the rate of solar zenith
an-gle variation during the day, and scanning time of successive recordings. Signal-to-noise (S/N) ratios vary between 150 to more than 2500 (average spectra resulting from several suc-cessive individual Bruker scans, predominantly around mid-day, when solar zenith angles vary slowly).
The spectral analyses were performed with the SFIT-2 v3.91 fitting algorithm, a code based on the optimal estima-tion formalism of Rodgers (1976) and specifically developed to retrieve vertical column abundances and mixing ratio pro-files of atmospheric gases from FTIR observations (Connor et al., 1995; Rinsland et al., 1998). This code has been suc-cessfully intercompared with the PROFFIT retrieval algo-rithm (e.g., Hase et al., 2004; Duchatelet et al., 2010), the other tool in use by the NDACC FTIR community for moni-toring numerous tropospheric and stratospheric target gases, worldwide.
Line parameters adopted in the spectral fitting process were taken from the HITRAN 2004 spectroscopic compila-tion (Rothman et al., 2005), including the August 2006 up-dates (e.g., Esposito et al., 2007). For CF4, we selected a set
of pseudo-lines whose intensities and temperature-dependent parameters were derived by one of us (G.C.T.) from a series of high-resolution and high-S/N laboratory spectra recorded by Nemtchinov and Varanasi (2003) under pressure and tem-perature conditions typical of those encountered in the at-mosphere. These pseudo-lines were also used for all CF4
re-mote sensing measurements intercompared in Sect. 3 with our ISSJ findings.
The model atmosphere adopted above the 3.58 km Jungfraujoch altitude consists of a 39 layer scheme with pro-gressively increasing thicknesses to reach 100 km altitude. The pressure-temperature profiles are those specifically com-puted for the ISSJ location on a daily noontime basis by the National Centers for Environmental Prediction (NCEP, Washington, DC; see http://www.ncep.noaa.gov).
While most of the Q- and R-branch features of the ν3band
of CF4can be used for remote sensing retrievals from space
between about 15 and 50 km altitude (see Fig. 18 in Zander et al., 1987), strong absorptions by H2O, HDO, N2O, CO2,
CH4, and weaker ones (i.e., by HNO3, ClONO2and further
H2O isotopologues) combine to heavily interfere with CF4
features in low altitude spectra. Consideration of the relative importance of these interferences in typical solar recordings at the high-altitude, rather dry ISSJ site led us to adopt as “RUN 1” the spectral interval from 1284.73 to 1285.15 cm−1
displayed in Fig. 1, which encompasses 6 of the strongest R-branch features of the CF4 ν3band. Because of the poor
fitting over the two middle CF4 features, severely affected
by H2O and HDO interferences, we excluded from our
ini-tial database all spectra whose water vapor content exceeded 8×10²¹molec cm−2, as well as those observed at solar zenith angles larger than 75 degrees to also minimize line-wing de-pression by the strong N2O line centered at 1284.7 cm−1.
In addition and as illustrated in Fig. 1, we restricted the
subsequent “RUN2” to a composite window in which only the CF4profile was further adjusted. Frame B shows that the
RMS (root mean square) residuals reduced by about a fac-tor 2 in RUN 2 as compared to RUN 1. This RMS decrease was confirmed over the entire database, while the related CF4
columns reduced by less than 0.7 % on average.
The a priori vertical concentration profile for the CF4
tar-get gas was set constant at 72 ppt throughout the atmosphere above ISSJ, consistent with values and associated uncertain-ties derived for the stratosphere (in the 15 to 45 km altitude range) from nearly 1400 solar occultations performed be-tween February 2004 and mid-2012 in the 36.5 to 56.5◦N latitude zone by the ACE-FTS instrument. As there is poor vertical information content in the individual spectra, the constant a priori profile was simply scaled during our fitting procedure.
For all interfering molecules, averaged mixing ratio pro-files based on WACCM (the Whole Atmosphere Community Climate Model; e.g., Chang et al., 2008) model predictions for the 1980–2020 period and the ISSJ station were used as a priori. To reliably account for the weak interfering absorp-tion features by HNO3(see Frame A of Fig. 1), its
concen-tration profile was pre-retrieved for each spectrum from a si-multaneous fit to two NDACC-dedicated spectral intervals (i.e., 867.05–870.00 and 872.25–874.00 cm−1; see Wolff et al., 2008). It was then assumed in the consecutive fitting steps RUN 1 and RUN 2. During RUN 1, the vertical dis-tributions of CF4, CO2, N2O, HDO, H2O, H2O2, H217O and
H218O were independently scaled while in RUN 2, only the
CF4 profile was further adjusted. A S/N ratio of 500,
com-mensurate with the noise level of most retained spectra, was adopted throughout the spectral fitting calculations. Inspec-tion of an exo-atmospheric solar atlas by Farmer and Nor-ton (1989) revealed only a very weak solar absorption feature at 1284.7666 cm−1. It was neglected in the SFIT-2 retrievals, after verification that it had negligible influence on the CF4
results.
After further exclusion of observations with S/N ratios lower than 300 and of high and low individual-carbon tetrafluoride-column outliers falling out of the ± 2.5σ confi-dence interval, the retained database upon which the results and discussion in Sect. 2.2 are based includes 3034 individual CF4column measurements above ISSJ, encompassing 1272
observational days.
Table 1 provides an error budget resulting from major in-strumental and analytical uncertainties that may affect typi-cal individual CF4column amounts above the site. They were
evaluated according to referenced comments or perturbations to a representative subset of spectra. As is often the case when dealing with relatively “new anthropogenic” molecules (for which detailed fundamental spectroscopic laboratory studies are in progress and await validation), the largest sys-tematic error in this work results from the CF4 pseudo-line
parameters (intensities and temperature dependences), which we set at ± 6 % on the basis of evaluations discussed by
Fig. 1. Frame A displays the characteristic absorptions of CF4and the five most significant interfering gases in the “Run 1” micro-window
selected for our CF4retrievals, computed for a typical ISSJ observation on 1 April 2000 (at 63.46◦apparent solar zenith angle and 0.006 cm−1 resolution). Their combination results in the black simulation trace (labeled “Sim.”) which, compared to the actual observation (green curve, labeled “Obs.”) leads to the red residuals (observed minus calculated signals) in Frame B. Because of strong perturbations by the H2O and
HDO interferences, this initial “Run 1” was followed by a second composite “Run 2”, with corresponding residuals displayed by the thick green trace in Frame B.
Irion et al. (2002). A “quality-test” performed with a syn-thetic line-list covering the R-branch of the CF4ν3band,
re-cently released by Boudon et al. (2011), will be evoked in Sect. 3.
2.2 GCMS in situ measurements
The second original data set reported for the first time in this paper results from ground-based gas chromatography – mass spectrometry measurements conducted at ISSJ by Empa. The analyses are performed with a Medusa instrument described in detail by Miller et al. (2008), using 2 L of cryogenically trapped air alternated with measurements of a standard to calibrate the instrument. This leads to one air measurement every two hours. The CF4 measurements at ISSJ began in
2008 but due to some instrumental difficulties, data are only reported here from 2010 onwards. Their precision is ∼ 0.4 % while the accuracy is estimated at 1–2 %. The measurements are based on the Scripps Institution of Oceanography (SIO) SIO-2005 calibration scale and are tightly linked into the AGAGE network.
3 Results and discussion
Figure 2 reproduces the daily mean vertical column abun-dances (expressed in numbers of CF4 molecules per
square cm; left vertical scale) derived above ISSJ between 1989 and 2012. They have been normalized to the mean local pressure monitored at the site during the past decades (i.e., 654 hPa) versus the daily surface pressure measured at noon-time. The database reveals the relative sparseness and disper-sion of the daily mean columns prior to about 1995, resulting from less frequent observations with the home-made instru-ment and their lower S/N ratios. However, as no statistically significant difference was observed between day-coincident CF4columns by both instruments, they have been merged in
the post-1995 daily mean averages.
The right side scale of Fig. 2 reproduces the mean con-stant mixing ratio above ISSJ as returned by the SFIT-2 code on the basis of the physical P-T model atmosphere adopted for each day. The uncertainty on the conversion from left-to-right scale is less than ± 3 %. These mixing ratios cor-respond to moist air values. However, correction factors to
Table 1. Major sources of random and systematic errors on typical individual CF4total column retrievals above the Jungfraujoch.
Error sources Max. error (%) Comments Random errors
Spectra quality 4 Zero offset, S/N and instruments bias
H2O and HDO a priori profiles 3 Changes by a factor 2 in a priori slope and local altitude variability
Temperature/pressure profile 4 ±4 K around NCEP noon profile; also column to mixing ratio conversion Modeling of wing slopes 2 Water vapor and N2O wing slopes affecting the local continuum
TOTAL ∼7
Systematic errors
CF4spectroscopy 6 According to Irion et al. (2002)
H2O and HDO spectroscopy 2 Assuming the HITRAN-04 uncertainties CF4profile 3 Mixing time uncertainty
Forward model 1 Retrieval algorithm-related
ILS 2 ±10 % misalignment and instruments bias
TOTAL ∼7
get dry air mole fractions would be very small, since only the driest observations were retained here (water vapor col-umn of maximum 8 × 10²¹molec cm−2, for an air column of ∼1.4 × 1025molec cm−2above ISSJ).
At first glance, two major features emerge from Fig. 2, namely
i. the large increase of the CF4 column loading above
ISSJ by 2.8 × 10¹⁴molec cm−2 between 1989 and 2012, corresponding to +35 % when referenced to 1989. This increase is entirely of anthropogenic ori-gin; it jumps to over 80 % when the “natural” back-ground level of ∼ 35 ppt, recently reported by Worton et al. (2007) and Mühle et al. (2010), is taken into account. As about one third of the atmospheric mass is located below the Jungfraujoch altitude (mean pressure = 654 hPa) and assuming that the very sta-ble CF4 gas is uniformly distributed through the
atmosphere, its increase above ISSJ translates into a total column change above sea level equal to +4.35 × 10¹⁴molec cm−2, from 1989 to 2012. Glob-ally, this has required a cumulated anthropogenic CF4
emission at the ground totaling nearly 320 Gg over that time frame.
ii. a significant slowing of the rate of CF4
accumula-tion which we first evaluated by splitting the entire database into two subsets, that is, before and after 1 January 1998, respectively, the blue and green plus (+) symbols in Fig. 2. Application of the statistical bootstrap re-sampling method developed by Gardiner et al. (2008; a tool based on a Fourier series that al-lows calculation, at the 2σ confidence level, of the long-term linear component as well as the seasonal modulation of a given data set), returned mean linear yearly increases above ISSJ of (1.38 ± 0.11) × 1013
and (0.98 ± 0.02) × 1013molec cm−2, respectively, for the periods 1989–1997 and 1998–2012. Extrapolation of these increases down to sea level, as done in the previous paragraph, translates into yearly total col-umn changes above sea level equal to (2.14 ± 0.17) × 1013 and (1.50 ± 0.03) × 1013molec cm−2. Glob-ally, these changes require CF4 emission rates equal
to (15.8 ± 1.25) Gg yr−1and (11.1 ± 0.2) Gg yr−1 for
the above mentioned periods.
When taking into account a reasonable lag time of three years for ground-level emissions to uniformly mix in the free troposphere and in the stratosphere (e.g., Fabian et al., 1996; Waugh and Hall, 2002; Anderson et al., 2000; Stiller et al., 2008; Diallo et al., 2012), these derived CF4emission
rates are commensurate with the 1986 to 2009 time averaged global emission estimates reported by Mühle et al. (2010, Table 6, i.e., 14.6 and 10.8 Gg yr−1, for the 1986–1994 and 1995–2009 periods, respectively). A noticeable CF4seasonal
cycle (close to 2 %, peak-to-peak amplitude) also deduced with the bootstrap re-sampling tool (Gardiner et al., 2008) is essentially ascribable to the seasonal variation of temper-ature versus pressure ratios in our adopted layered model atmosphere and to resulting impacts upon temperature- and pressure-dependent line intensities and half widths.
In a second evaluation approach, the CF4 database was
“modeled” with both a second order function and a nonpara-metric least-squares fit, respectively displayed in Fig. 2 by the black- and red curves. For the red curve, a local smooth-ing technique is applied, assumsmooth-ing a Gaussian weightsmooth-ing function and sampling 20 % of the data points at once. The actual bandwidth progressively considers all the measure-ments along the x axis (see Rinsland et al., 2003; and ref-erence therein). Discrete six-year time averaged trends deter-mined from tangential derivatives to the black line at 1992.0,
Fig. 2. FTIR time series of CF4daily mean vertical column abundances above the Jungfraujoch (expressed in numbers of CF4molecules
per square cm), normalized to a mean local pressure of 654 hPa. The solid black and red curves correspond to a second order fit and a 20 % smoothing function to the data points, respectively. The coefficients of the second order black curve are (from the highest order to the independent term): −0.0194, 78.72 and −79835, in units of 1013molec cm−2. In the same units and rank, the coefficients of the linear regression are 1.385, −2675 and 0.979, −1862, for the 1989–1997 (blue) and 1998–2012 (green) time periods, respectively. The right side scale corresponds to the conversion of our measured columns into mean constant mixing ratios above the site, expressed in ppt (parts per trillion).
1998.0, 2004.0 and 2010.0, and related global emissions are provided in Table 2. The latter are in line with the signifi-cant slowing in the CF4emission rates at the ground that
be-gan during the late 1980s, amplified during the early 1990s and leveled off subsequently, as synthesized by Mühle et al. (2010, Fig. 4). The mean global emission of 17.6 Gg yr−1
derived here for the 1989 to 1994 time interval is in good agreement with the mean increase rate of 18 Gg yr−1derived by Zander et al. (1996) from upper stratospheric CF4
mea-surements made in the northern hemisphere by the ATMOS FTIR instrument during the shuttle missions that occurred between 1985 and 1994 (Gunson et al., 1996).
The small but noticeable differences between the red- and black curves in Fig. 2 are indicative of slow temporal growth regime changes by up to +/−1.5 Gg yr−1around the second order fit.
A “quality-test” covering our entire database, performed by replacing the adopted CF4pseudo-lines by the synthetic
line parameters of Boudon et al. (2011), as included in the “supplemental” section of the Hitran 2008 compilation (Rothman et al., 2009), led to the following appreciations: (i) the line positions are good; (ii) on average, the fitting residuals are ∼ 30 % higher; (iii) the retrieved CF4columns
are consistently larger by ∼ 25 %. We believe that this last observed difference may result from the fact that the Boudon
line list, currently restricted to the ν3R-branch, is only based
on one high-resolution FTIR laboratory spectrum at 296 K and a low pressure of 0.17 torr, while the pseudo-lines were derived from a large set of spectra recorded at numerous typical pressure and temperature sets encountered through-out the atmosphere (Nemtchinov and Varanasi, 2003). How-ever, another possible explanation is that this significant bias might also result from contributions, for example, by under-lying hot bands of CF4 not present in the Boudon line list
(Rothman et al., 2009), while they are captured by cross-section measurements.
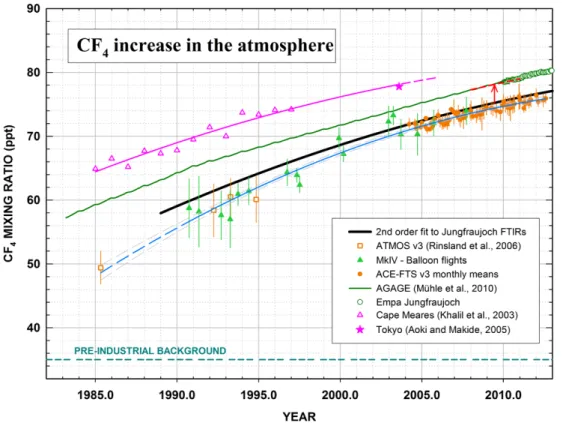
The conversion of our measured CF4column abundances
into mean constant mixing ratios above ISSJ (see vertical scales in Fig. 2), assuming that this molecule is uniformly mixed throughout the entire atmosphere, allows some com-parison with ground-level in situ- and FTIR solar occultation measurements from balloon- and space-based platforms. A few relevant examples, referring to data obtained at northern mid-latitudes, are displayed in Fig. 3, where the thick black line corresponds to the mixing ratios associated to the sec-ond order black curve fitted in Fig. 2 to our daily mean CF4
columns above the site. The green curve reproduces an ex-cerpt of the 1973 to 2010 assimilated monthly CF4mixing
ratios for the northern extra-tropics (i.e., 30–90◦N), based on AGAGE archived air samples and in situ measurements
Table 2. Discrete six-year time averaged CF4trends based on tangential derivatives to the black line of Fig. 2, and corresponding emissions at 1992.0, 1998.0, 2004.0, and 2010.0.
Data source 1989–1994 1995–2000 2001–2006 2007–2012 Columns above ISSJ in 1013molec cm−2yr−1 1.53 ± 0.41 1.29 ± 0.11 1.05 ± 0.07 0.82 ± 0.08 Corresponding global emissions in Gg yr−1 17.6 ± 4.7 14.8 ± 1.25 12.0 ± 0.8 9.4 ± 0.9 Emissions from in situ measurements in Gg yr−1* 15.1 ± 0.7 12.4 ± 0.6 11.0 ± 0.6 10.6 ± 0.4 * from Mühle et al. (2010), assuming a lag time of 3 yr for ground-level emissions to propagate in the free troposphere and stratosphere.
Fig. 3. Comparison between selected CF4mixing ratio time series and trends deduced from infrared remote-sensing and in situ surface measurements (see legend and text for their identification). The various data sets can all be reconciled in term of absolute concentration when accounting for the associated uncertainties affecting the retrieved quantities (calibration scales, line parameters) and time needed for a thorough mixing of CF4throughout the atmosphere. See text for details.
performed at Mace Head (Ireland) and at Trinidad Head (Cal-ifornia, USA), and reported on the recent SIO-2005 calibra-tion scale by Mühle et al. (2010) with a stated accuracy of ∼1 to 2 %. The green open circles show the monthly mean CF4mixing ratios at the ISSJ site measured by Empa within
AGAGE, also reported on the SIO-2005 calibration scale, and in excellent agreement with the other AGAGE data. The pink open triangles correspond to yearly averaged CF4
mix-ing ratios derived by Khalil et al. (2003) from clean air sam-ples collected at Cape Meares (45.5◦N; OR-USA) and re-ported on the MPAE 86 (Max Planck Institute for Aeronomy) calibration scale which has a stated uncertainty of ∼ 10 % (Fabian et al., 1996). The pink star corresponds to a CF4
mix-ing ratio of 77.8 ± 0.6 ppt derived from one air sample col-lected in Tokyo (35.6◦N) in August 2003, using a specific
calibration approach based on the atmospheric 80Kr abun-dance as reference; no calibration accuracy is reported (Aoki and Makide, 2005). The second order curve fitted to the pink triangles and the star is a typical representation of numerous ground-based monitoring efforts conducted in situ at north-ern mid-latitudes during the late 1970s onwards, as illus-trated in Fig. 1 of Mühle et al. (2010). The latter showed that the MPAE 86 and UEA (University of East Anglia) cali-bration scales adopted during these earlier activities have re-ported uncertainties ranging by up to ± 15 % and that related measurements can thus be reconciled with the recent, much more accurate ones based on the SIO-2005 calibration scale (1–2 %).
The filled orange circles represent stratospheric monthly mean CF4 mixing ratios between 20 and 45 km altitude,
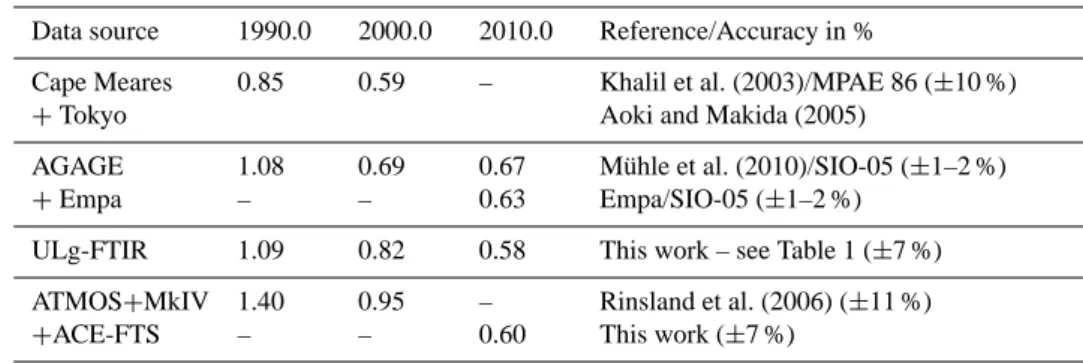
Table 3. Annual rate of increase expressed in ppt yr−1for atmospheric CF4computed for three reference times.
Data source 1990.0 2000.0 2010.0 Reference/Accuracy in % Cape Meares
+Tokyo
0.85 0.59 – Khalil et al. (2003)/MPAE 86 (±10 %) Aoki and Makida (2005)
AGAGE +Empa 1.08 – 0.69 – 0.67 0.63
Mühle et al. (2010)/SIO-05 (±1–2 %) Empa/SIO-05 (±1–2 %)
ULg-FTIR 1.09 0.82 0.58 This work – see Table 1 (±7 %) ATMOS+MkIV +ACE-FTS 1.40 – 0.95 – – 0.60 Rinsland et al. (2006) (±11 %) This work (±7 %)
derived from over 1400 solar occultation measurements (Ver-sion 3 products; Boone et al., 2013) in the 36.5 to 56.5 north-ern latitude zone between 2004 and 2012 with the satellite-embarked ACE-FTS instrument (Bernath et al., 2005). The four orange square symbols reproduce updated mean strato-spheric CF4 mixing ratios between ∼ 20 to 40 km altitude,
derived from the 1985, 1992, 1993 and 1994 ATMOS mis-sions (Version 3; Irion et al., 2002) as reported by Rinsland et al. (2006). Finally, the filled green triangles correspond to the average mixing ratios between 10 and 35 km altitude de-rived from individual MkIV balloon flights performed over 1990 to 2007, between 33 and 68◦N latitude (e.g., Sen et al., 1996). The error bars associated to the ATMOS, MkIV and ACE data points represent the standard deviations of the means. As all the space- and balloon-borne CF4 retrievals
were performed using the same cross-section parameters, not only for R-branch features but also for the strong Q-branch of the CF4ν3band, we assumed that they could reasonably
be interlinked with a 2nd order fitting, represented in Fig. 3 by the blue curve. It clearly shows the significant but slow-ing increase of CF4throughout the stratosphere over the past
decades. The limited number of spectra recorded by ATMOS during the short pioneering US shuttle flights, as compared to the ongoing ACE-FTS mission, clearly shows the advantage of regular, long-term monitoring approaches, which is also true for ground-based investigations. Table 3 provides mean annual mixing ratio increases determined by taking deriva-tives at 1990.0, 2000.0, and 2010.0 to the continuous curves displayed in Fig.3.
The dashed horizontal line in Fig. 3 corresponds to the natural background level of ∼ 35 ppt recently reported by Worton et al. (2007) and Mühle et al. (2010); it has been drawn here to better illustrate the relative anthropogenic con-tribution to the total CF4atmospheric burden which, since the
turn into the 21st century, has overtaken the natural loading. The differences between the various data sets displayed in Fig. 3 are obviously linked, at least partially, to atmospheric transport and can be ascribed to the fact that the instruments involved sound different layers of the atmosphere, namely the boundary layer for AGAGE and Empa as well as Cape Meares and Tokyo, the free troposphere and stratosphere
for our FTIR observations, and the stratosphere only for the satellite and balloon data. Consequently, changes in the emis-sions of a long-lived gas at the ground will mix in the global troposphere within 1 to 2 yr, and propagate in the strato-sphere by upwelling via the tropical pipe, reaching 20 km mid-latitudes within 3 to 5 yr (e.g., Elkins et al., 1996; Stiller et al., 2008). Examples of such time delays have also been reported by Anderson et al. (2000) who found that the inor-ganic chlorine and fluorine loadings in the upper stratosphere lag the related organic loadings at the ground by 4.5 to 5.5 yr. Inputs from the two-dimensional 12-box model of Mühle et al. (2010) indicate for 30–90◦N a mean difference between the tropospheric and stratospheric mixing ratios of 2 ppt over the last decade and of more than 3 ppt in the early 1980s, when the CF4emissions were stronger. In order to assess the
adequacy (and possible bias) of having adopted a constant distribution in our column retrieval calculations and mixing ratio conversion, we built an a priori profile accounting for the time needed for CF4emitted at the ground to propagate
and mix in the stratosphere. Since the 12-box model only in-cluded a single stratospheric level, we based the construction of our a priori CF4 distribution on a profile of mean age of
stratospheric air parcels produced by Diallo et al. (2012), us-ing ERA-Interim reanalyses and a Lagrangian model. Their findings have been confronted to satellite, aircraft and bal-loon observations, showing good agreement, including at northern mid-latitudes. For this region of the atmosphere of interest here, Figs. 2 and 6 of Diallo et al. (2012) provide profiles of mean age of air, with values close to 2 yr at 16 km, 3 yr at 18 km, 4 yr at 20 km and more than 6 yr above 25 km (i.e., showing a gradient of approximately 0.5 yr per km in the lower mid-latitude stratosphere). Assuming the CF4annual
rate of change which prevailed over the last decade as derived by AGAGE (i.e., 0.7 ppt per year), our a priori profile was built such as to present a mixing ratio difference with the sur-face concentration of −1.4 ppt at 16 km, −2.1 ppt at 18 km, −2.8 ppt at 20 km, and so on, up to a constant difference of −4.5 ppt for altitudes above 25 km. All the observations of 2009 were refitted with this non-constant vertical distribu-tion, returning total columns on average 2.5 % higher. Con-version of these columns into corresponding surface mixing
ratios resulted in values systematically higher by 3.7 %, or +2.9 ppt with respect to our standard run assuming a constant vertical distribution. Applying a vertical shift of +2.9 ppt to the FTIR function for 2009 brings it in very good agreement with the AGAGE and Empa time series, as indicated by the dashed red segment matching the green curve and open cir-cles in Fig. 3. This result gives good credibility on the abso-lute scale (1–2 %) provided by the SIO-2005 calibration stan-dard as well as by the CF4spectroscopic parameters used in
our analyses.
Nonetheless, it remains that the uncertainties associated with the various CF4 remote data sets presented in Fig. 3,
namely 7 % for ISSJ (see Table 1), 11 % for ATMOS (Rinsland et al., 2006), 10 % for MkIV (Sen et al., 1996) and 7 % for the recent ACE-FTS data (Brown et al., 2011; Rinsland et al., 2006) have to be maintained as such, until further spectroscopic laboratory and related theoretical in-vestigations narrow these uncertainties.
4 Summary and conclusions
Since the 1980s, the presence of carbon tetrafluoride (CF4)
in the earth’s atmosphere has attracted increasing attention for three reasons, namely (i) its continued accumulation in our atmosphere, (ii) its extremely long lifetime, and (iii) its high global warming potential, 7390 times larger than that of CO2, justifying priority recommendations by the Kyoto
Protocol for CF4 monitoring and regulation. In response to
these recommendations, strongly endorsed by the Network for the Detection of Atmospheric Composition Change, we have reported the first spectrometric measurement from the ground of the atmospheric CF4, and their comparison with
recently reported ground-level in situ mixing ratios which have a quoted accuracy of 1 to 2 % (Mühle et al., 2010).
Owing to the location of the Jungfraujoch (3.58 km a.s.l.) above the polluted and wet boundary layer of the low tro-posphere, we have established a special retrieval procedure that minimizes the perturbations by numerous interfering at-mospheric gases, in particular the residual H2O and HDO
above the site (see Fig. 1), and successfully determined with an accuracy of ± 7 % the loading of CF4throughout the free
troposphere and the stratosphere (i.e., over two thirds of the total mass of the atmosphere) between 1989 and 2012. The spectrometric analysis of a subset of solar spectra recorded at ISSJ during this period (i.e., over 3000 spectra, encompass-ing 1272 days) has allowed, for the first time, the measure-ment of the long-term evolution of the CF4 column
abun-dance from ground-based remote FTIR observations. As illustrated in Fig. 2, the yearly mean CF4
column increase above ISSJ was found equal to (1.38 ± 0.11) × 1013molec cm−2 between 1989 and 1997, and (0.98 ± 0.02) × 1013molec cm−2 from 1998 to 2012. Globally, these increases require 15.8 ± 1.3 and 11.1 ± 0.2 Gg yr−1, respectively, resulting from
anthropogenic CF4 emissions at the ground in the earlier
part of the record, primarily from the aluminum indus-try, and in the latter part also from the manufacturing of electronic devices. The significant slowing in the rate of increase is probably the result of efforts undertaken by the aluminum industry to comply with recommendations from the Kyoto Protocol. Considering our uncertainty, which is almost entirely due to the quality of the CF4 spectroscopic
parameters adopted here (± 6 %), our findings are in good agreement with results derived by Mühle et al. (2010) based on selected ground level in situ measurements in the Northern Hemisphere from 1973 to 2008, and by new in situ GCMS measurements performed since 2010 by Empa at the Jungfraujoch. Moreover, we showed that the adoption of a vertical distribution for CF4, accounting for the time needed
for this very long-lived species to propagate and mix in the stratosphere, provided FTIR converted mixing ratios in very good agreement with the AGAGE data sets, giving good confidence in the absolute mixing ratios derived from the analyses involved here for both techniques.
We also note that the CF4FTIR time series is in excellent
agreement (within 2 %) with solar occultation measurements made from satellites (ATMOS, ACE) and balloons (MkIV). This demonstrates the reliability of the spectral fitting proce-dures for retrieving CF4from the ground, in particular, the
handling of the interfering H2O lines (which are negligible
in solar occultation retrievals above 10 km altitude).
During this study, we noticed that a synthetic CF4linelist
produced by Boudon et al. (2011) was available in the formal HITRAN 2008 compilation (Rothman et al., 2009). Running our entire data set with these line-by-line parameters showed a reasonably good fit of the CF4line positions and contours.
However, the retrieved column abundances were consistently larger by ∼ 25 % than those derived with the pseudo-lines adopted here. This corroborates a conclusion by Boudon et al. (2011), stating that “the new linelist is still approximate concerning line intensities”. We strongly encourage the con-tinuation of such fundamental efforts aimed at improving the accuracy of line parameters for important atmospheric species.
Finally, we expect that the new in situ local measure-ments of CF4performed by Empa at the Jungfraujoch within
AGAGE open interesting possibilities for in-depth statisti-cal intercomparison with our FTIR time series. This side-by-side, high-mountain operation is currently unique, world-wide, and is complementary in terms of techniques involved, vertical atmospheric coverage and, hopefully, long-term reg-ular operation.
Acknowledgements. This work was funded primarily by the
Belgian Federal Science Policy Office (SSD AGACC-II and PRODEX A3C projects). The financial support of MeteoSwiss (Global Atmosphere Watch, GAW) is further acknowledged. We thank the International Foundation High Altitude Research Stations Jungfraujoch and Gornergrat (HFSJG, Bern) and the University
of Liège for supporting the facilities needed to perform the obser-vations and their analyses. We are also grateful to the Fédération Wallonie-Bruxelles and the F.R.S. – FNRS for supporting mission expenses and laboratory developments, respectively. E. Mahieu is Research Associate with the F.R.S. – FNRS. The Liège team wishes to thank Olivier Flock for his excellent technical support. Thanks are also extended to all people having contributed to FTIR data acquisition at the Jungfraujoch, including colleagues from the Royal Observatory of Belgium and from the Belgian Institute for Space Aeronomy, Brussels. The GCMS Medusa measurements are conducted under the auspices of the Swiss national research project HALCLIM with financial support from the Swiss Federal Office for the Environment (FOEN). Collaboration within AGAGE is also acknowledged. The ACE mission is supported primarily by the Canadian Space Agency.
Edited by: G. Stiller
References
Anderson, J., Russell, J. M., Solomon, S., and Deaver, L. E.: Halo-gen Occultation Experiment confirmation of stratospheric chlo-rine decreases in accordance with the Montreal Protocol, J. Geo-phys. Res., 105, 4483–4490, 2000.
Aoki, N. and Makide, Y.: The concentration of krypton in the atmo-sphere – Its revision after half a century, Chem. Lett., 34, 1396– 1397, 2005.
Bernath, P. F., McElroy, C. T., Abrams, M. C., Boone, C. D., Buttler, M., Camy-Peyret, C., Carleer, M., Clerbaux, C., Coheur, P.-F., Colin, R., DeCola, P., De Mazière, M., Drummond, J. R., Dufour, D., Evans, W. F. J., Fast, H., Fussen, D., Gilbert, K., Jennings, D. E., Llewellyn, E. J., Lowe, R. P., Mahieu, E., McConnell, J. C., McHugh, M., McLeod, S. D., Michaud, R., Midwinter, C., Nas-sar, R., Nichitiu, F., Nowlan, C., Rinsland, C. P., Rochon, Y. J., Rowlands, N., Semeniuk, K., Simon, P., Skelton, R., Sloan, J. J., Soucy, M.-A., Strong, K., Tremblay, P. Turnbull, D., Walker, K. A., Walkty, I., Wardle, D. A., Wehrle, V., Zander, R., and Zou, J.: Atmospheric Chemistry Experiment (ACE): mission overview, Geophys. Res. Lett., 32, L15S01, doi:10.1029/2005GL022386, 2005.
Boone, C. D., Walker, K. A., and Bernath, P. F.: Version 3 retrievals for the Atmospheric Chemistry Experiment Fourier Transform Spectrometer (ACE-FTS), in: the Atmospheric Chemistry Ex-periment ACE at 10: A solar Occultation Anthology, edited by: Bernath, P. F., ISBN 978-0-937194-54-9, A. Deepak Publishing, 103–127, 2013.
Boudon, V., Mitchell, J., Domanskaya, A., Maul, C., Georges, R., Benidar, A., and Harter, W. G.: High-resolution spectroscopy and analysis of the ν3/2ν4dyad of CF4, Mol. Phys., 109, 2273–2290,
2011.
Brown, A. T., Chipperfield, M. P., Boone, C. D., Wilson, C., Walker, K. A., and Bernath, P. F.: Trends in atmospheric halogen contain-ing gases since 2004, J. Quant. Spectrosc. Ra., 112, 2552–2566, 2011.
Chang, L., Palo, S., Hagan, M., Richter, J., Garcia, R., Riggin, R., and Fritts, D.: Structure of the migrating diurnal tide in the Whole Atmosphere Community Climate Model (WACCM), Adv. Space. Res., 41, 1397–1406, 2008.
Cicerone, R. J.: Atmospheric carbon tetrafluoride – Nearly inert gas, Science, 206, 59–61, 1979.
Connor, B. J., Parrish, A., Tsou, J.-J., and McCormick, P.: Error analysis of the ground-based microwave ozone measurements during STOIC, J. Geophys. Res., 100, 9283–9291, 1995. Deeds, D. A., Vollmer, M. K., Kulongoski, J. T., Miller, B. R.,
Mühle, J., Harth, C. M., Izbicki, J. A., Hilton, D. R., and Weiss, R. F.: Evidence for crustal degassing of CF4and SF6in Mojave
Desert groundwaters, Geochim. Cosmochim. Acta, 72, 4, 999– 1013, doi:10.1016/j.gca.2007.11.027, 2008.
Diallo, M., Legras, B., and Chédin, A.: Age of stratospheric air in the ERA-Interim, Atmos. Chem. Phys., 12, 12133–12154, doi:10.5194/acp-12-12133-2012, 2012.
Duchatelet, P., Demoulin, P., Hase, F., Ruhnke, R., Feng, W., Chipperfield, M. P., Bernath, P. F., Boone, C. D., Walker, K. A., and Mahieu, E.: Hydrogen fluoride total and partial col-umn time series above the Jungfraujoch from long-term FTIR measurements: Impact of the line-shape model, characteriza-tion of the error budget and seasonal cycle, and comparison with satellite and model data, J. Geophys. Res., 115, D22306, doi:10.1029/2010JD014677, 2010.
Elkins, J. W., Fahey, D. W., Gilligan, J. M., Dutton, G. S., Bar-ing, T. J., Volk, C. M., Dunn, R. E., Myers, R. C., Montzka, S. A., Wamsley, P. R., Hayden, A. H., Bulter, J. H., Thompson, T. M., Swanson, T. H., Dlugokencky, E. J., Novelli, P. C., Hurst, D. F., Lobert, J. M., Ciciora, S. J., McLaughlin, R. J., Thompson, T. L., Winkler, R. H., Fraser, P. J., Steele, L. P., and Lucarelli, M. P.: Air-borne gas chromatograph for in-situ measurements of long-lived species in upper troposphere and lower stratosphere, Geophys. Res. Let., 23, 347–350, 1996.
Esposito, F., Grieco, G., Masiello, G., Pavese, G., Restieri, R., Se-rio, C., and Cuomo, V.: Intercomparison of line-parameter spec-troscopic databases using downwelling spectral radiance, Q. J. R. Meteorol. Soc., 133, 191–202, 2007.
Fabian, P., Borchers, R., Leifer, R., Subbaraya, B. H., Lal, S., and Boy, M.: Global stratospheric distribution of halocarbons, At-mos. Environ., 30, 1787–1796, 1996.
Farmer, C. B.: High resolution infrared spectroscopy of the sun and the Earth’s atmosphere from space, Microchem. Acta, 3, 189– 214, 1987.
Farmer, C. B. and Norton, R. H.: A high-resolution atlas of the in-frared spectrum of the sun and the earth atmosphere from space, Vol. I The Sun, NASA Reference Publication 1224, 1989. Gardiner, T., Forbes, A., de Mazière, M., Vigouroux, C., Mahieu,
E., Demoulin, P., Velazco, V., Notholt, J., Blumenstock, T., Hase, F., Kramer, I., Sussmann, R., Stremme, W., Mellqvist, J., Strand-berg, A., Ellingsen, K., and Gauss, M.: Trend analysis of green-house gases over Europe measured by a network of ground-based remote FTIR instruments, Atmos. Chem. Phys., 8, 6719–6727, doi:10.5194/acp-8-6719-2008, 2008.
Gassmann, M.: Freon-14 in pure Krypton and in Atmosphere, Naturwissenschaften, 61, 127–127, 1974.
Goldman, A., Murcray, D. G., Murcray, F. J., Cook, G. R., van Allen, J. W., Bonomo, F. S., and Blatherwick, R. D.: Identifica-tion of the ν3vibration-rotation band of CF4in infrared
balloon-borne solar spectra, Geophys. Res. Lett., 6, 609–612, 1979. Gunson, M. R., Abbas, M., Abrams, M. C., Allen, M., Brown,
L. R., Brown, T. L., Chang, A. Y., Goldman, A., Irion, F. W., Lowes, L. L., Mahieu, E., Manney, G. L., Michelsen, H. A.,
Newchurch, M. J., Rinsland, C. P., Salawitch, R. J., Stiller, G. P., Toon, G. C., Yung, Y. L., and Zander, R.: The Atmospheric Trace Molecule Spectroscopy (ATMOS) experiment: Deploy-ment on the ATLAS space shuttle missions, Geophys. Res. Lett., 23, 2333–2336, 1996.
Harnisch, J.: Atmospheric perfluorocarbons: sources and concentra-tions, in: Non-CO2greenhouse gases: scientific understanding,
control and implementation, edited by: van Ham, J., Baede, A. P. M., Meyer, L. A., and Ybema, R., Kluwer Academic Publishers, Netherlands, 205–210, 2000.
Harnisch, J. and Eisenhauer, A.: Natural CF4 and SF6 on Earth,
Geophys. Res. Lett., 25, 2401–2404, 1998.
Harnisch, J., Borchers, R., Fabian, P., Gäggeler, H. W., and Schot-terer, U.: Effect of natural tetrafluoromethane, Nature, 384, p. 32, 1996a.
Harnisch, J., Borchers, R., Fabian, P., and Maiss, M.: Tropospheric trends for CF4 and C2F6since 1982 derived from SF6 dated
stratospheric air, Geophys. Res. Lett., 23, 1099–1102, 1996b. Hase, F., Hannigan, J. W., Coffey, M. T., Goldman, A., Hopfner, M.,
Jones, N. B., Rinsland, C. P., and Wood, S. W.: Intercomparison of retrieval codes used for the analysis of high-resolution ground-based FTIR measurements, J. Quant. Spectrosc. Ra., 87, 25–52, 2004.
Intergovernmental Panel on Climate Change, in Climate Change 2001: The scientific basis, edited by: Houghton, J. T., Ding, Y., Griggs, D. J., Noguer, M., van der Linden, P. J., Dai, X., Maskell, K., and Johnson, C. A., Univ. of Cambridge Press, New York, 2001.
International Aluminium Institute: The International Aluminium In-stitute Report on the Aluminium Industry Global Perfluorocar-bon Gas Emissions Reduction Programme – Results of the 2007 Anode Effect Survey, International Aluminium Institute, Lon-don, 2009.
International Aluminium Institute: The International Aluminium In-stitute Report on the Aluminium Industry’s Global Perfluorocar-bon Gas Emissions Reduction Programme – Results of the 2012 Anode Effect Survey, International Aluminium Institute, Lon-don, 2013.
International Primary Aluminium Institute: Anode effect and PFC emission survey 1990–1993, International Aluminium Institute, London, 1996.
Irion, F. W., Gunson, M. R., Toon, G. C., Brown, L. R., Chang, A. Y., Eldering, A., Mahieu, E., Manney, G. L., Michelsen, H. A., Moyer, E. J., Newchurch, M. J., Osterman, G. B., Rinsland, C. P., Salawitch, R. J., Sen, B., Yung, Y. L., and Zander, R.: The At-mospheric Trace Molecule Spectroscopy (ATMOS) experiment version 3 data retrievals, Appl. Opt., 41, 6968–6979, 2002. Khalil, M. A. K., Rasmussen, R. A., Culbertson, J. A., Prins, J. M.,
Grimsrud, E. P., and Shearer, M. J.: Atmospheric perfluorocar-bons, Environ. Sci. Technol., 37, 4358–4361, 2003.
Miller, B. R., Weiss, R. F., Salameh, P. K., Tanhua, T., Greally, B. R., Mühle, J., and Simmonds, P. G.: Medusa: A sample precon-centration and GC/MS detector system for in situ measurements of atmospheric trace halocarbons, hydrocarbons, and sulfur com-pounds, Anal. Chem., 80, 1536–1545, doi:10.1021/ac702084k, 2008.
Mühle, J., Ganesan, A. L., Miller, B. R., Salameh, P. K., Harth, C. M., Greally, B. R., Rigby, M., Porter, L. W., Steele, L. P., Trudinger, C. M., Krummel, P. B., O’Doherty, S., Fraser, P. J.,
Simmonds, P. G., Prinn, R. G., and Weiss, R. F.: Perfluorocarbons in the global atmosphere: tetrafluoromethane, hexafluoroethane, and octafluoropropane, Atmos. Chem. Phys., 10, 5145–5164, doi:10.5194/acp-10-5145-2010, 2010.
Nassar, R., Bernath, P. F., Boone, C. D., McLeod, S. D., Skel-ton, R., Walker, K. A., Rinsland, C. P., and Duchatelet, P.: A global inventory of stratospheric fluorine in 2004 based on At-mospheric Chemistry Experiment Fourier transform spectrome-ter (ACE-FTS) measurements, J. Geophys. Res., 111, D22313, doi:10.1029/2006JD007395, 2006.
Nemtchinov, V. and Varanasi, P.: Thermal infrared absorption cross-sections of CF4 for atmospheric applications, J. Quant.
Spec-trosc. Ra., 82, 461–471, 2003.
Penkett, S. A., Prosser, N. D. J., Rasmussen, R. A., and Khalil, M. A. K.: Atmospheric measurements of CF4and other
fluorocar-bons containing the CF3grouping, J. Geophys. Res., 86, 5172–
5178, 1981.
Rasmussen, R. A., Penkett, S. A., and Prosser, N.: Measurement of carbon tetrafluoride in the atmosphere, Nature, 277, 549–551, 1979.
Ravishankara, A. R., Solomon, S., Turnispeed, A. A., and Warren, R. F.: Atmospheric lifetimes of long-lived halogenated species, Science, 259, 194–199, 1993.
Rinsland, C. P., Jones, N. B., Connor, B. J., Logan, J. A., Pougatchev, N. S., Goldman, A., Murcray, F. J., Stephen, T. M., Pine, A. S., Zander, R., Mahieu, E., and Demoulin, P.: Northern and southern hemisphere ground-based infrared measurements of tropospheric carbon monoxide and ethane, J. Geophys. Res., 103, 28197–28218, 1998.
Rinsland, C. P., Mahieu, E., Zander, R., Jones, N. B., Chipperfield, M. P., Goldman, A., Anderson, J., Russell III, J. M., Demoulin, P., Notholt, J., Toon, G. C., Blavier, J.-F., Sen, B., Sussmann, R., Wood, S. W., Meier, A., Griffith, D. W. T., Chiou, L. S., Murcray, F. J., Stephen, T. M., Hase, F., Mikuteit, S., Schulz, A., and Blumenstock, T., Long-term trends of inorganic chlo-rine from ground-based infrared solar spectra: past increases and evidence for stabilization, J. Geophys. Res., 108, 4252, doi:10.1029/2002JD003001, 2003.
Rinsland, C. P., Mahieu, E., Zander, R., Nassar, R., Bernath, P. F., Boone, C. D., and Chiou, L. S.: Long-term stratospheric car-bon tetrafluoride (CF4)increase inferred from 1985–2004
space-based solar occultation measurements, Geophys. Res. Lett., 33, L02808, doi:10.1029/2005GL024709, 2006.
Rodgers, C. D.: Retrieval of atmospheric temperature and composi-tion from remote measurements of thermal radiacomposi-tion, Rev. Geo-phys., 14, 609–624, 1976.
Rothman, L. S., Jacquemart, D., Barbe, A., Chris Benner, D., Birk, M., Brown, L. R., Carleer, M. R., Chackerian Jr., C., Chance, K., Coudert, L. H., Dana, V., Devi, V. M., Flaud, J.-M., Gamache, R. R., Goldman, A., Hartmann, J.-M., Jucks, K. W., Maki, A. G., Mandin, J.-Y., Massie, S. T., Orphal, J., Perrin, A., Rinsland, C. P., Smith, M. A. H., Tennyson, J., Tolchenov, R. N., Toth, R. A., Vander Auwera, J., Varanasi, P., and Wagner G.: The HITRAN 2004 molecular spectroscopic database, J. Quant. Spectrosc. Ra., 96, 139–204, 2005.
Rothman, L. S., Gordon, I. E., Barbe, A., Chris Benner, D., Bernath, P. F., Birk, M., Boudon, V., Brown, L. R., Campar-gue, A., Champion, J.-P., Chance, K., Coudert, L. H., Dana, V., Devi, V. M., Fally, S., Flaud, J.-M., Gamache, R. R.,
Gold-man, A., Jacquemart, D., Kleiner, I., Lacome, N., Lafferty, W. J., Mandin, J.-Y., Massie, S. T., Mikhailenko, S. N., Miller, C. E., Moazzen-Ahmadi, N., Naumenko, O. V., Nikitin, A. V., Or-phal, J., Perevalov, V. I., Perrin, A., Predoi-Cross, A., Rinsland, C. P., Rotger, M., Simeckova, M., Smith, M. A. H., Sung, K., Tashkun, S. A., Tennyson, J., Toth, R. A., Vandaele, A. C., and Vander Auwera, J.: The HITRAN 2008 molecular spectroscopic database, J. Quant. Spectrosc. Ra., 110, 533–572, 2009. Sen, B., Toon, G. C., Blavier, J.-F., Fleming, E. L., and Jackman,
C. H.: Balloon-borne observations of midlatitude fluorine abun-dance, J. Geophys. Res., 101, 9045–9054, 1996.
Stiller, G. P., von Clarmann, T., Höpfner, M., Glatthor, N., Grabowski, U., Kellmann, S., Kleinert, A., Linden, A., Milz, M., Reddmann, T., Steck, T., Fischer, H., Funke, B., López-Puertas, M., and Engel, A.: Global distribution of mean age of stratospheric air from MIPAS SF6 measurements, Atmos. Chem. Phys., 8, 677–695, doi:10.5194/acp-8-677-2008, 2008.
Toon, G. C.: The JPL MkIV interferometer, Opt. Photonics News, 2, 19–21, 1991.
Tsai, W.-T., Chen, H.-P., and Hsien, W.-Y.: A review of uses, envi-ronmental hazards and recovery/recycle technologies of perflu-orocarbons (PFCs) emissions from the semiconductor manufac-turing processes, J. Loss Prev. Process Ind., 15, 65–75, 2002. Waugh, D. and Hall, T.: Age of stratospheric air:
The-ory, observations and models, Rev. Geophys., 40, 1010, doi:10.1029/2000RG000101, 2002.
WMO (World Meteorological Organization): Scientific Assessment of Ozone Depletion: 2010, Global Ozone Research and Monitor-ing Project, Report N◦52, Geneva, Switzerland, 2011.
Wolff, M. A., Kerzenmacher, T., Strong, K., Walker, K. A., Toohey, M., Dupuy, E., Bernath, P. F., Boone, C. D., Brohede, S., Catoire, V., von Clarmann, T., Coffey, M., Daffer, W. H., De Mazière, M., Duchatelet, P., Glatthor, N., Griffith, D. W. T., Hannigan, J., Hase, F., Höpfner, M., Huret, N., Jones, N., Jucks, K., Kagawa, A., Kasai, Y., Kramer, I., Küllmann, H., Kuttippurath, J., Mahieu, E., Manney, G., McElroy, C. T., McLinden, C., Mébarki, Y., Mikuteit, S., Murtagh, D., Piccolo, C., Raspollini, P., Ridolfi, M., Ruhnke, R., Santee, M., Senten, C., Smale, D., Tétard, C., Ur-ban, J., and Wood, S.: Validation of HNO3, ClONO2, and N2O5
from the Atmospheric Chemistry Experiment Fourier Transform Spectrometer (ACE-FTS), Atmos. Chem. Phys., 8, 3529–3562, doi:10.5194/acp-8-3529-2008, 2008.
World Semiconductor Council: Joint Statement of the 16th Meeting of the World Semiconductor Council (WSC), Lisbon, Portugal, 2013.
Worton, D. R., Sturges, W. T., Gohar, L. K., Shine, K. P., Martinerie, P., Oram, D. E., Humphrey, S. P., Begley, P., Gunn, L., Barnola, J. M., Schwander, J., and Mulvaney, R.: Atmospheric trends and radiative forcing of CF4and C2F6inferred from firn air, Environ.
Sci. Technol., 41, 2184–2189, 2007.
Zander, R., Rinsland, C. P., Farmer, C. B., and Norton, R. H.: In-frared spectroscopic measurements of halogenated source gases in the stratosphere with the ATMOS instrument, J. Geophys. Res., 92, 9836–9850, 1987.
Zander, R., Gunson, M. R., Farmer, C. B., Rinsland, C. P., Irion, F. W., and Mahieu, E.: The 1985 chlorine and fluorine inventories in the stratosphere based on ATMOS observations at 30◦north latitudes, J. Atmos. Chem., 15, 171–186, 1992.
Zander, R., Solomon, S., Mahieu, E., Goldman, A., Rinsland, C. P., Gunson, M. R., Abrams, M. C., Chang, A. Y., Salawitch, R. J., Michelsen, H. A., Newchurch, M. J., and Stiller, G. P.: In-crease of stratospheric carbon tetrafluoride (CF4)based on
AT-MOS observations from space, Geophys. Res. Lett., 23, 2353– 2356, 1996.
Zander, R., Mahieu, E., Demoulin, P., Duchatelet, P., Roland, G., Servais, C., De Mazière, M., Reimann, S., and Rinsland, C. P.: Our changing atmosphere: Evidence based on long-term infrared solar observations at the Jungfraujoch since 1950, Sci. Total En-viron.t, 391/2-3, 185–195, 2008.