i
THÈSE
En vue de l’obtention du
DOCTORAT DE L’UNIVERSITÉ DE TOULOUSE
Délivré par l'Université Toulouse 3 - Paul Sabatier
Présentée et soutenue par
Paolo Maria SCALA
Le 7 octobre 2019
Implémentations d'optimisation-simulation pour l'harmonisation des opérations dans les grands aéroports
Optimization-Simulation implementations for harmonizing operations at big airports
Ecole doctorale : AA - Aéronautique, Astronautique Spécialité : Mathématiques Appliquées
Unité de recherche : ENAC Lab Thèse dirigée par
Daniel DELAHAYE et Pierre MARECHAL
Jury
M. Michael Schultz, Rapporteur M. Miquel Angel Piera Eroles, Rapporteur
Mme Judith Rosenow, Examinatrice M. Daniel Delahaye, Directeur de thèse M. Pierre Marechal, Co-directeur de thèse M. Miguel Mujica Mota, Invited member
ii
iii
Abstract
The constant growth of air traffic, especially in Europe, is putting pressure on airports, which, in turn, are suffering congestion problems. The airspace surrounding airport, terminal manoeuvring area (TMA), is particularly congested, since it accommodates all the converging traffic to and from airports. Besides airspace, airport ground capacity is also facing congestion problems, as the inefficiencies coming from airspace operations are transferred to airport ground and vice versa. The main consequences of congestion at airport airspace and ground, is given by the amount of delay generated, which is, in turn, transferred to other airports within the network. Congestion problems affect also the workload of air traffic controllers that need to handle this big amount of traffic.
This thesis deals with the optimization of the integrated airport operations, considering the airport from a holistic point of view, by including operations such as airspace and ground together. Unlike other studies in this field of research, this thesis contributes by supporting the decisions of air traffic controllers regarding aircraft sequencing and by mitigating congestion on the airport ground area. The airport ground operations and airspace operations can be tackled with two different levels of abstractions, macroscopic or microscopic, based on the time-frame for decision-making purposes. In this thesis, the airport operations are modeled at a macroscopic level.
The problem is formulated as an optimization model by identifying an objective function that considers the amount of conflicts in the airspace and capacity overload on the airport ground; constraints given by regulations on separation minima between consecutive aircraft in the airspace and on the runway; decision variables related to aircraft entry time and entry speed in the airspace, landing runway and departing runway choice and pushback time. The optimization model is solved by implementing a sliding window approach and an adapted version of the metaheuristic simulated annealing. Uncertainty is included in the operations by developing a simulation model and by including stochastic variables that represent the most significant sources of uncertainty when considering operations at a macroscopic level, such as deviation from the entry time in the airspace, deviation in the average taxi time and deviation in the pushback time. In this thesis, optimization and simulation techniques are combined together by developing two methods that aim at improving the solution robustness and feasibility. The first method acts as a validation tool for the optimized solution, and it improves the robustness of solution by iteratively fine-tuning some of the optimization model input parameters. The second method embeds the optimization in a simulation environment by taking full advantage of the sliding window approach and creating a loop for a continuous improvement of the optimized solution at each window of the sliding window approach. Both methods prove to be effective by improving the performance, lowering the total amount of conflicts up to 23.33% for the first method and up to 11.2% for the second method, however, in contrast to the deterministic method, the two methods they are not able to achieve a conflict-free scenario due to the effect of uncertainty.
In general, the research conducted in this thesis highlights that uncertainty is a factor that affects to a large extent the feasibility of optimized solution when applied to real-world instances, and it, moreover, confirms that using simulation together with optimization has the potentiality to
iv
deal with uncertainty. The framework developed can be potentially applied to similar problems and different optimization solving methods can be adapted to it.
v
Resumé
L’augmentation constante du trafic aérien, spécialement en Europe, exerce une pression sur les aéroports, qui en conséquence sont souvent congestionnés. La zone aérienne entourant les aéroports, l’aire de manœuvre terminale (TMA), est particulièrement encombrée, puisqu’elle accueille tout le trafic aéroportuaire. Outre la zone aérienne, le partie sol fait aussi face à des problèmes d’encombrement, ainsi l’inefficacité des opérations en zone aérienne est transférée au sol. Cet encombrement des zones aériennes et terrestres des aéroports a pour conséquence de générer des retards, qui sont ensuite reportés sur les autres aéroports du réseau. Le problème d’encombrement affecte également la charge de travail des contrôleurs aériens qui doivent gérer ce large trafic.
Cette thèse porte sur l’optimisation des opérations intégrées aux aéroports, en considérant l’aéroport d’un point de vue holistique et en incluant les activités aériennes et terrestres. Contrairement aux autres études dans ce domaine, cette thèse apporte sa contribution en appuyant les décisions des contrôleurs aériens en terme de séquencement des avions et en atténuant l’encombrement de la partie sol des aéroports. Les activités terrestres et aériennes peuvent être abordées avec deux différents niveaux d’abstractions, macroscopique, ou microscopique, en raison de différent délais de prise de décision. Dans cette thèse, les activités sont modélisées au niveau macroscopique.
Le problème est formulé comme un modèle d’optimisation en identifiant une fonction objective qui prend en compte le nombre de conflits dans l’espace aérien et la surcharge au sol des aéroports; contraintes données par la régulation sur le minimum de séparation entre des avions consécutifs dans la zone aérienne et sur la piste de décollage; variables de décision liées au temps d’entrée de l’avion et à la vitesse d’entrée dans l’espace arien, au choix de la piste d’atterrissage et de la piste au départ et à l’heure de push-back. Le modèle d’optimisation est résolu en implémentant une approche par fenêtre glissante et par une version adaptée de la métaheuristique de recuit simulé. Des incertitudes sont ajoutées dans les activités en développant un modèle de simulation et en incluant des variables stochastiques représentant des sources d’incertitudes comme une variation de l’heure d’entrée dans l’espace aérien de l’aéroport, une variation de l’heure moyenne de temps du roulage ou encore une variation dans l’heure de push-back des avions. Dans cette thèse, les techniques d’optimisation et de simulations sont combinées en développant deux méthodes qui visent à améliorer la robustesse et la faisabilité des solutions. La première méthode se comporte comme un outil de validation pour la solution optimisée, elle améliore la robustesse de la solution en ajustant finement à plusieurs reprises plusieurs paramètres d’entrée du modèle d’optimisation. La deuxième méthode intègre l’optimisation dans un environnement de simulation en tirant pleinement parti de l’approche par fenêtre glissante et en utilisant une itération pour améliorer continuellement la solution optimisée à chaque fenêtre temporelle. Les deux méthodes ont prouvé leur efficacité en améliorant les performances, en diminuant le nombre de conflit jusqu’à 23.33% pour la première méthode et jusqu’à 11.2% pour la deuxième méthode, néanmoins, contrairement aux résultats dans les cas déterministes, elles ne sont pas capables de créer un scénario sans aucun conflit à cause de l’incertitude.
vi
En général, l’étude menée dans cette thèse souligne que l’incertitude est un facteur qui affecte dans une large mesure la faisabilité d’une solution optimisée quand elle est appliquée à des instances du monde réel, et cela, confirme que l’utilisation combinée de simulation et d’optimisation a le potentiel de faire face aux incertitudes. Le système développé peut être potentiellement appliqué à autres problèmes similaires à d’autres méthodes d’optimisation peuvent être utilisées.
vii
Acknowledgements
First, I would like to express all my gratitude to Prof. Daniel Delahaye, as my thesis supervisor. He enlightened me with his wisdom and made me always comfortable with his kindness. Second, but first in my personal rank, I would like to thank Dr. Miguel Mujica Mota, my co-supervisor. You know me since already 6 years, when I was still a master student, young and with a lot of enthusiasm. Later, you guided me in this long and difficult journey that a PhD is. Now, I am still young, but with a bit of more experience, thanks also to you. As I often call you “Master”, you have been a Master for me not only in the subject of Modeling and Simulation but also in the difficult subject of Life. I will be always grateful to you, and you will be always my Master.
A special thanks to the jury that agreed on evaluating my PhD thesis, especially Prof. Miquel Angel Piera and Dr. Michael Schultz, whose comments have been precious for me to improve my thesis manuscript. Dr. Judith Rosenow that kindly accepted to be examiner and Prof. Marechal who kindly supported my PhD candidature through these years.
I would like to mention all the different institutions that in these years have supported me, morally and financially. Without your support I could have not reached this far. Amsterdam University of Applied Science, Aviation Academy and Amsterdam International School of Business; Ecole Nationale de l’Aviation Civile; Ecole Doctorale Aeronautique Astronautique; Universite Toulouse 3 - Paul Sabatier.
Now, I would like to thank all the people that have had an influence in my life during these years of PhD, most of them are close friends, some of them acquaintances, many of them are still in my life, some of them not anymore. The list is long, I hope not to forget anyone, and in case I do, my sincere apologies.
I would like to thank my friends at ENAC. Every time I came there, you have welcomed me in the warmest and best way possible, I will always keep nice memories of our lunches together, coffees and card games. Among the others, I would like to mention Maji, the best PhD mate and one of the nicest person I have ever met, you will always be a friend for me. My dear friend Tambeth, I will remember our Toulouse football matches watched together; Jun, Man, Imen, Romaric, Florian, Vincent, Isabelle, Georges and Andrija.
A special mention to Dr. Richard Wu, and some of his PhD students Yimeng, Agnes and Dragon, at the UNSW in Sydney. With you I have spent very nice three months, both working and exploring a bit Australia.
Living in Amsterdam for the past years has been a great experience mostly for my special friends, the “Cocoteros”. Alen, Mehdi, Humberto, Jayme and Joseba. I am sure that there will be many other adventures ahead of us! I want to mention also Simge, Nadine, Nico, Margarita and Daiki. The people from Koning Wilhelminaplein 318, Alen (again), Jakub, Eva and Robert. Another special mention to Abdel el Makhloufi, a very kind-hearted person, a good friend and a supreme researcher; Ann and Idalia my Mexican(half-Belgian) colleagues/friends; my other Mexican friends Omar, Pedro, Alma, Tania, hopefully I will come to visit you again in Mexico!
viii
A special mention also to the Dutch Benelux Simulation Society and the EUROSIM, I am proud to be part of this community.
My childhood friends from Crotone, even from far, your support was critical for my achievements, I owe you many. Dor, Tiger, Salvatore, Marco, you are the closest friends I have, and you know how much you all mean to me. I hope to celebrate many other achievements with you. Masto Arturo, Angela, Franco, Jessica, Giovanni, Giulia, Anastasia, il Bomber, Mimmo, Simone, Franci Fra, Ilaria, Sara, Isabella, Maria Grazia, you are my best friends as well, thanks for being part of my life. I cannot forget to mention all my dear childhood friends from Tufolo: Marco, Tommaso, Alessio, Luigi, Carlo, Demetrio, Scudo, Mattia, Dario, Danilo etc.
Finally, I want to say a big thank to my family, who was always supportive, my brothers Luca and Mario, my many cousins, uncles and aunts, my two sisters-in-law, my young “little pest” nephew Gioele and the other two little ones that are about to come to this world. I love you all. Last but not least, the person who made all this possible, providing me education and teaching me the principles and values of life. Nonetheless, providing me support in all my new challenges, my beloved Nonna Franca. You are always in my heart and I know I am in yours as well. Dear Nonna, I hope you are proud of me, even just a 1% as much as I am proud of you would be already a lot. I love you.
ix Contents
Chapter 1 ... 1
Introduction ... 1
1.1. Background and motivation ... 1
1.2. Airport characteristics and related operations ... 5
1.2.1. Airport definition and role ... 5
1.2.2. Airport classifications ... 5 1.2.3. Airport stakeholders ... 6 1.2.4. Airport sections ... 8 1.2.4.1. Landside ... 9 1.2.4.2. Airside ... 10 1.3. TMA airspace ... 16 1.4. Thesis contributions ... 18 1.5 Thesis outline ... 19 Chapter 2 ... 20 Literature review ... 20
2.1. Optimization for airport operations ... 20
2.1.1. Aircraft scheduling and sequencing problem ... 20
2.1.2. Conflict detection and resolution (CD&R) problem ... 22
2.1.3. Airport surface management ... 22
2.1.4. Integration of airspace and ground operations ... 24
2.1.5. Gate assignment problem ... 25
2.2. Simulation approaches for airport operations ... 27
2.2.1. Specific-purpose simulation applications ... 28
2.2.2. General-purpose simulation applications ... 29
2.3. Optimization-Simulation solutions for airport operations ... 30
Chapter 3 ... 33
Problem description, modeling and general solution approach ... 33
3.1. Airport operations at a macroscopic level ... 33
3.1.1. Operations description and modeling ... 33
3.1.2. Model assumptions ... 36
3.1.3. Optimization model ... 37
3.1.3.1. Decision variables ... 37
3.1.3.2. Objective and constraints ... 39
x
3.2. General architecture of the Opt-sim approach ... 44
3.2.1. Sliding window approach ... 44
3.2.2. Optimization by simulated annealing ... 46
3.2.3. Simulating by discrete event simulation ... 51
3.2.3.1. Simulation model of airport operations at a macroscopic level ... 53
3.3. Methodological approach for combining simulation together with optimization ... 56
3.3.1. Opt-sim method 1: ex post optimization ... 57
3.3.2. Opt-Sim method 2: Algorithmic approach for a continuous improvement of the solution ... 58
3.4. Conclusion ... 62
Chapter 4 ... 63
Experiment on a real case study: Paris Charles de Gaulle Airport ... 63
4.1. Implementation of Opt-Sim method 1 ... 65
4.1.1. Scenarios and results ... 65
4.1.1.1. Default scenario results ... 67
4.1.1.2. Results from scenario 1 and 2 ... 68
4.2. Implementation of Opt-Sim method 2 ... 79
4.2.1. Parameter setting for the Opt-Sim Method 2 ... 79
4.2.2. Scenarios ... 80
4.2.3. Results ... 80
4.2.3.1. Default scenario ... 81
4.2.3.2. Alpha scenario ... 83
4.2.3.3. Separation minima increase scenario ... 85
4.2.3.4. Objective function weight scenario... 87
4.2.3.5. Comparison between the scenarios... 90
4.3. Conclusion ... 95
Chapter 5 ... 97
Conclusion and future work ... 97
5.1. Conclusion ... 97
5.2. Future work ... 98
Bibliography ... 100
Appendix A: Simulation model of the Opt-sim method 1 (SIMIO) ... 110
xi
List of Figures
Figure 1.1: Air traffic trend for the last decades to date (a); Air traffic forecasts for the next 20 years
(b) (Airbus GMF 2017) ... 1
Figure 1.2: Generated aircraft demand (Airbus GMF 2017) ... 2
Figure 1.3: Comparison between air traffic in 2016 and 2017 (EUROCONTROL 2018b) ... 2
Figure 1.4: Top five European airports in terms of passenger traffic and aircraft movements (EUROCONTROL 2018b) ... 3
Figure 1.7: Centralized airport terminal layout, Amsterdam Schiphol Airport (source: https://www.ifly.com/amsterdam-schiphol/terminal-map). ... 9
Figure 1.8: Decentralized airport terminal layout, Paris Charles de Gaulle Airport (source: https://www.ifly.com/paris-charles-de-gaulle-airport/terminal-map). ... 10
Figure 1.9: A schematic representation of contact and remote gate configuration. ... 11
Figure 1.10: Airport airside layout: parallel runways (source: AIP France). ... 13
Figure 1.11: Airport airside layout: crossing runways (source: PD-USGov-FAA). ... 13
Figure 1.12: Airport airside layout: hybrid configuration (source: AIP Netherlands). ... 13
Figure 1.13: Typical single runway capacity envelope. (Ball et al. 2007, Mirkovic 2015) ... 15
Figure 1.14: TMA representation... 16
Figure 1.15: Schematic representation of the landing routes (STAR ad Instrument approach procedure). ... 17
Figure 1.16: lateral separation based on different geographic location ... 18
Figure 1.17. lateral separation based on different navigation aid ... 18
Figure 3.1: Airspace network modeling (2D): STARs of Paris Charles de Gaulle airport, west configuration ... 34
Figure 3.2: Low detail modeling of the airport ground components. ... 35
Figure 3.3: Schematic representation of the macroscopic approach for integrating airspace and ground operations. ... 35
Figure 3.4: Node conflict detection area ... 40
Figure 3.5: Max Overload and Average overload. ... 41
Figure 3.6: Schematic representation of the sliding window approach ... 45
Figure 3.7: Simulated annealing algorithm ... 47
Figure 3.8: Initial temperature algorithm ... 49
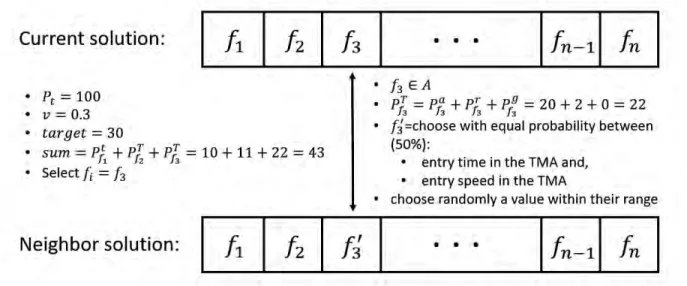
Figure 3.9: Neighbor solution generation example ... 51
Figure 3.10: Main window of a general purpose simulation software (SIMIO) ... 52
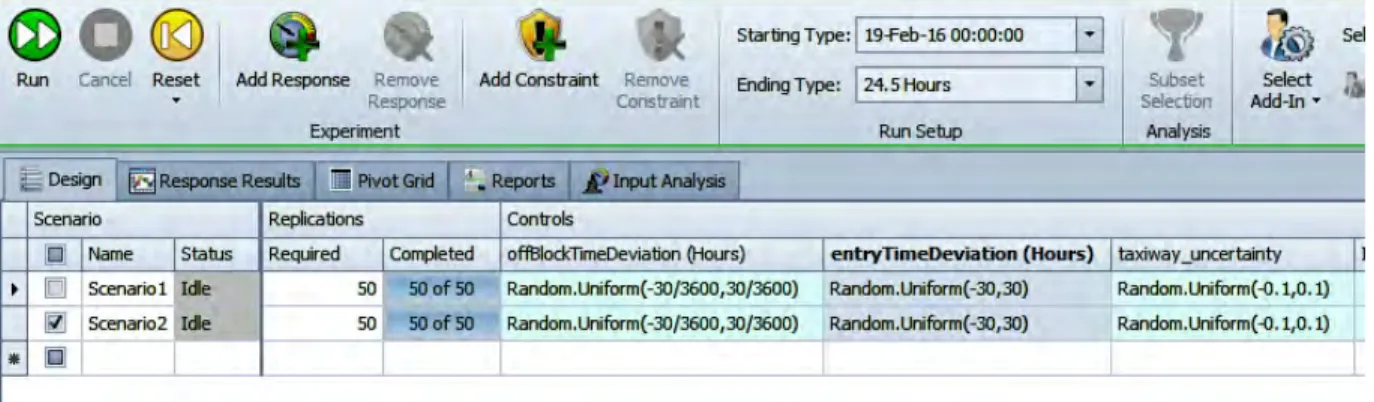
Figure 3.11: Screenshot representing the experiment window of a general-purpose simulation software (SIMIO). ... 53
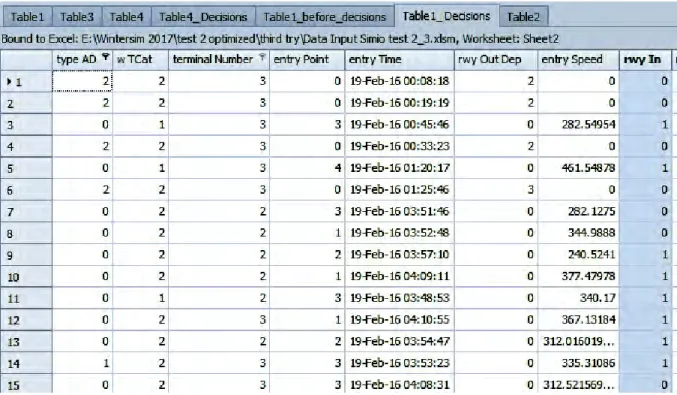
Figure 3.12: Screenshot of the flight schedule with the data input of the model. Each column corresponds to a data input record (SIMIO). ... 56
Figure 3.13: Schema of the opt-sim framework of method 1. ... 57
Figure 3.14: Architecture of the Opt-sim Loop ... 60
Figure 3.15: Comparison between Opt-Sim method 1 and 2 regarding the time horizon considered. ... 60
Figure 4.1: Landing routes at Paris Charles de Gaulle Airport, west configuration. ... 63
Figure 4.3: Average number of aircraft involved in airspace conflicts for scenario 1 (separation minima increase/red line) and scenario 2 (alpha increase/blue line) ... 69
Figure 4.4: Average number of airspace conflicts for scenario 1 (separation minima increase/red line) and scenario 2 (alpha increase/blue line). ... 70
Figure 4.5: Number of airspace conflicts that are in a specific conflict size interval (scenario 1). ... 71
Figure 4.6: Number of airspace conflicts that are in a specific conflict size interval (scenario 2). ... 71
xii
Figure 4.8: “runway in” number of conflicts. ... 72
Figure 4.9: Number of “runway in” conflicts that are in a specific conflict size interval (scenario 1). .. 73
Figure 4.10: Number of “runway in” conflicts that are in a specific conflict size interval (scenario 2). 73 Figure 4.11: Average “runway in” conflict size percentage. ... 74
Figure 4.12: “runway out” number of conflicts. ... 74
Figure 4.13: Number of “runway out” conflicts that are in a specific conflict size interval (scenario 1) ... 75
Figure 4.14: Number of “runway out” conflicts that are in a specific conflict size interval (scenario 2). ... 76
Figure 4.15: Average “runway out” conflict size percentage. ... 76
Figure 4.16: Number of taxiway network conflicts. ... 77
Figure 4.17: Number of terminal conflicts. ... 77
Figure 4.18: Total number of conflicts. ... 78
Figure 4.19: Number of conflicts for each time window for the scenario without schedule optimization ... 79
Figure 4.20: Results from the default scenario; time frame from 5.30AM to 10AM, windows 12 to 17. ... 82
Figure 4.21: Results from the default scenario; time frame from 6PM to 10.30PM, windows 37 to 42. ... 82
Figure 4.22: Results from the alpha scenario; time frame from 5.30AM to 10AM, windows 12 to 17. 84 Figure 4.23: Results from the alpha scenario; time frame from 6PM to 10.30PM, windows 37 to 42. . 84
Figure 4.24: Results from the sep. min. increase scenario; time frame from 5.30AM to 10AM, windows 12 to 17. ... 86
Figure 4.25: Results from the sep. min. increase scenario; time frame from 6PM to 10.30PM, windows 37 to 42. ... 87
Figure 4.26: Results from the O.F. weight scenario; time frame from 5.30AM to 10AM, windows 12 to 17. ... 89
Figure 4.27: Results from the O.F. weight scenario; time frame from 6PM to 10.30PM, windows 37 to 42. ... 89
Figure 4.28: Comparison between the different scenarios and the non-optimized one. (time frame from window 12 to 17) ... 91
Figure 4.29: Comparison between the different scenarios and the non-optimized one. (time frame from window 37 to 42) ... 92
Figure 4.30: Airspace conflicts, O.F. weight scenario. Extended time frame (windows: 36-37-38-39-40-41-42-43) ... 95
Figure A.1: Schema of the simulation model of the Opt-sim Method 1 ... 110
Figure A.2: Airspace model structure (SIMIO) ... 110
Figure A.3: Path object properties (SIMIO) ... 111
Figure A.4: Node object properties (SIMIO) ... 111
Figure A.5: Airport ground side model structure (SIMIO) ... 112
Figure A.6: Server object properties (SIMIO) ... 112
Figure A.7: Source object properties (SIMIO) ... 113
Figure A.8: Sink object properties (SIMIO) ... 113
Figure A.9: Processes in SIMIO ... 114
Figure B.1: Schema of the simulation model of the Opt-sim Method 2 ... 116
Figure B.2: Airport airspace and ground model structure (Anylogic) ... 116
Figure B.3: Airspace visualization (Anylogic) ... 117
Figure B.4: Delay object properties (Anylogic) ... 117
xiii
Figure B.6: Ground side visualization (Anylogic) ... 118
Figure B.7: Service object properties (Anylogic) ... 119
Figure B.8: Source object properties (Anylogic) ... 120
Figure B.9: Sink object properties (Anylogic) ... 120
xiv
List of Tables
Table 1.1. Commercial Airport Classifications (FAA 2016) ... 5
Table 1.2. Airport revenues (de Neufville et al. 2013) ... 7
Table 1.3. Longitudinal separation minima between two consecutive aircraft (ICAO 2016) ... 14
Table 2.1. General-purpose vs specific-purpose simulation software ... 29
Table 3.1. Summary of the main components and data input/instruction given to the flights based on their type. ... 37
Table 3.2. Separation minima ICAO (NM) ... 39
Table 3.3: Separation minima between consecutive aircraft on the runway (seconds) ... 42
Table 3.4. Operations affected by uncertainty and their value... 43
Table 3.5. Summary of the object characteristics of the simulation model ... 54
Table 4.1. Number of movements classified based on the type of movement ... 63
Figure 4.2: Paris Charles de Gaulle Airport airside layout. ... 64
Table 4.2. Airside component capacity ... 64
Table 4.3. Average taxi time (s) ... 64
Table 4.4. Values of the input parameters of the optimization model for the two scenarios. In the first run the input parameters are set as default, while in the three iterations separation minima constraint relaxation gradually increases from 10% to 30%, and the cooling schedule parameter 𝛼𝛼 gradually increases from 0.97 to 0.99. ... 65
Table 4.5. Value of the objective function broken down in all its components. Original schedule. ... 66
Table 4.6. Uncertainty sources and their respective values. ... 67
Table 4.7. Value of the objective function broken down into the different components using the optimized schedule. ... 68
Table 4.8. Values of the fine-tuned parameters of the Opt-sim method 2 ... 81
Table 4.9. Comparison between the default scenario and the non-optimized scenario. Objective function value broken down into its components. Time frame from 5.30AM to 10AM, windows 12 to 17. ... 83
Table 4.10. Comparison between the default scenario and the non-optimized scenario. Objective function value broken down into its components. Time frame from 6PM to 10.30PM, windows 37 to 42. ... 83
Table 4.11. Comparison between the alpha scenario and the non-optimized scenario. Objective function value broken down into its components. Time frame from 5.30AM to 10AM, windows 12 to 17. ... 85
Table 4.12. Comparison between the default scenario and the non-optimized scenario. Objective function value broken down into its components. Time frame from 6PM to 10.30PM, windows 37 to 42 ... 86
Table 4.13. Comparison between the sep. min. increase scenario and the non-optimized scenario. Objective function value broken down into its components. Time frame from 5.30AM to 10AM, windows 12 to 17. ... 88
Table 4.14. Comparison between the sep. min. increase scenario and the non-optimized scenario. Objective function value broken down into its components. Time frame from 6PM to 10.30PM, windows 37 to 42 ... 88
Table 4.15. Comparison between the O.F. weight scenario and the non-optimized scenario. Objective function value broken down into its components. Time frame from 5.30AM to 10AM, windows 12 to 17. ... 90
xv
Table 4.16. Comparison between the O.F. weight scenario and the non-optimized scenario. Objective function value broken down into its components. Time frame from 6PM to 10.30PM, windows 37 to 42 ... 91 Table 4.17. Objective function value broken down into the main components for the most congested windows. Comparison between the different scenarios. (windows 12-13-14-15-16-17). ... 93 Table 4.18. Objective function value broken down into the main components for the most congested windows. Comparison between the different scenarios,. (windows 37-38-39-40-41-42). ... 94 Table 4.19. Comparison between the optimized scenarios and the non-optimized scenario considering the sum of the conflicts for all the windows. ... 95 Table A.1. List of processes implemented in the model ... 115 Table B.1. List of functions implemented in the model ... 122
xvi
Acronyms
ABS Agent Based Simulation ACI Airports Council International ACS Ant Colony System
AMAN Arrival Manager ANOVA Analysis of Variance
ANSP Air Navigation Service Provider ASS Aircraft Sequencing and scheduling ATC Air Traffic Control
ATCO Air Traffic Controllers ATM Air Traffic Management ATS Air Traffic Service
CD&R Conflict Detection and Resolution CPS Constrained Position Shifting
DES Discrete Event Simulation DMAN Departure Manager
ECD&R Extended Conflict Detection and Resolution FAA Federal Aviation Administration
FAF Final Approach Fix FCFS First Come First Served IAF Initial Approach Fix IF Intermediate Fix
IATA International Air Transport Association ICAO International Civil Aviation Organization IFR Instrument Flight Rules
LCC Low Cost Carriers LoS Level of Service
MAP Missed Approach Point
xvii OR Operational Research
RHC Receding Horizon Control RHG Receding Horizon Guidance RPK Revenue Passenger Kilometer SID Standard Instrument Departure Route SMAN Surface Manager
SPSA Simultaneous Perturbation Stochastic Approximation STAR Standard Arrival Route
TMA Terminal Manoeuvering Area VFR Visual Flight Rules
1
Chapter 1
Introduction
1.1. Background and motivation
The air traffic has proven to be resilient and able to recover from many negative events such as economic and political crisis or terrorist attacks, keeping a constant growth through the years. As it is showed in the graph of Figure 1.1(a), looking back from 15 years ago until now, the air traffic has doubled. In the graph of Figure 1.1(a), it can be noticed that since the last financial crisis in 2008, the air traffic, in terms of revenue passenger kilometer (RPK), has grown with a steady rate. In the graph of Figure 1.1(b), it is shown the forecasted traffic for the next 20 years where it can be seen that the air traffic growth will continue with an average yearly growth rate of 4.4%, leading to double the current traffic (Airbus GMF 2017).
(a)
(b)
Figure 1.1: Air traffic trend for the last decades to date (a); Air traffic forecasts for the next 20 years (b) (Airbus GMF 2017)
2
The main aircraft producers Airbus and Boeing, have reported net commercial orders of 1109 and 912 aircraft in 2017, respectively. They had an order increase compare to 2016 of 52% and 37%, respectively (EUROCONTROL 2018a). Figure 1.2 represents the generated aircraft demand for the next 20 years based on the forecasted air traffic, in total there will be 34900 new delivered aircraft, 40% of which will be needed for replacement and 60% for growth (Airbus GMF 2017).
Figure 1.2: Generated aircraft demand (Airbus GMF 2017)
In 2017, Europe air traffic saw a big growth, reaching 10.6 million flights, surpassing the last record of 10.2 million in 2008. Figure 1.3 shows a comparison between 2016 and 2017 in terms of daily flights movements. Comparing with 2016, in 2017 there were 4.3% increase of the average daily flights.
3
Passengers at European airports in 2017, were 8.5% higher in comparison with 2016. Figure 1.4 shows the major airport in Europe in terms of passengers and aircraft movements, with the top five airports having an amount of passengers above 63 million and aircraft movements above 449 thousand, each of them had an increase in both passenger traffic and aircraft movements between 2016 and 2017. As it can be noticed in Figure 1.4, in some airports, although the number of aircraft movements is equal or lower than other airports, the number of passengers is higher. As instance Frankfurt has 78 million passenger traffic, however, it is only fourth in the ranking, which is based on air traffic movements. This is explained by the difference in the number of wide-body aircraft movements at the airport, as these types of aircraft can carry a bigger amount of passengers than narrow-body aircraft. Looking into the air traffic movements of Frankfurt and Amsterdam airports in more detail, it could be discovered that in 2017, Frankfurt airport had a share of 22% of movements provided by wide-body aircraft (Fraport, 2018), while Amsterdam Airport had a share of 15% (Schiphol, 2017).
Figure 1.4: Top five European airports in terms of passenger traffic and aircraft movements (EUROCONTROL 2018b)
On the other hand, this constant growth has put pressure on airport, to which for some of them, capacity limit has already been reached. Environmental constraints, societal, technical and land use restrictions hinder the expansion of airports to accommodate more capacity, and one of the main indicator of congestion is the delay experienced by the flights. In December 2017, the average delay on departure of European flights was reported as 16.9 minutes, 3.3 minutes higher than the value of the same month in 2016. In the same period, 51% of flights were delayed on departures (>=5 minutes), 4% higher than the value reported in December 2016 (EUROCONTROL 2017a, EUROCONTROL 2018b). In general, July and December are the two busiest months over the year that are affected the most by delays, December mainly due to bad weather and July due to the higher traffic because of the summer season.
Airports are always looking for ways to cope with the increasing air traffic, in this context, long-term and short-long-term solutions are potentially able to solve the problem, however often they have the disadvantage of not being feasible in real-world operations. For instance, long-term solutions imply the expansion of the airport infrastructure such as terminals, runways and taxiways, the downside of these solutions is that they require long times of implementation and big investments. In this scenario, the risk involved is high due to the big investment and to the variability of external and internal environments such as financial markets and/or political scenarios. Short-term solutions imply the use of existing facilities in a more efficient way, and these solutions are the most effective given their application within the short time period. Short-term solutions have lower risk than long-Short-term solutions due to the fact that they do not require
4
big investments, and moreover, a short horizon allows to make more reliable prediction of the future state of the internal/external factors affecting the operations. However, in both cases, due to the variability that affects any real-world scenario, the risk of implementing solutions (short- or long-term) which will not be effective is high. To this purpose, when proposing long/short-term solutions, uncertainty becomes a critical factor and needs to be considered. In this context, programs such as Next-Gen (FAA 2018) established by the FAA in the US, Single European Sky ATM Research (SESAR) established by EUROCONTROL in Europe (EUROCONTROL 2018a), and the Collaborative Action for Renovation of Air Transport System (CARATS) established by Japanese Civil Aviation Bureau (JCAB) (MLIT 2010), represent real examples of projects that stimulate the development of new procedures and applications aiming at improving the overall capacity and efficiency of the air transportation, at a given safety level. The FAA, EUROCONTROL, and JCAB, with their projects, play an important role as leading institutions in terms of development and deployment of applications with the objective of harmonizing the air traffic in the safest and most efficient way. Inside and outside the umbrella these programs, many researchers have tackled the problem of optimizing airport operations, including terminal 4aneuvering area (TMA) airspace operations (Beasley et al. 2000, Hu and Chen 2005, Michelin et al 2011, Furini et al. 2015, Sama et al. 2013) and airside operations (Montoya et al. 2010, Kjenstad et al 2013, Lee 2014, Simaiakis and Balakrishnan 2015, Guepet et al. 2017), while another part of research has been conducted for problems related to the optimization of the air traffic flow at large scale (continental and intercontinental routes) (Marzuoli et al. 2014, Allignol et al. 2016, Dhief 2018, Courchelle et al. 2019). Most of these studies have come up with the development of mathematical models providing exact solutions, employing techniques that belong to operational research (OR). In this context, two main knowledge gaps are identified: first, tackling the airport capacity management problem from a holistic point of view, by considering airspace and airside operations together; second, by considering the uncertainty related to the real-world operations. By filling this gap, it will be possible to come up with solutions which will be more resilient to the variability of the real-world operations. In this thesis, a resilient solution is defined as a solution which is less sensitive to perturbations, where perturbations are represented by uncertainty inherent to the operations. This thesis aims at filling these knowledge gaps, specifically, it aims at developing a decision support system to help air traffic controllers (ATCOs) in managing the traffic at major airports. It addresses the problem of making tactical decision for helping ATCOs in managing the traffic both in the TMA and on the ground, where tactical decisions are defined as the ones taken on the day of operations. Tactical decisions include the update of daily plans and the continuous capacity optimization according to the real traffic demand (EUROCONTROL 2017b). The methodology developed in this thesis imply the use of two techniques coming from OR such as optimization using a metaheuristic algorithm and discrete event simulation. Combining these two approaches, the solution of the problem will be addressed by considering also the uncertainty involved. For instance, considering time deviation of scheduled operations such as aircraft sequencing in the airspace or aircraft departures on the ground, would lead to the violation of technical constraints, which in turn would cause conflicts. The aim of this thesis, is to develop such methodology which will be able to minimize the occurrence of these conflicts while including uncertainty in the system.
5 1.2. Airport characteristics and related operations 1.2.1. Airport definition and role
The air transport system, has the main objective of connecting cities, countries, continents and therefore people from different parts of the world. It can be seen as a network of nodes and links, where the nodes are the airports and the links are the routes connecting them. In this context, the airport can be defined as the infrastructure intended to accommodate the flow of aircraft within the air transport network with the purpose of transporting passengers and/or freight. Airports play an important role as logistic means for the transportation of various goods, furthermore, they have also a positive impact in the development of the region or country that they serve. Their presence within the territory has the potential of attracting businesses and increasing the tourism (Khadaroo 2008), therefore, improving the overall regional/national economic performance. Studies show the positive correlation between airport development and employment rate growth (Goetz 1992, Green 2007, Van de Vijver 2015).
1.2.2. Airport classifications
The Federal Aviation Administration (FAA) classifies the airports into several categories based on the activities and the number of passenger boardings each year in: Commercial, Cargo, Reliever and General Aviation. Commercial airports, are defined as “publicly owned airports that have at least 2,500 passenger boardings each calendar year and receive scheduled passenger service” (FAA 2016). They are furthermore classified into: primary airport, with more than 10,000 passengers boardings, and non-primary, between 2,500 and 10,000 passenger boardings each year. In Table 1.1 a more detailed classification of commercial airports is given, classifying primary airports in: Large, medium, small and non-hub.
Table 1.1. Commercial Airport Classifications (FAA 2016) Airport Classifications Hub Type: Percentage of
Annual Passenger Boardings
Common name
Primary Large:
1%* or more
Large Hub Medium:
At least 0.25%*, but less than 1%*
Medium Hub
Small:
At least 0.05%*, but less than 0.005%*
Small Hub
Non-hub:
More than 10,000, but less than 0.05%*
Non-hub Primary
Non-primary Non-hub:
At least2.500 and no more than 10,000
Non-primary Commercial Service
*percentage of the total annual passenger boardings in the United States.
Cargo service airports are the ones that besides any other transportation service, transport more than 100 million of pounds of cargo annually. Reliever airports are airports designated by the FAA to relieve other airport from congestion and to provide improved general aviation. General aviation airports are public-use airport without scheduled service and with less than 2,500
6
annual passenger boardings. In Europe, the Airports Council International (ACI) categorizes airports according to the passenger and freight traffic in four different groups: airports welcoming more than 25 million passengers per year (Group 1), airports welcoming between 10 and 25 million passengers per year (Group 2), airports welcoming between 5 and 10 million passengers per year (Group 3), airports welcoming less than 5 million passengers per year (Group 4) (ACI EUROPE, 2018). A similar classification is made by OAG (OAG 2018), who classifies airports based on the number of departing scheduled seats per year, having: small airports 2.5-5 million seats; medium airports 5-10 million seats; large airports 10-20 million seats; major airports 20-30 million seats; and mega airports 30+ million seats. Airports can be furthermore classified based on the proximity to large catchment areas, in primary and secondary airports (Dziedzic and Warnock-Smith 2016). In the recent years, with the development of low cost carriers (LCC), secondary airports have gain a lot of interest and have expanded their traffic. Secondary airports, due to their characteristics, fit best for the LCC business models, so they are preferred over primary airports. Usually, primary airports are chosen by specific airlines to be their hub, in a “hub and spoke” transport network, while secondary airports are used for a “point-to-point” transport network (Cook and Goodwin 2008). In this thesis, the focus is on big size airports which can be identified as Large Hub, Group 1 and mega airports according to the FAA, ACI and OAG classifications, respectively.
1.2.3. Airport stakeholders
There are many stakeholders acting within the airport system, each of them with its own function and scope. Airports are usually owned by the local/regional/national government, for any of these alternatives, there is an entity that is appointed to manage them and acting as interface between them and the other stakeholders such as airlines, passengers, and so on. This entity is usually known as the airport operator. The main function of the airport operator is to manage the airport resources, maintaining, developing and operating the airport on a daily basis (de Neufville et al. 2013). The airport operator can be established by the government as an ad hoc entity or it can be a private entity which is appointed by the government, usually with the formula of a contract, either ways, the local/regional/national government has always the right to claim its ownership. Generally, the sources of revenues for the airport are divided in: aeronautical and non-aeronautical. The former are related to the services directly provided to aircraft, passengers and cargo, while the latter are related to ancillary commercial services usually available at the airport. Moreover, there is also a third category of revenues which is called non-airport revenues, they are related to all the activities that generate income and are not directly related to aeronautical and non-aeronautical revenues. According to the International Air Transport Association (IATA) (IATA 2017), in 2015, airlines and passengers were estimated to have paid to airport and air navigation infrastructure $118.9 billion, while in 2016 $125.9 billion. In table 1.2 there is a summary of all the charges and fees that constitute that aeronautical and non-aeronautical revenues.
Airlines represent also an important stakeholder within the airport system, due to their route network and business model, they influence the air traffic at the airport and, therefore, they affect the airport capacity. They try to balance the air traffic demand, and in some cases they induce the demand, for example by applying low fares for tickets. As already mentioned before in section 1.2.2, the airlines choose some airports to be their hub, meaning that most of their routes will pass through that airport.
7
Table 1.2. Airport revenues (de Neufville et al. 2013) Revenue source Charge/fee
Aeronautical Landing fees
Terminal area air navigation fees Aircraft parking and hangar charges Airport noise charges
Emission-related charges Passenger service charges Cargo service charges Security charges
Ground handling charges En route aviation fees
Non-aeronautical Concessions fees for aviation fuel and oil Concessions for commercial activities Revenues from car parking and car rentals
Rental of airport land, space in buildings, and assorted equipment Fees for charged airport tours, admissions
Fees from provision of engineering services and utilities Non-airport
revenue
Consulting, educational, and training services
Management contract for operating terminal building or even other airports elsewhere
Real-estate ventures and holdings
Subsidiaries operating duty-free shops, hotels or restaurants Equity investments in into various commercial ventures Acquisition of shares in other airports
An airline, in its hub airport, has a big influence in the management of the space and resources of the airport, in fact it has often a reserved area for aircraft parking positions, and in some cases, they even manage an entire terminal or part of it. Usually, airlines are present in their hub airports also with their own resources such as ground handling facilities and maintenance areas. The hub-base airlines or home carriers, achieve several advantages due to the centralized provision of maintenance facilities, personnel and back-up aircraft at the hub (DLR 2008), other advantages derive from other factors such as route, frequency, fare and frequent flyer programs (Lijesen et al. 2006). Airlines have also influence in the airport slot management, which in most cases, shapes the daily traffic trend at the airport. Another stakeholder within the airport system are companies providing services such as: ground handling, aircraft maintenance and cargo handling. These entities are usually located in the airport airside and work as third party providing services to airlines and passengers. At secondary airports these types of services are provided mostly by these entities, since these airports are not under the influence of a major airline. However, also at hub airports, private service providers, as they were described before, are present with a big share, providing services to the other many airlines present at these airports. The Air Navigation Service Provider (ANSP) is an organization present at the airport with the purpose of managing the air traffic en route or in the TMA and airside of airports. It can be private or public, and their function is to provide the following services (EU 2011):
8 • Air traffic management,
• Communication, navigation and surveillance systems, • Meteorological service for air navigation,
• Search and rescue,
• Aeronautical information services.
Especially for big airports that accommodate a big daily amount of air traffic movements, and for particular airspaces that are at the boundaries between different countries, the work of the ASNP - specifically ATCOs - becomes very demanding and difficult to fulfill (Majumdar and Ochieng 2002, de Oliveira et al. 2006, Hah et al. 2006).
Concessionaires are private entities that occupy and manage a part of the airport terminal and airside, under concession agreements with the airport operator. These concession agreements are represented by contracts of limited time period. For all the duration of the contract the concessionaires will operate their businesses inside the assigned portion of the airport. The most common example of concessionaires regards commercial activities (retailers) inside the airport terminal, and other commercial activities outside the terminal like rental cars, car parking and oil and fuel suppliers. Concessionaires are the ones that contribute to the non-aeronautical revenues to the airport; in the United States car parking and rental cars are the largest generators of non-aeronautical revenues. Last but not least, passengers are the principal stakeholders of the airport system, since they are end users of the airport services. Airports facilities should ensure the passengers a smooth access and connection to their various areas, in fact, each part of the airport terminal and of the airside is designed to provide the best passenger experience (ICAO 2006). To this regard, IATA developed the Level of Service concept, which consists in a set of values able to assess the ability of supply to meet demand by measuring passenger waiting times and level of comfort (available space per passenger) within the different areas of the airport terminal (IATA 2019). Recently airport have become a place not only for travel purposes but also for business and commercial purposes and even for leisure. Airports provide space for congresses and business meetings, but also, they reserve big area for shop retailers. The facilities intended only for the use of passengers such as check-in desks, security control, passport control and gate areas are designed to give the passengers the best comfort, providing enough space and including recreational areas. Regarding the airside, gate areas and taxiway layout are designed to provide the passengers the best quality service in terms of journey comfort and duration. Due to all these aspects, airports terminal and airside design is influenced by the passenger’s experience, which in turn is a crucial factor for the airport success and attractiveness (Potgieter et al. 2014, Chen et al. 2014, Carballo-Cruz and Costa 2014).
1.2.4. Airport sections
The airport infrastructure can be divided into two different sections: landside and airside. The landside includes the portion of the airport within the boundaries of the terminal. The airside or commonly known as ground side, is identified as the portion of the airport outside the terminal, therefore, it includes runways, taxiway network, apron areas, and other areas used for other aviation purposes such as maintenance hangars, freight warehouses, military areas, training areas and so on. In the following sections these areas will be described with more detail.
9 1.2.4.1. Landside
The landside area includes the airport passenger terminal, the main function of the terminal is to receive the passengers and, based on their purpose, convey the flow properly. There are different flows inside a terminal, passengers flow and baggage flow. Passengers flow can be classified, in turn, in arrival, transfer and departing. Baggage flow can be inbound and outbound. Airport terminals can have different layouts, usually they are designed following two different schemes: centralized or decentralized. Centralized terminal layout consists in one terminal that is connected to all the gates, usually it is constituted by several piers where the gates are located. The main advantages coming from this type of layout is, for example the access to the terminal, which favors a unique access by a rail or other forms of public transport. On the other hand, the walking distance measured for reaching one side from another can be long, therefore, in this type of terminals it is important to manage the transfer passengers, so to allocate them not too far from their arrival gate to the transfer gate. In figure 1.7 it can be seen an example of centralized airport terminal layout from Amsterdam Schiphol airport.
Figure 1.7: Centralized airport terminal layout, Amsterdam Schiphol Airport (source:
https://www.ifly.com/amsterdam-schiphol/terminal-map).
Another type of airport terminal layout is the decentralized one. It is usually constituted by several terminals, where in each terminal there are some resource that are replicated such a: check-in desks, security checks, passport controls and so on, therefore, each terminal operates as an independent one. The main advantage coming from this layout is that passengers walking distance is reduced, on the other hand, it might be not ideal for transfer passengers to switch from one terminal to another one, and it does not ensure a unique access by rail or other forms of public transport (Ashford et al., 2013). In Figure 1.8 it can be seen a typical decentralized airport terminal layout as the one in Paris Charles de Gaulle Airport.
10
Figure 1.8: Decentralized airport terminal layout, Paris Charles de Gaulle Airport (source:
https://www.ifly.com/paris-charles-de-gaulle-airport/terminal-map). 1.2.4.2. Airside
The airside area is a secured area where aircraft and ground vehicles have access. In this area, passengers are passive entities since at this stage they are already inside the aircraft, while ground handlers have an active role due to their interaction with the aircraft. At large-sized airports, the airside can cover a vast amount of land and can present a complex layout, which makes difficult for the ground traffic controllers to manage (Mogford et al. 1995, Chua et al. 2015, Taurino et al. 2017).
Gate operations
The apron area is the airside airport area where aircraft are parked for an amount of time that is between the arrival phase and the departing phase. The apron area includes not only the parking stands but also the adjacent area that is used by the aircraft to make their parking maneuvers. The parking maneuvers, both for arriving and departing aircraft are assisted by the support of the ground handlers, who guide the aircraft to make a proper parking maneuver at the right parking stand. The apron area and the relative gate can be designed following a different layout, resulting in contact and remote gates. Contact gates are the ones adjacent to the terminal and usually passengers are transferred from the terminal gate to the aircraft using bridges. At contact gates, ground handlers use towing vehicles in order to push back aircraft and trail them until they reach a part of the apron area where they can turn their engines on. Remote gates are the ones that are located in an area of the airside distant from the terminals; with this configuration passengers will be transferred to the aircraft by means of buses. This solution is often seen in airports with a small terminal where the only contact gates are not enough for the given traffic. At remote gates, usually, ground handling towing operations are not necessary, since the aircraft
11
can start moving by themselves by turning the engines on as soon as they are cleared to leave the gates. In figure 1.9 the two different apron layouts are shown.
Figure 1.9: A schematic representation of contact and remote gate configuration.
When an aircraft is parked at the gate (contact or remote), it undergoes a sequence of operations called turnaround operations. Turnaround operations involved mainly aircraft passengers boarding/deboarding, baggage loading/unloading, water service, refuel service, catering service, and cleaning service among others. These operations are subjects to changes and also can require different times, depending on some factors such as the type of aircraft, the type of flight (short or long haul) and the airline business model (full service or low cost). For instance, low cost carriers for short haul flights aim at achieving maximum 30 minutes of turnaround time, while full service carrier in intercontinental routes can have a turnaround time up to 3 hours. The turnaround time is an indicator of efficiency of the terminal gate capacity, and airlines find very important to keep it as low as possible in order to minimize the costs and be competitive within the market. Each turnaround operation implies the use of specific vehicles, therefore the management of these resources impacts the gate capacity. In the literature we can find several studies about this topic proving its relevance in the field (Wu and Caves 2004, Adeleye and Chung 2006, Fricke and Schultz 2009, Norin et al. 2012, Makhloof et al. 2014, Airbus 2019, Boeing 2019).
Taxiway operations
The taxiway network has the objective of linking the gate apron area with the runways. Aircraft that cross the taxiway network are usually guided by the ground controller from the gate to the assigned runway and vice versa. While crossing the taxiways, aircraft must respect some speed limit and minimum distance between consecutive aircraft due to safety reasons (ICAO 2018). Currently there are not regulations about these speed and distance limits, so they are ensured by
12
the ground controllers and pilots decisions based on direct visualization (Gotteland et al. 2009, Lee 2014). (Ground controllers give instructions to aircraft by addressing them to the taxiway routes, which are identified as the ones most utilized. Especially for complex taxiway network, taxiway junctions are identified as hot-spots, which are areas where traffic gets congested with high likelihood. It is important to consider these hot-spot when managing the traffic on the ground since they can form potential bottleneck in the system. Taxiway operations are fulfilled by the cooperation between aircraft pilots and ground controllers, where the latter give instructions to the pilots about which route to follow. At airports where the gate area is close to the runway, there are few taxiway routes connecting a specific gate with a specific runway, therefore, resulting in short taxiway times. On the other hand, at major airports, given a specific gate and a specific runway to connect, there can be several alternative taxiway routes which increase the complexity in managing the traffic by the ground controllers; due to these reasons, the likelihood of having long taxiway times is high. In order to mitigate this effect, the topic of ground management, especially concerning taxiway routings, has been extensively studied by researchers as an individual problem and also within the context of the airport departure problem. The main objectives pursued within this specific type of problem are: achieving a smooth flow of aircraft on the ground, reducing taxiway times, minimizing delays for departures and maximizing the departure throughput (Montoya et al. 2010, Kjenstad et al 2013, Lee 2014, Simaiakis and Balakrishnan 2015, Guepet et al. 2017).
Runway operations
The runway system represents the main feature of the airport airside, since its function is to accommodate landings and departures, that together define the maximum capacity of the airport in terms of air traffic movements. The runway system is considered as the main bottleneck of the airport (Idris et al. 1999, Lieder et al. 2014, Simaiakis and Balakrishnan 2015), therefore, when designing an airport, the number of runways and their layout, it assumes a crucial aspect to consider. Regarding the layout of the runway system, we can have parallel runways, crossing runways and both. Building parallel runways represents an effective way of increasing the capacity of airports, since they can be used independently for different operations (landings and takeoffs). Parallel runways layout, as already adopted by several airports (e.g. Paris Charles de Gaulle, Los Angeles International, Delhi Indira Gandhi), represents the next stage of capacity evolution (de Neufville et al., 2013). The number of runways is based on several criteria, the main ones can be summarized as follows: forecasted air traffic demand, land availability and noise constraints. Within the runway system, a factor which is important besides the number of runways, is the number of active runways. Due to the layout of the runways, not all the runways can be used at the same time, so the layout of the runway system plays an important role for the computation of its capacity. For example, crossing runways cannot be used for independent operations at the same time, as well as close spaced parallel runways. In figure 1.10, 1.11 and 1.12 are depicted three different runway system layouts.
Figure 1.10, depicts a parallel runway system; in this specific example there are two northern and two southern parallel runways. Each of the two parallel runways are spaced between 2.500 and 4.300 miles, which is enough for them to work as independent runways only for the simultaneous departures and simultaneous departures/landings. In order to be able to operate simultaneous landings they need to be spaced by more than 4.300 miles.
13 Figure 1.10: Airport airside layout: parallel
runways (source: AIP France). Figure 1.11: Airport airside layout: crossing runways (source: PD-USGov-FAA).
Figure 1.12: Airport airside layout: hybrid configuration (source: AIP Netherlands).
On the other hand, if they were spaced by less than 2.500 miles (close spaces runways), they could not operate any movement simultaneously. Figure 1.11 shows two crossing runways; in this case only one movement at a time is allowed, while Figure 1.12 shows a hybrid layout composed by both independent parallel runways and crossing runways. In the latter case, it is worth noting that although there are 6 runways, only 3 runways can be used simultaneously (active runways). The operations carried out on the runway are named as landings and take offs. The landing phase starts when the aircraft is in its final approaching phase, continues when it touches down, and ends when it exits the runway. The take off phase starts when the aircraft enters the runway, crosses it, starts to climb, and ends when it reaches a visual flight rules (VFR) pattern or when reaching 1000ft, whichever comes first. Since the runway system is considered as the bottleneck of the airport system (Idris 1999, Lieder et al. 2015, Simaiakis and Balakrishnan 2015), it is important to define and evaluate its capacity together with the factors that influence it. A common definition of runway capacity is the hourly runway capacity, which is the number of movements (landings and takeoffs) that are performed in one hour. The capacity
14
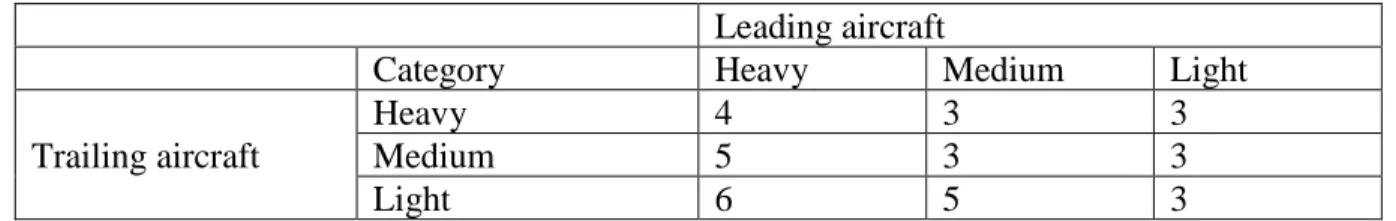
of a runway changes based on the type of movement that it accommodates, such as runway only for landings, only for departures or for both. As stated by regulation, on the runway it is allowed only one movement at a time, and moreover, two consecutive movements need to be separated by minimum separation due to safety reasons (ICAO 2016). In Table 1.3, these separation minima are presented, they depend on which category the leading and trailing aircraft belong. Aircraft are categorized by ICAO with the so called wake turbulence category, based on their maximum take off mass (MTOM) (ICAO 2019). The wake turbulence category are defined as follows:
• Heavy, aircraft types of 136000 Kg or more,
• Medium, aircraft types less than 136000 Kg and more than 7000 Kg, • Light, aircraft types of 7000 Kg or less.
Table 1.3. Longitudinal separation minima between two consecutive aircraft (ICAO 2016) Leading aircraft
Category Heavy Medium Light Trailing aircraft
Heavy 4 3 3
Medium 5 3 3
Light 6 5 3
Runways can accommodate two types of movements: Arrival (A) and Departure (D), depending on the sequence of movements performed on the runways (arrival followed by arrival, A-A; arrival followed by departure, A-D; departure followed by departure, D-D; departure followed by arrival, D-A), different separation minima are applied, and they can be derived by the equations (1), (2), (3) and (4) (de Neufville et al. 2013).
In the specific, for the A-A case:
𝑠𝑠𝑖𝑖𝑖𝑖 = 𝑑𝑑𝑖𝑖𝑖𝑖 (1)
For the A-D case:
𝑠𝑠𝑖𝑖𝑖𝑖 = 𝑙𝑙𝑖𝑖𝑟𝑟 (2)
For the D-D case:
𝑠𝑠𝑖𝑖𝑖𝑖 = ⎩ ⎪ ⎪ ⎨ ⎪ ⎪ ⎧𝑚𝑚𝑚𝑚𝑚𝑚 �120,𝑑𝑑𝑣𝑣𝑖𝑖𝑖𝑖 𝑖𝑖� , 𝑚𝑚 = 𝐻𝐻𝐻𝐻𝐻𝐻𝑣𝑣𝐻𝐻, 𝑚𝑚𝐻𝐻𝑚𝑚 �𝑙𝑙𝑖𝑖𝑟𝑟,1 𝑣𝑣𝑖𝑖� , 𝑚𝑚 = 𝑀𝑀𝐻𝐻𝑑𝑑𝑚𝑚𝑀𝑀𝑚𝑚, 𝑚𝑚𝐻𝐻𝑚𝑚 �𝑙𝑙𝑖𝑖𝑟𝑟,0.75𝑣𝑣 𝑖𝑖 � , 𝑚𝑚 = 𝐿𝐿𝑚𝑚𝐿𝐿ℎ𝑡𝑡, (3)
For the D-A case:
𝑠𝑠𝑖𝑖𝑖𝑖 = 𝑚𝑚𝐻𝐻𝑚𝑚 �𝑙𝑙𝑖𝑖𝑟𝑟,𝑣𝑣2
15
Where 𝑠𝑠𝑖𝑖𝑖𝑖 is the required separation minima between two consecutive aircraft i and j. In the A-A case (1), 𝑠𝑠𝑖𝑖𝑖𝑖 is equal to the ICAO standard minimum separation distance based on the aircraft type at the runway threshold between two consecutive aircraft i and j, 𝑑𝑑𝑖𝑖𝑖𝑖. In the A-D case (2), 𝑠𝑠𝑖𝑖𝑖𝑖 is equal to the runway occupancy time of the aircraft i at the runway r, 𝑙𝑙𝑖𝑖𝑟𝑟. In the D-D case
(3), 𝑠𝑠𝑖𝑖𝑖𝑖 is calculated according to the following rules: if the leading aircraft i is of type Heavy, the minimum separation must be at least 120 seconds or the time separation calculated according to the standard separation minima 𝑑𝑑𝑖𝑖𝑖𝑖 and the speed of the leading aircraft i at the runway threshold, 𝑣𝑣𝑖𝑖; if the leading aircraft i is of type Medium, the minimum required separation must be at most equal to the runway occupancy time of aircraft i, 𝑙𝑙𝑖𝑖𝑟𝑟, or calculated as time distance by assuming 1 nautical mile as the required distance and 𝑣𝑣𝑖𝑖𝑖𝑖, as the speed of the leading aircraft i at the runway threshold; if the leading aircraft i is of type Light, the minimum required separation must be at most equal to the runway occupancy time of aircraft i, 𝑙𝑙𝑖𝑖𝑟𝑟, or calculated as time distance by assuming 0.75 nautical miles as the required distance and 𝑣𝑣𝑖𝑖𝑖𝑖, as the speed of the leading aircraft i at the runway threshold. In the D-A case (4), 𝑠𝑠𝑖𝑖𝑖𝑖 is calculated as the maximum value between the runway occupancy time for aircraft i at the runway r, 𝑙𝑙𝑖𝑖𝑟𝑟, and the time distance by assuming 2 nautical miles as the required distance and 𝑣𝑣𝑖𝑖𝑖𝑖, as the speed of the leading aircraft i at the runway threshold. In Figure 1.13 it is showed a typical capacity envelope for a single runway.
Figure 1.13: Typical single runway capacity envelope. (Ball et al. 2007, Mirkovic 2015)
Figure 1.13 denotes four vertexes that represent a different configuration of arrivals departures. In point 1 arrivals are maximized while departures are zero, in point 4 it can be seen the opposite phenomenon. Point 2 shows that even if there are some departures, the arrivals are still at a maximum value, meaning that, this point represents the maximum number of departures that can be processes without lowering the number of arrivals. From point 2 to point 3 as soon as the number of departures increases, the number of arrivals decreases until reaching point 3 where there are the same number of departures and arrivals. From point 3 to point 4, the same phenomenon continues until point 4 where the maximum number of departures is reached while having zero arrivals. At some airports, given the configuration of the runways and taxiway network, aircraft might need to cross the runway and use it as a taxiway; these types of movements are commonly named as “runway crossings”. Runway crossings have also an impact
16
on the runway capacity since the runway can be occupied by only one aircraft at a time. However, runway crossings influence the runway capacity to a less extent since the runway occupancy time for crossings operations is lower than normal runway occupancy time for arrivals/departures operations.
1.3. TMA airspace
The Terminal Maneuvering Area is a control area normally established at the confluence of ATS (Air Traffic Service) routes in the vicinity of one or more major aerodromes (ICAO 2005). Especially for busy airports, it can be a congested area due to the traffic converging to the runways and also due to the outbound traffic. In this context, the ANSP has the role of managing the traffic, having as main objective to ensure safety, and besides that, their aim is to make an efficient flow with the purpose of minimizing delays and increasing the airspace capacity. The TMA can be seen as an upside-down wedding cake shape portion of airspace surrounding the airport, its extension varies according to the specific airport. Figure 1.14 helps to better understand the TMA airspace.
Figure 1.14: TMA representation.
When the aircraft fly under Instrument Flight Rules (IFR), their flight paths are facilitated by the implementation of Standard Arrival Routes (STARs) and Standard Instrument Departure Routes (SIDs). STARs and SIDs are standard routes that expedite the safe and efficient flows of air traffic operating to and from the same or different runways. STARs and SIDs are published routes that can be followed by the flight crew unless the air traffic controllers give different instructions. Each runway can have one or more STAR/SID, each of them ensures aircraft to fly at a certain altitude level, under speed restrictions and following some significant points (waypoints). The last descending path before landing, under IFR, is called instrument approach procedure. This procedure includes a series of predefined maneuvers that leads to landing at a predefined runway. The instrument approach procedure can be divided into two main segments, named initial approach segment and final approach segment. In some cases, another additional