Registration Code: S-I1464731009
Displacement Capacity of Shear-Dominated Reinforced Concrete Walls
N. Tatar (1), B. Mihaylov(2)
(1) PhD researcher, University of Liège - Belgium, ntatar@ulg.ac.be
(2) Assistant Professor, University of Liège - Belgium, boyan.mihaylov@ulg.ac.be
Abstract
In this paper the load-displacement response and displacement capacity of shear-dominated reinforced concrete walls is studied with the help of a three-parameter kinematic theory (3PKT). The 3PKT is a rational and efficient approach based on a three-degree-of-freedom kinematic description of the deformation patterns in cantilever walls with aspect ratios ≤3.0. In addition to kinematics, the 3PKT also includes equations for equilibrium and constitutive relationships for the load-bearing mechanisms in walls. The paper summarizes this approach and applies it to nine wall tests from the literature featuring a wide range of test variables. It is shown that the model captures adequately the response of both moderately short walls (aspect ratios 2.2-3.0) and squat walls (ratios 0.33-0.54). With the help of the load-bearing mechanisms predicted by the 3PKT, it is shown that shear failures in squat walls develop due to the complex interaction between concrete crushing in the toes of the walls and aggregate interlocking along flat critical cracks. A modification to the 3PKT is proposed to capture the effect of loading conditions on squat shear walls. With this modification, it is shown that the 3PKT can also capture the effect of concrete stiffness, concrete compressive strength, and reinforcement ratios on the shear response of squat members. For all tests considered in this study, the 3PKT produced an average shear strength experimental-to-predicted ratio of 1.05 and a coefficient of variation COV=10.5%. Similarly accurate predictions were obtained for the displacement capacity of the walls: an average of 0.90 and COV=15.69%.
Keywords: reinforced concrete walls, shear, displacement capacity, kinematic model, squat walls, nonlinear response
1. Introduction
Modern displacement-based procedures for the seismic assessment of existing structures with reinforced concrete walls require the evaluation of the displacement (or drift) capacity of the walls. The displacement capacity of flexure-controlled walls in buildings and wall-type piers in bridges is typically evaluated based on the plastic hinge approach [1]-[4]. This approach however is not well suited for shear-dominated walls with low aspect ratios. Predicting the behaviour of such members is still a challenging problem, particularly in the case of shear failures occurring after the yielding of the flexural reinforcement. This study focuses on the assessment of the load-displacement behaviour and load-displacement capacity of shear-dominated cantilever walls with aspect ratios smaller than 3.
A new framework for such assessment called a three-parameter kinematic theory (3PKT) has been recently proposed by Mihaylov, Hannewald, and Beyer [5]. This approach is based on a three-degree-of-freedom kinematic description of the deformation patterns of diagonally-cracked walls with rectangular sections. In addition to kinematics, the 3PKT also includes equilibrium equations and constitutive relationships for the load-bearing mechanisms in walls. The 3PKT is capable of predicting shear failures along diagonal cracks, as well as failures at the base of the wall under the combined action of flexure and shear. With its small number of degrees of freedom (DOFs) and realistic physical assumptions, the 3PKT is aimed at combining simplicity and accuracy for predicting the response of shear-dominated walls.
This paper summarizes the main assumptions of the 3PKT and validates this approach with tests from the literature. The 3PKT is used to interpret the behaviour of the test specimens and to study the effect of different test variables on the response of shear-dominated walls.
2. Summary of three-parameter kinematic theory for shear-dominated walls
2.1 Kinematics of shear-dominated walls
The three-parameter kinematic theory is built on a kinematic model that describes the deformation patterns (displacement field) of fully-cracked rectangular cantilever walls. The model has been formulated based on measured deformed shapes of test specimens that failed in shear under the combined action of lateral and vertical loads. As shown in Fig. 1 a-c, the model consists of three basic deformation patterns, each of which a function of a single degree of freedom (DOF). These deformation patterns are marked by a straight critical shear crack inclined at angle α1 with respect to the vertical axis x. Angle α1 is obtained from a shear-strength calculation according to the AASHTO code [6], but cannot be bigger than the angle of the diagonal of the wall α. This upper limit on α1 is based on the observation that short walls typically fail in shear along diagonal cracks. The critical crack divides the kinematic model into two distinct regions: a rigid block above the crack and a fan of rigid struts below the crack (Fig. 1a). The struts from the fan are pinned at the toe of the wall (point A) and are connected to a vertical tie on the flexural tension side of the section. This tie represents the longitudinal reinforcement in the tension one-half of the section.
As evident from Fig. 1a, the first basic deformation pattern is associated with the average strain εt,avg along the tension reinforcement (tie). Namely εt,avg is the first degree of freedom of the kinematic model. As the tie elongates and εt,avg increases, the fan of struts spreads and the rigid block rotates about the toe of the wall. The rotation of the block results in the widening of the critical crack. This deformation patterns can be associated with flexure.
The second deformation pattern is characterized by a lateral displacement ∆c of the rigid block with respect to the fan, Fig. 1b. This displacement is accommodated along the critical diagonal crack resulting in crack widening and slip. At the bottom of the wall DOF ∆c results in deformations in what will be referred to as the critical loading zone (CLZ). Experimental observations show that the shear failure of short walls typically develops with crushing of the concrete in this zone. At the top of the critical crack ∆c occurs within a transition zone of length lk where the longitudinal reinforcement is subjected to double curvature. This deformation pattern can be associated with shear.
Finally, the third DOF of the kinematic is the downward displacement ∆cx of the flexural compression edge of the wall (Fig. 1c). This displacement is accommodated in the CLZ of the wall and causes a rotation of the rigid block about point B at the bottom of the tie. This rotation can result in a contact between the rigid block and the fan at the bottom of the critical crack if DOF ∆c is not sufficiently large. As evident from Fig. 1c, DOF ∆cx is associated with the action of the vertical load N which drives the rigid block downwards.
When the three deformation patterns are superimposed, they produce the complete deformation pattern of the wall (Fig. 1d). More precisely, the horizontal and vertical displacements of each point from the wall are expressed as the sum of the displacements from the three basic deformation patterns. Based on small-displacement kinematics, the resulting expressions for the displacement field of the wall are:
- Below the critical crack
δ x, z ε, x (1)
δ x, z , (2)
- Above the critical crack
δ x, z , ! x Δ
# (4)
where h is the depth of the cross section of the wall, d is the effective depth of the section, lt is the cracked length along the longitudinal reinforcement, and x-z is the coordinate system is shown in Fig. 1 (see also list of notations). These simple expressions show that any important deformation in the wall – such as for example the strain in the shear reinforcement – can be expressed with the three unknown DOFs of the kinematic model. Furthermore, the kinematic model is used to express the width and slip displacements in the critical diagonal crack, again as a function of εt,avg, ∆c, and ∆cx. Therefore, Eqs. (1)-(4) represent conditions for compatibility of deformations which are used to simplify the complex behaviour of shear-dominated walls. A more detailed discussion on the derivation of these equations can be found elsewhere [5].
Fig. 1 – Kinematic model for shear-dominated walls [5]
2.2 Load-bearing mechanisms
To determine DOFs εt,avg, ∆c, and ∆cx under a vertical load and lateral displacement at the top of the wall, it is necessary to combine the compatibility equations with constitutive relationships for the load-bearing mechanisms in the wall. In the 3PKT the load-bearing mechanisms are modelled with non-linear springs “attached” to the kinematic model, see Fig. 2. Some of the mechanisms (springs) act across the critical diagonal crack, while the rest represent the interaction between the rigid block and the foundation (Fig. 2a). The mechanisms across the critical diagonal crack include the aggregate interlock shear Fci, tension in the shear reinforcement Fs, contact forces Fcn and Fct between the rigid block and the fan in the vicinity of the CLZ, dowel action Fd of the longitudinal reinforcement (tie) at the top of the critical crack, and tension in the longitudinal reinforcement Ft,min in the same zone. The interaction between the rigid block and foundation includes the forces resulting from the compression in the critical loading zone FCLZ1 and FCLZ2, as well as the vertical force Fsc in the compression reinforcement.
For a given set of DOFs εt,avg, ∆c, and ∆cx, kinematic conditions (Eqs. (1)-(4)) are used to determine the deformations in the springs, and these deformations are in turn used to determine the forces in the springs. For example, the governing deformations for the aggregate interlock spring Fci are the crack width and crack slip halfway along the critical crack. The shear stress on the crack is calculated as a function of these deformations by using a contact density model prosed by Li et al. [7]. According to this model, the wider is the crack and the smaller
∆c N δx= =0δz δx=0 δz= ∆c x z V
a) DOFεt,avg b) DOF∆c
c) DOF∆cx δx= =0δz x z ∆cx ∆ c < CLZ εt,avg x z ∆ εv w εt εt,min εt,max a + εt,a v g lt V N N V a a εt,avglt d ∆cx d εy A B CLZ l N V d) C lt = B C ( ) α1 d h εt,m in CLZ lk x z B rigid block
is the slip displacement between the crack faces, the smaller is the shear stress. This stress is integrated along the crack to compute the force Fci in the aggregate interlock spring.
The behaviour of the fan below the critical crack is also modelled in the 3PKT. As can be seen from Fig. 2b, the stress in the tension tie varies from ft,min within the transition zone lk to ft,max at the base of the wall. The stress variation outside length lk is assumed parabolic [8]. Based on this variation and a bi-linear stress-strain relationship for the steel, plastic deformations (yielding) in the reinforcement at the base of the wall spread over a certain length above the base (see strains εt in Fig. 2b). The base section of the fan is modelled on the bases of the classical plane sections hypothesis. However, due to the high shear transferred through the compression zone of the base section, the stresses in this zone are inclined at angle θb that depends on the magnitude of the forces on the fan. The complete formulation of the fan and springs is discussed elsewhere [5].
2.3 Overview of solution procedure and failure modes
By using the compatibility conditions and constitutive relationships for the load-bearing mechanisms in the wall, the forces in the springs and fan can be computed for a given set of DOFs εt,avg, ∆c, and ∆cx. If the lateral displacement ∆ at the top of the wall is imposed, the number of DOFs is reduced to only two. These two DOFs are determined by ensuring the vertical and moment equilibrium of the forces acting on the rigid block (Fig. 2a). These forces include the external vertical load N and the spring forces Fi. In addition, the horizontal equilibrium of the block is used to calculate the lateral load on the wall V under the imposed displacement ∆. Due to the non-linear behaviour of the springs of the 3PKT, the equilibrium conditions are solved through an iterative procedure based on the secant stiffness approach. Despite the iterative procedure, the complete load-displacement analysis (V-∆ response) of a wall takes only a few seconds due to the small number of DOFs used in 3PKT formulation.
Fig. 2 – Load-bearing mechanisms in shear-dominated walls [5]
As can be seen from Fig. 2, there are two potential failure planes defined in the 3PKT: the critical diagonal crack and the base section of the wall. The wall can fail in shear along the critical crack either prior to or after the yielding of the flexural reinforcement (tie). Failure in the base section can either occur by rupture of the tie or by crushing of the concrete in the compression zone under the combined action of bending and shear.
fb εb h 2 V, N ∆ α1 α/2 Fd Ft,min Fci Fs FCL Z2 Fsc Fct F cn F CLZ1 α1 α d 0 .5 d c o t α1 Ft,max Ft ∆ εt,avg lk ft εt εt,min εt,max ft ∆ lt jd εb,max ci0 ∆ s0 ∆ d0 ∆ fb εb,max s ∆ ci ∆ t ∆ d ∆ sc ∆ CLZ1 ∆ CL Z2 ∆ cn ∆ ct ∆ a εt,max 1 ft,min f t,max εy x z Fb l Fd Fci Fs Ft,min t0 ∆ (a) (b)
Finally, as the 3PKT is developed for shear-dominated walls, it is necessary to define a limit between such members and walls controlled by flexure. A wall is considered shear-dominated if it has an aspect ratio a/h≤3.0, and if the 3PKT predicts that the shear reinforcement (spring Fs) yields before the flexural reinforcement (tie).
3. Comparisons with tests
3.1 Walls with aspect ratios a/h=2-3
The three-parameter kinematic theory was initially validated by using tests performed by Bimschas [9][10]. This experimental study included testing to failure of three large-scale cantilever walls with an aspect ratio a/h=2.2 (a=3.3 m and h=1.5 m). The specimens were designed to represent bridge piers with relatively low amount of transverse reinforcement (reinforcement ratio ρv=0.08%). The longitudinal reinforcement was uniformly distributed across the section with a ratio ρl=0.82% or 1.23%. The focus of the experimental campaign was to investigate the potential for premature shear failures and loss of axial load capacity of wall-type piers under seismic loading. The test specimens were therefore subjected to a constant axial load (n=N/bhfc’≈0.07) and cyclic lateral displacements with increasing amplitude. The experimental campaign by Bimschas was extended by Hannewlad et al. [11] to include more slender walls (a/h=3.0) and walls with larger shear reinforcement ratio (ρv=0.22%). The main properties of four walls from the two studies are summarized in Table 1 – see VK series. These walls were shear critical while the rest of the walls from the study failed due to flexure and insufficient lap splices.
Table 1 – Properties of test specimens Wall ID b [mm] h
[mm] d
[mm] a/h ρ [%] ρ [%] f& [MPa] f& [MPa] f#′ [MPa] N bhf#* V, [kN] VK1 350 1500 1190 2.2 0.82 0.08 515 518 35 0.071 737 VK3 350 1500 1160 2.2 1.23 0.08 515 518 34 0.073 887 VK6 350 1500 1160 3.0 1.23 0.08 521 528 44.4 0.056 675 VK7 350 1500 1160 2.2 1.23 0.22 521 528 30 0.082 903 Wall 2 100 2000 1585 0.33 0.8 0.3 435 425 22 0 680 SW5 203 3050 2287 0.33 1 1 462 462 29.7 0 3190 SW6 203 3050 2287 0.33 0.67 0.67 462 462 26.2 0 2460 SW9 203 3050 2287 0.54 1.5 0.67 462 462 29.7 0 2880 SW10 203 3050 2287 0.54 1.5 0.33 462 462 31.7 0 2380
The complete hysteretic load-displacement response of wall VK1 is shown in Fig. 3a, while the envelopes of the responses of the four walls are plotted in Fig. 3b. The lateral displacements are expressed in terms of drift δ=∆/a [%]. It can be seen that all specimens exhibited a plateau caused by the yielding of the longitudinal reinforcement at the base of the wall. However, while the walls showed certain ductility, their displacement (or drift) capacity was limited by sudden shear failures along critical diagonal cracks. This type of failure is governed by a complex interaction between shear, flexure, and axial load. At the same time, the accurate prediction of such failures is very important for the evaluation and retrofit of existing structures with limited ductility.
As evident from Fig. 3, the 3PKT method captured well the entire behaviour of the walls, including the yield plateau and the sudden drop of lateral resistance. According to the model, the CLZs of the walls began to crush soon after the yielding of the flexural reinforcement. As the shear resistance of these zones was degrading, a larger portion of the shear was resisted by the aggregate interlock mechanism across the critical crack. At the same time, this mechanism was weakened by the widening of the crack under increasing lateral displacement ∆. Eventually the aggregate interlock is predicted to break down and trigger the failure of the wall. The last point along the prediction V-∆ curves corresponds to the stage at which the resistance along the critical crack is not sufficient to balance the vertical load N, and the wall is predicted to lose its axial load capacity. This results in sudden downwards sliding of the rigid block that was observed in the tests.
a) Hysteretic response of specimen VK1 b) Envelope of responses of VK series
Fig. 3 – Measured and predicted response of test specimens VK1, VK3, VK6 and VK7 (tests by [9][10][11])
3.2 Squat walls with a/h≤1.0
While the 3PKT was formulated mainly on the basis of experimental data from moderately short walls, it is also of interest to apply this method to squat shear walls that work predominantly in shear. Such a wall with an aspect ratio a/h=0.33 was tested by Wirandinata [12], see Fig. 4a. The specimen, named Wall 2, had a 2000 mm-deep section that featured end zones with concentrated longitudinal reinforcement and confining hoops. The ratio of the total longitudinal reinforcement was ρl=0.8% while the shear reinforcement ratio was ρv=0.26%. Cyclic lateral displacements with increasing amplitude were applied at the top of the wall via a stiff concrete block. Apart from the weight of the concrete block, no vertical load was applied on the wall. All main properties of Wall 2 are summarized in Table 1.
a) Test setup and crack patterns b) Measured and predicted response
Fig. 4 – Test Wall 2 [12]
The envelopes of the measured load-displacement response of Wall 2 in both loading directions are shown in Fig. 4b. It can be seen that this specimen did not exhibit a yield plateau, and therefore its longitudinal reinforcement remained mostly elastic. It was reported that only the extreme rows of reinforcement began to yield near peak load, and this was followed by sliding of the wall along a horizontal crack at the base. This crack developed along the construction joint between the foundation block and the wall. The sliding back and forth under the reversed cyclic load resulted in significant pinching of the hysteretic load-displacement response.
V [ kN ] V [ kN ]
Figure 4b shows that the load-displacement response predicted by the 3PKT method follows closely the experimental curves. The figure also shows the predicted components of shear resistance and how they vary with increasing lateral displacement. These shear forces correspond to the horizontal components of the forces in the springs attached to the rigid block (Fig. 2b). More precisely, shear Vci corresponds to force Fci, shear Vs to Fs, Vd to Fd, VCLZ to FCLZ1 and FCLZ2, and Vcf corresponds to Fcn and Fct. It can be seen that the two dominant shear mechanisms are the compression in the CLZ and the aggregate interlock across the critical diagonal crack. The CLZ is predicted to crush at a small displacement, and then the shear is redistributed towards the softer aggregate interlock mechanism. The peak shear resistance of the wall occurs when VCLZ is declining and Vci is increasing. Due to the very flat slope of the critical crack (see Fig. 4a), the horizontal web reinforcement is predicted to be ineffective in resisting shear. The dowel action is also predicted to have a negligible effect on the response.
The adequate predictions of the 3PKT method for Wall 2 can be somewhat surprising considering that the kinematic model does no account for sliding deformations at the base. However, due to the very flat slope of the critical diagonal crack, the behaviour along this crack is very similar to that along the base crack. According to the 3PKT, the sliding along the critical crack is triggered by the crushing of the critical loading zone. This is in good agreement with the test observation that after the wall reached its peak resistance, the crushing of the compression zones was followed by significant sliding deformations in the base crack [12].
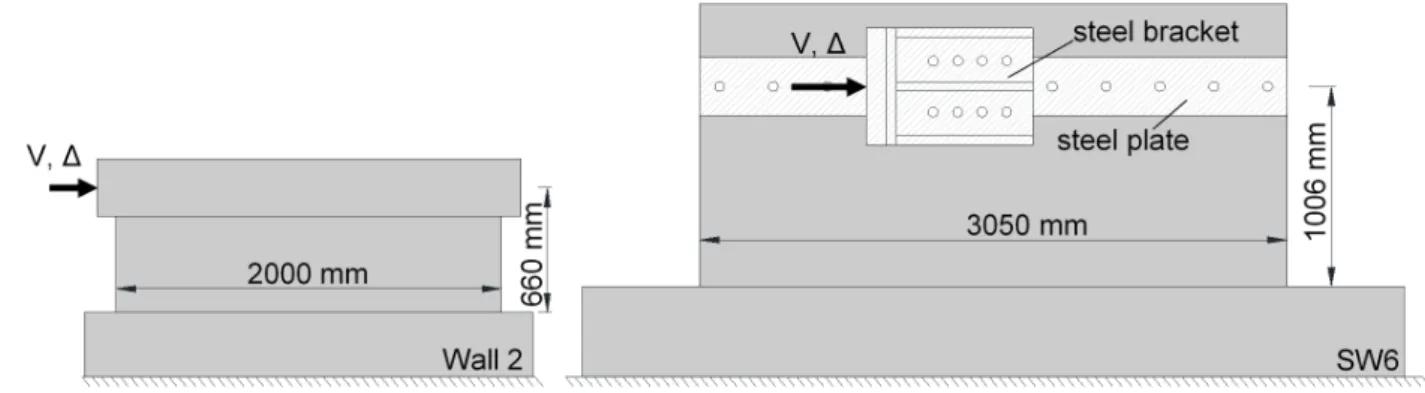
Another more recent experimental program on squat walls was performed by Luna et. al. [13]. This campaign involved testing to failure of large-scale reinforced concrete walls with aspect ratios varying between 0.33 and 0.94. The walls were subjected to cyclic lateral displacements without vertical load. The wall considered first here is test specimen SW6 which was similar to Wall 2 – see Fig. 5. Compared to Wall 2, this specimens had the same aspect ratio of 0.33, it was about 50% larger (h=3050 mm) and featured different loading conditions. While Wall 2 was loaded by a rigid concrete block, specimen SW6 was loaded through steel brackets and plates which were post-tensioned to either side of the wall. In terms of reinforcement, SW6 had slightly smaller longitudinal ratio than Wall 2 (0.67% vs. 0.80%) and significantly larger transverse ratio (0.67% vs. 0.26%). It should also be noted that the longitudinal reinforcement of SW6 was uniformly distributed across the depth of the section. All remaining properties of the two walls can be compared in Table 1.
Fig. 5 – Tests Wall 2 and SW6 – geometry and load application apparatuses
The reported failure mode of wall SW6 was diagonal compression. The authors of the test stated that a significant drop in shear strength was due to crushing of concrete at the toes of the wall. Similarly to Wall 2, it was observed that wall SW6 slid at its base after achieving peak shear strength.
The envelopes of the measured load-displacement responses of the two walls are compared in Fig. 6a. For the sake of more direct comparisons, the lateral forces are normalized by the gross area of the section bh and by the compressive strength of the concrete fc’. It can be immediately seen that specimen SW6 had very different response in the two loading directions compared to the rather symmetrical response of Wall 2. This unsymmetrical behaviour is devoted to the fact that SW6 was not restrained against out-off-plane displacements, and it exhibited certain unsymmetrical twist about a vertical axis. If the peak resistances in the two directions are averaged, it appears that SW6 was weaker than Wall 2 in terms of normalized shear stress at failure Vmax/bhfc’.
Another important observation is that the two walls differed significantly in terms of stiffness. It can be seen from Fig. 6a that SW6 was significantly less stiff than Wall 2, even though it had a stronger concrete (fc’=26.2 MPa vs. 22.0 MPa). The authors of test SW6 evaluated the stiffness of the wall based on the ASCE 43-05 [14] and ASCE 41-06 [1] provisions, and found that the predictions were respectively 1.56 and 2.38 times larger than the measured stiffness. This discrepancy was explained with “The presence of cracks in the concrete near the base of the wall due to: 1) restrained shrinkage associated with the large foundation and reinforcement; and 2) tensile strain in the concrete at low levels of drift…” [13].
a) Measured response b) Deformation and crack patterns
Fig. 6 – Test SW6 [13]
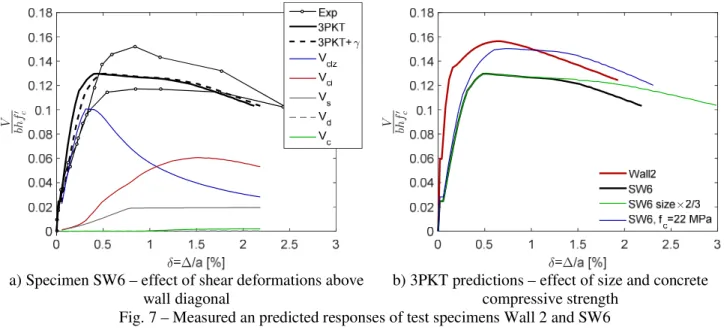
By default, the 3PKT uses a modulus of elasticity of the concrete calculated from the compressive strength of the concrete E# 33201f#′+6900, MPa [15]. However, to account for the actual condition of the concrete prior to the test, specimen SW6 was analyzed with one-half of this value. The complete load-displacement response predicted on this basis is shown in Fig. 7a together with the predicted components of shear resistance. Since the 3PKT is based on kinematics of fully-cracked walls, it is not suitable for predicting the initial linear response. For this reason the initial response is modelled based on the classical Timoshenko beam theory, taking into account the shear deformations. This linear response is utilized up to the intersection with the 3PKT curve. It can be seen that – with the corrected modulus of elasticity – the classical beam theory captures well the initial response of the wall. It can also be seen that the peak- and post-peak response predicted by the 3PKT approximates well the average of the measured responses in the two loading directions. The 3PKT however underestimates the deformations in the pre-peak regime.
The underestimation of the deformations is explained with the way specimen SW6 was loaded. As discussed earlier in Fig. 5, the wall was not loaded through a rigid block, but through bolted steel plates. It can be assumed that this test apparatus applies an approximately uniform load along the depth of the section, and does not completely restrain the horizontal deformations at the level of the load. As a result, shear cracks can propagate trough the loaded section, and therefore through the rigid block assumed in the 3PKT. This is confirmed by the diagram in Fig. 6b which was generated from test data available in [16]. The diagram shows the linear strains measured on a grid of targets attached to the face of the wall, where the darker shades of grey indicate larger strains. From these strains it can be seen that the cracks in the wall were steeper than the wall’s diagonal, and therefore they penetrated the assumed rigid block. To account for the additional deformations in the block in a simple and approximate manner, it is suggested to increase the 3PKT-predicted drifts with the shear deformations in the block estimated as:
γ 1008 94.67 (5)
where the shear modulus Gc of the concrete is assumed equal to 0.4Ec. As evident from the dashed line in Fig. 7a, this additional drift improves the 3PKT prediction.
Finally, it is of interest to use the 3PKT to explain the apparent difference in strength Vmax/bhfc’ between walls SW6 and Wall 2. One possible hypothesis could be the size effect in shear, considering that SW6 was 1.53 types larger than Wall 2. According to Fig. 7b however, decreasing the size of wall SW6 by a factor of 2/3 increases the ductility of the wall, but does not influence the shear strength. Instead, the 3PKT predicts that the main reason for the strength difference between the two walls is the difference in concrete strength. If wall SW6 is analyzed with the concrete strength of Wall 2 (fc’=22 MPa), the peak resistances of the specimens become almost identical. This shows that, even though the walls are squat and work predominantly in diagonal compression, the shear resistance does not scale linearly with the compressive strength of the concrete.
a) Specimen SW6 – effect of shear deformations above
wall diagonal
b) 3PKT predictions – effect of size and concrete compressive strength
Fig. 7 – Measured an predicted responses of test specimens Wall 2 and SW6
4. Effects of aspect ratio and amount of reinforcement on the response of squat walls
To further validate the 3PKT approach and to study the effects of test variables, it is of interest to analyze more squat walls tested by Luna et al. [13] to which the model is applicable. As discussed earlier, the 3PKT applies to walls for which the shear reinforcement (spring Fs) is predicted to yield before the yielding of the flexural reinforcement (vertical tie). Figure 8 shows the measured and predicted responses of the walls for which this condition is met. The properties of the walls are listed in Table 1.
Specimens SW5 and SW6 had an aspect ratio of 0.33 and differed only in terms of reinforcement ratios ρl and ρv (ρl=ρv=1.0% for SW5 vs. 0.67% for SW6). It can be seen from Fig. 8 that the 50% larger reinforcement ratio of SW5 resulted in a relatively modest increase of shear strength and a more significant reduction of drift capacity. Drift capacity δu is defined here as the drift at 20% drop of lateral resistance. For the sake of comparisons, the 3PKT load-displacement curves are terminated at the predicted δu. The 3PKT captures reasonably well the responses of specimens SW5 and SW6, even though it overestimates the drift capacity of SW5.
Specimens SW9 and SW10 had an aspect ratio of 0.54 and differed only in the amount of shear reinforcement (ρv=0.67% for SW9 vs. 0.33% for SW10). As compared to the shorter walls, the trend in drift capacity is reversed: a 50% increase of shear reinforcement resulted in a decrease of drift capacity. These subtle trends are captured by the 3PKT which accounts for the complex interactions of the shear mechanisms in shear-dominated walls.
Fig. 8 – Effect of aspect ratio and amount of reinforcement on the shear response of squat walls – tests SW5, SW6, SW9 and SW10 [13]
Table 2 – Measured and predicted shear strength and drift capacity of test specimens Wall ID a/h [%] ρ ρ [%] f#′ [MPa] N bhf#* Experiment 3PKT Experiment/ Prediction Δ; [mm] δ; [%] V[kN] , [mm] δΔ; ; [%] V[kN] , δ; V, VK1 2.2 0.82 0.08 35 0.071 62.7 1.90 729 73.4 2.23 710 0.85 1.03 VK3 2.2 1.23 0.08 34 0.073 44.6 1.35 879 55.9 1.69 880 0.80 1.00 VK6 3.0 1.23 0.08 44.4 0.056 101 2.24 666 106.0 2.35 661 0.95 1.01 VK7 2.2 1.23 0.22 30 0.082 74.3 2.25 903 64.4 1.95 890 1.15 1.01 Wall 2 0.33 0.8 0.3 22 0 11.9 1.80 684 12.5 1.90 688 0.95 0.99 SW5 0.33 1 1 29.7 0 13.8 1.37 3230 19.7 1.96 2573 0.70 1.26 SW6 0.33 0.67 0.67 26.2 0 22.8 2.27 2540 21.8 2.16 2104 1.05 1.21 SW9 0.54 1.5 0.67 29.7 0 19.4 1.18 2820 24.4 1.48 2714 0.80 1.04 SW10 0.54 1.5 0.33 31.7 0 17.8 1.08 2350 12.2 1.28 2594 0.84 0.91 Avg. Exp/Pred = 0.90 1.05 COV [%] = 15.69 10.5 Finally, Table 2 summarizes the main experimental and predicted results for all 9 walls discussed in this study. The table lists the drift capacity of the walls δu, the corresponding lateral displacement ∆u, and the lateral resistance Vmax. The average experimental-to-predicted ratio for the drift capacity is 0.90 with a coefficient of variation COV=15.69%. For the lateral resistance the corresponding values are 1.05 and 10.5%. These results show that the 3PKT method with only three DOFs can produce adequate predictions of both strength and displacement capacity of shear-dominated walls.
= /a [%] 0 0.5 1 1.5 2 2.5 3 0 0.02 0.04 0.06 0.08 0.1 0.12 0.14 0.16 0.18 a/h =0.33 l =1% v =1% SW5 Exp 3PKT Vclz Vci V s Vd V cf = /a [%] 0 0.5 1 1.5 2 2.5 3 0 0.02 0.04 0.06 0.08 0.1 0.12 0.14 0.16 0.18 a/h =0.33 l =0.67% v =0.67% SW6 Exp 3PKT Vclz Vci V s Vd V cf
5. Conclusions
In this paper the complete response and drift capacity of shear-dominated reinforced concrete walls were studied with the help of a three-parameter kinematic theory (3PKT). The 3PKT was applied to nine tests from the literature featuring reversed cyclic loading. Based on these analyses, the following conclusions are drawn:
• The 3PKT produced excellent predictions of the complete envelope of the load-displacement responses of moderately short walls (aspect ratios a/h=2.2-3.0), including the drift at shear failures following flexural yielding.
• The 3PKT also captured reasonably well the shear behaviour of squat walls (a/h=0.33-0.54). According to the model, shear failures in such members occur under a complex interaction between crushing of the concrete in the critical loading zones and aggregate interlocking along flat critical cracks.
• It was demonstrated that the behaviour of squat walls is affected by the manner in which the lateral load is introduced at the top of the wall. While the original 3PKT captured well the behaviour of a member loaded through a stiff concrete block, a modification of the model was necessary to capture the additional deformations in walls without a top block.
• With this modification, it was shown that the 3PKT can capture the effect of low concrete stiffness, concrete strength, aspect ratio, and reinforcement rations on the pre- and post- peak response of squat walls.
• The 3PKT produced shear strength experimental-to-predicted ratios with an average of 1.05 and a coefficient of variation COV=10.5%. Similarly accurate predictions were obtained for the drift capacity of the walls: an average of 0.90 and COV=15.69%.
It is important to note that – since the 3PKT uses only three degrees of freedom to describe the deformations patterns in shear-dominated walls – it combines simplicity and accuracy with excellent computational efficiency.
Notation
Ec = concrete modulus of elasticity; jd = lever arm between Fb and Ft,max;
Fb = compression force at base of fan; lt = cracked length along longitudinal reinforcement;
FCLZ1,
FCLZ2
= compression forces in the concrete of CLZ; lk = length of transition zone between fan and rigid block;
Fcn, Fct = normal and tangential contact forces at the bottom of critical diagonal crack;
n = axial load ratio;
Fci = aggregate interlock force; w = crack width;
Fd = dowel action force; α = angle of wall diagonal with respect to the vertical axis;
Fs = force in the stirrups; α1 = angle of critical crack;
Fsc = force in longitudinal reinforcement in CLZ; γ = shear deformations in the block expressed in terms of drift;
Ft = force in longitudinal tension reinforcement; δu = lateral drift capacity;
Gc = concrete shear modulus; δx, δz = x- and z- displacements of points from wall;
N = axial load; εb = strains across base section;
V = shear force and lateral load; εt = strains along longitudinal tension reinforcement; Vi = components of shear resistance; εt,avg = average strains along longitudinal tension
reinforcement;
Vmax = peak shear force and peak lateral resistance; εy = yield strain of longitudinal reinforcement; a = M/V - wall height subjected to shear; εv = strain in transverse reinforcement; b = width of wall cross section; ∆ = applied lateral displacement; d = effective depth of section; ∆c = horizontal displacement at CLZ;
d1 = distance from compressive edge of section to furthest tension longitudinal bar;
∆cx = vertical displacement at CLZ; fb = stresses in compression zone in base section; ∆i = deformations of springs;
ft = stresses along longitudinal tension reinforcement; ∆i0 = displacements of ends of springs attached to the fan (offset displacements);
fc' = concrete cylinder strength; ∆u = lateral displacement capacity;
fy = yield strength of longitudinal reinforcement; ρl = ratio of total longitudinal reinforcement; fyv = yield strength of transverse reinforcement; ρv = ratio of transverse reinforcement;
h = depth of wall section; θb = angle of force Fb with respect to the vertical axis;
References
[1] ASCE/SEI 41-06 (2007) “Seismic rehabilitation of existing buildings”, American Society of Civil Engineers ASCE, Reston,VA, 411 pp.
[2] Biskinis, D. and Fardis, M. N. (2010) “Flexure-controlled ultimate deformations of members with continuous or lap-spliced bars.” Structural concrete, 11(2), 93-108.
[3] CEN, Eurocode 8 (2005) “Design of structures for earthquake resistance - Part 3: Assessment and retrofitting of buildings”, European Committee for Standardization, Brussels, Belgium.
[4] Priestley, M.J.N., Calvi, G.M. and Kowalsky, M.J. (2007) “Displacement-based seismic design of structures.” IUSS Press, Pavia, Italy, pp. 721.
[5] Mihaylov, B., Hannewald, P., and Beyer, K. (2016). "Three-parameter kinematic theory for shear-dominated reinforced concrete walls." J. Struct. Eng., 10.1061/(ASCE)ST.1943-541X.0001489, 04016041.
[6] AASHTO. (2007). AASHTO LRFD bridge design specifications, 4th Ed., Washington, DC, 1526.
[7] Li, B., Maekawa, K., and Okamura, H. (1989). “Contact density model for stress transfer across cracks in concrete.” J. Faculty Eng., 40(1), 9–52.
[8] Paulay, T. (1971). “Coupling beams of reinforced concrete shear walls.” J. Struct. Div., 97(ST3), 843–862.
[9] Bimschas, M. (2010). “Displacement-based seismic assessment of existing bridges in regions of moderate seismicity”, Ph.D. thesis, Institute of Structural Engineering, Swiss Federal Institute of Technology Zurich.
[10] Bimschas, M.; Chatzi, E.; and Marti, P., “Inelastic Deformation Analysis of RC Bridge Piers, Part 2: Application and Verification,” ACI Structural Journal, V. 112, No. 3, May-June 2015, pp. 277-286.
[11] Hannewald, P., Bimschas, M., and Dazio, A. (2013). “Quasi-static cyclic tests on RC bridge piers with detailing deficiencies.” IBK Rep. 352, Swiss Federal Institute of Technology ETH, Zurich, Switzerland.
[12] Wiradinata, S. (1985). “Behaviour of squat walls subjected to load reversals.” M.S thesis, Dept. of Civil Engineering, Univ. of Toronto, Toronto.
[13] Luna, B. N., Rivera, J. P., and Whittaker, A. S. (2015). “Seismic behavior of low-aspect-ratio reinforced concrete shear walls.” ACI Struct. J., 112(5), 593–603.
[14] ASCE/SEI 43-05, 2005, “Seismic Design Criteria for Structures, Systems, and Components in Nuclear Facilities,” American Society of Civil Engineers, Reston, VA.
[15] Carrasquillo, R.L., Nilson, A.H., and Slate, F.O. (1981). “Properties of high strength concrete subject to short-term loads.” ACI Struct. J., 78(3), 171–178.
[16] Bismarck Luna, Jonathan Rivera, Josh Rocks, caglar goksu, Scot Weinreber, Andrew Whittaker (2013). "University at Buffalo - Low Aspect Ratio Rectangular Reinforced Concrete Shear Wall - Specimen SW6", Network for Earthquake Engineering Simulation (distributor), Dataset, DOI:10.4231/D3WP9T661.
![Fig. 1 – Kinematic model for shear-dominated walls [5]](https://thumb-eu.123doks.com/thumbv2/123doknet/6737329.185711/3.892.149.743.397.766/fig-kinematic-model-shear-dominated-walls.webp)
![Fig. 2 – Load-bearing mechanisms in shear-dominated walls [5]](https://thumb-eu.123doks.com/thumbv2/123doknet/6737329.185711/4.892.172.728.626.1025/fig-load-bearing-mechanisms-shear-dominated-walls.webp)
![Table 1 – Properties of test specimens Wall ID b [mm] h](https://thumb-eu.123doks.com/thumbv2/123doknet/6737329.185711/5.892.82.820.579.796/table-properties-test-specimens-wall-id-b-mm.webp)
![Fig. 3 – Measured and predicted response of test specimens VK1, VK3, VK6 and VK7 (tests by [9][10][11]) 3.2 Squat walls with a/h≤1.0](https://thumb-eu.123doks.com/thumbv2/123doknet/6737329.185711/6.892.95.800.102.477/fig-measured-predicted-response-specimens-tests-squat-walls.webp)
![Fig. 8 – Effect of aspect ratio and amount of reinforcement on the shear response of squat walls – tests SW5, SW6, SW9 and SW10 [13]](https://thumb-eu.123doks.com/thumbv2/123doknet/6737329.185711/10.892.97.755.138.634/effect-aspect-ratio-reinforcement-shear-response-squat-walls.webp)
