Work, family and aging; towards a new articulation of social times over the lifetime ?
25
0
0
Texte intégral
(2) 2. Distribution : Chaire Bell en technologies et organisation du travail Télé-université Université du Québec à Montréal 100 rue Sherbrooke Ouest , Montréal, Québec, Canada H2X 3P2 Téléphone : 514-843-2015 poste 2878 Fax : 514-843-2160 Courriel : dgtrembl@teluq.uqam.ca. Biographical note Diane-Gabrielle Tremblay is the Co Chair of the Bell Canada Chair on Technology and Work Organization as well as Canada Research Chair the Socio-Organizational Challenges of the Knowledge Economy. She is professor of economics and management at the Télé-université of the Université du Québec à Montréal. She is president of the Committee on Sociology of Work of the International Sociological Association, member of the Executive Council of the Society for the Advancement of SocioEconomics, as well as co-chair of the "social times and working times" committee of the Association internationale des sociologues de langue française. She is also president of the Association d’économie politique and editor of the electronic journal Interventions économiques. Also professeur associé with. Ecole nationale d’administration publique and UQAM, she has been invited professor at the following universities: université de Paris I Sorbonne, université de Lille I, Institut d’administration des entreprises de l’université de Lyon 3, European School of Management, and Université de Louvain-la-Neuve, in Belgium.She has published many articles and books on employment and types of employment, job training, innovation in the workplace and work organization, as well as the articulation between work and family life. See websites for details: www.teluq.uqam.ca/chaireecosavoir www.teluq. uqam.ca/chairebell www.teluq. uqam.ca/interventionseconomiques www.teluq. uqam.ca/chaireecosavoir/cvdgt;. e-mail : dgtrembl@teluq.uqam.ca NOTE: THIS PAPER WAS PROPOSED TO THE AEPP (ASSOCIATION FOR EMPLOYMENT AND PUBLIC POLICY) CONFERENCE, OCT 4-7 TH 2007, USA..
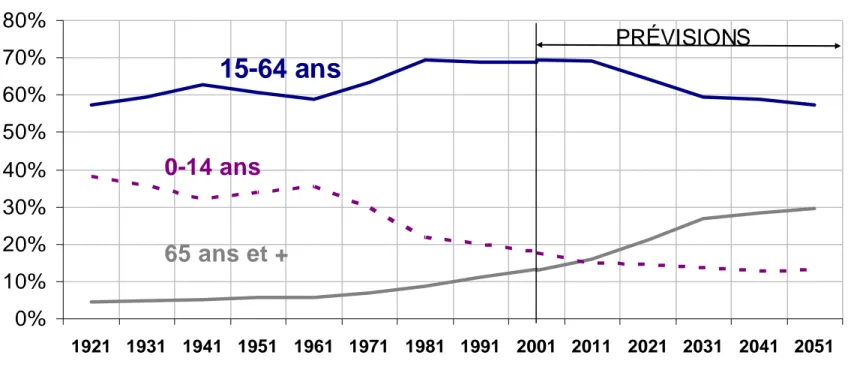
(3) 3. Over recent years, there has been more and more interest in the reorganization of working time and social times (all times affected at various activities of life), in the context of aging of the population and of increasing difficulties for many to manage professional obligations as well as personal or family responsibilities2. In the context of an aging population, which will lead to a reduced supply of labor over the coming years, a problem which confronts all nations, but Québec and Canada with somewhat more severity than the US.. In order to solve the problem and maintain our standard of living, a few possibilities are open, but basically, even if productivity may be increased, the essence of the solution lies in an increase of working hours and an increase in activity rates. In this context, we undertook a research on working time in Canada and workers’s aspirations in this context.. The present article intends to elaborate on this question by analyzing the evolution of employed peoples’ work time in Québec and Canada, and by confronting the analysis to empirical data of a very large typical sample of the Canadian labour market on the issues of workers’ situation and aspirations as regards working time and working arrangements 3. 1.The problems First, we will present a few tables to set the scene and understand the challenges at stake in relation with the aging of the population. We present data for Québec, since this is the Canadian province which presents the most challenges and will age most quickly, but Canada follows close behind and the Canadian government is also preoccupied with this issue. As figure 1 shows, the working age group (15-64) will shring starting around 2008 in Québec, while the 65 and over will increase their share and the 0-14 will decrease their share substantially. 2. Among the Quebec and Canada studies, we mention: Descarries and Corbeil (1995; Descarries et al. 1995b); Guérin et al. (1994); Secrétariat à la famille (1994); Conseil du statut de la femme (1990); Frederick (1995); MacBride-King (1990); Paris (1989); Lero et al. (1992; 1993); Lee et al. (1994; 1992). 3. A more detailed explanation concerning the representative character of the sample is supplied farther in this article..
(4) 4. Figure 1. Evolution of the population of Québec by age groups, from 1921 to 1951. Répartition de la population du Québec selon l'âge,1921-2051 80% 70%. PRÉVISIONS. 15-64 ans. 60% 50% 40%. 0-14 ans. 30% 20%. 65 ans et +. 10% 0% 1921 1931 1941 1951 1961 1971 1981 1991 2001 2011 2021 2031 2041 2051. Source: Matte, B. presentation at the Political economy association conference, Montreal, Nov. 2007. Emploi et niveau de vie dans un contexte de vieillissement et de précarité des finances publiques. Forthcoming in Tremblay, Diane-Gabrielle (2007). Halte à la retraite ! De la conciliation employ-famille à une gestion des âges. Québec : Presses de l’université du Québec.
(5) 5 Figure 2. Percentage of employment of the 15-64 age group in various zones Taux d'emploi 15-64 ans (%)* 72. Canada. 70. OCDE. 68. G-7. 66 64 62. Union européenne. 60 58. Québec. 56 54 1961. 1969. 1979. 1989. 2002. Source: Matte, B. presentation at the Political economy association conference, Montreal, Nov. 2007. Emploi et niveau de vie dans un contexte de vieillissement et de précarité des finances publiques. Forthcoming in Tremblay, Diane-Gabrielle (2007). Halte à la retraite ! De la conciliation employ-famille à une gestion des âges. Québec : Presses de l’université du Québec. As figure 2 shows, the level of employment in Canada is quite high, and it is true that many European countries have lower activity rates in the 15-30 age group as well as the 55 and over. In the latter case, this is due to the fact that many countries had public pre-retirement schemes in which the State financed workers to retire early. (Guillemard, 2007). The problem of the aging population is all the more important in Québec in comparison with Ontario and the US since the age group of 55-64 is much less active in Québec in comparison with the US and even with Ontario, as the figure 3 shows. Even if there has been an increase in the activity rate of these groups, it is still well below that of Canada and the US, while the aging of the population is somewhat more accelerated in Québec, because of the fact that it receives less immigration than the two other zones, and that immigrant families generally have more children..
(6) 6. Taux d'emploi selon l'âge (1983) 90 80 70 60 50 40 18-24 ans 25-54 ans 55-64 ans. Québec. États-Unis. Ontario. Taux d'emploi selon l'âge (2003) 90 80 70 60 50 40 18-24 ans. 25-54 ans 55-64 ans. Source: Matte, B. presentation at the Political economy association conference, Montreal, Nov. 2007..
(7) 7. Figure 4. Average number of hours worked by worker and by year, Québec, Ontario and OECD countries,. Nombre moyen d'heures travaillées par travailleur et par année Québec, Ontario et certains pays de l'OCDE 2 180 2 080. Japon. 1 980. États-Unis. Ontario. 1 880 1 780 1 680. Suède. Québec France. 1 580 1 480 1950. 1960. 1970. 1980. 1990. 2000. Source: Matte, B. presentation at the Political economy association conference, Montreal, Nov. 2007.. Finally, figure 4 indicates again that Québec workers work on average more than the French and the Swedish but also highlights the fact that the US work longer hours, while the Japanese and Ontarians work about the same number of annual hours but Québec is somewhat below.. It is in this context that some have put forward the proposition of pushing back the age of retirement, but as the French example of the 2003 Fillon law shows, this does not necessarily have an impact on prolongation of activity (Guillemard, 2007). Indeed, as much research shows (David, 2007), if working conditions and working hours are not satisfactory, it is difficult to keep workers longer. Most analysts now conclude that to increase activity rates of the 55-64 years of age, it is necessary to redesign work and working time. This is why we wanted to address the issue of working time in a lifelong perspective, since it appears that the ternary model (schooling, work, retirement succession) is a thing of the past and that working times should be envisaged in a more flexible way. This brings us to the second problem which needs to be addressed in this context and it is that of the growing difficulty in managing professional lives and personal-family lives as well..
(8) 8 Indeed, there is a growing conflict between work and family and this is due to important changes that have arisen in the family, in the composition of the labour force. and in the work. organization. In regards to the family, the changes are characterized by a reduction in the number of children per household but, on the other hand, by a higher percentage of women who will have children during their life, by a frequent time prolongation of children remaining or returning to the family residence, as well as the necessity for many households to provide care to aging parents.. As concerns the workforce, the most striking evolution is certainly the massive arrival of women on the labour market. The new workforce counts more women than ever, of all ages and in various periods of their lives, as well as a growing percentage of families where both spouses work. The working population also includes more women with very young children, more singleparent families, and more men and women workers who, because of the aging population and a social deinstitutionalization movement, have to provide care to aging parents in loss of autonomy or to physically or mentally disabled persons. This is a good evolution in terms of increasing the labour force and increasing activity rates of all, but it poses other challenges throughout women’s active life, since family and parental responsibilities and tasks generally remain the load of women. (Tremblay, 2004). The sphere of work is also in full change. The current economic requirements, which are namely characterized by criteria such as "just-in-time" and continuous and intensive production, encourage more than ever the employers to demand always more flexibility: flexibility of the employee’s status, costs of workforce, of working time, etc. In practice, this requirement results in a destandardization of jobs and working schedules. What was rare in the 50s and 60s became the rule in numerous workplaces: irregular, unpredictable schedules, evening, night, weekend, during holidays, on call, part-time, at home, in overtime, and so on. These pose challenges for employees assuming family responsibilities and having to plan their schedules while consolidating childcare, school, doctor's, dentist's or other appointments, in other words tending to family needs and obligations and errands, the organization of the everyday life can become very difficult..
(9) 9 As women entered the labour market and as the roles between men and women were redefined, both spheres became communicating vases: the family life suffers the repercussions of the confusion arising in the working world and, conversely, the working world undergoes more and more directly the impacts of elements which destabilize the family. All of this contributes to emphasize the problem of the conflict between the personal life and the professional life, or work-life balance for short.. If the problem cannot be considered as completely new, certain factors contributed to make it more complex during the last decades: a) the current changes in the family and, particularly, the increase of the number of working women and single-parent families; b) the transformations which occur in the working world, notably flexible hours imposed by the employer, the broken schedules, the schedules other than "9 to 5", etc.; c) the delay of adaptation of public services, as well as public policies and the companies' practices offering few work-family balancing measures. (Paquet and Najem, 2005; Tremblay, 2005, dir); d) and, finally, the weak participation of many fathers in the parental responsibilities and family tasks (Pronovost, 2005), in spite of a greater interest from their part and a more active participation from some (Tremblay, 2003).. The relation between employment and family is not thus new and its challenges are only more important in the present context of aging populations, since not only will families have to take care of children, but many will also have to take care of aging parents, as was highlighted in table 1. Also, if the number of persons actively engaged in the labour market diminishes, it will of course be difficult to sustain our standard of living, but also universal health and education services to which Canadians are very attached.. The work-life issue is thus not totally new, but what is new is the growing complexity surrounding this relation and its management by families. Wanting too much to simplify the origin of the difficulties would be of course reductionist, but a statistical analysis led with a.
(10) 10 sample of a thousand respondents had allowed to identify some determining variables, namely the work duration, the persons' age and the number of children. (Tremblay, 2004b). Thus, in order to try to validate these first results while bringing certain light on the contradictions raised in the introduction, we wanted to push the analysis further.. Certain researches indicate that aging workers change their attitude towards their work (Gosselin, Paquet and Marcoux, 2005) and then seek for better organization of working time at the end of their career. Analyses differentiating according to age will allow us to see to what extent groups that are the most likely to be parents and have difficulties of conciliation (35-44) are more or less favored compared to the aging workers from the point of view of time schedules and organization measures, while seeing how their aspirations can be different. Thus, it is on the basis of reflection on time and ages of life that we organized our empirical research.. 2. The methodology and the source of data In order to give a documented answer to the questions addressed in the present article, we used the data of the Workplace and Employee Survey (WES) of Statistics Canada which gives the researchers empirical data representative of the Canadian labour market.4 Based on this survey, we wanted to know the working hours of the working people, according to their age group, in order to see if the 35 to 44-year-old category identified before as having more difficulties of work-family balance is more affected than the others by the long schedules (habitual hours and overtime). We also wanted to determine if getting older allows benefiting from more measures of organization of working time, which are favourable to conciliation, and finally, we were interested in aspirations according to age as regards to working time and work-family balance .. The data contained in the Workplace and Employee Survey (WES) provides answers to our questions. For the purposes of the present research, we will use, on a merged basis, the data gathered from the employers and the answers supplied by the employees in the course of the survey. Indeed, the WES includes two data banks, the employers' and the employees', containing together several hundreds of indicators. The WES aims at a representative sample of the Canadian labour market, with the exception of the federal, provincial and municipal public.
(11) 11 services which are excluded. Its data was collected among 6 000 companies and some 23 000 wage earners of these same companies (Statistics Canada, 2004). Data banks are built in order to be able to be merged to acquire all available information on an employee and the firm which employs him. Results introduced in the next section derived precisely from the merger of these two banks.. For the purposes of this research, we used the weighted results which allow a generalization of the data to the Canadian labour market, with the exception, as we have already mentioned, of the public services. The data used is from the 1999 and 2002 surveys. On a longitudinal basis, it is a relatively short period (4 years), but however, it should give some good indications of present trends in the labour market, especially since these four years were marked by an important public debate on the question of working time and work-family balancing. If firms’ practices followed the social tendency of ideas and debate, we should notice changes in the course of the analysed period.. The data of 1999 was chosen because it was the first year of the WES. At the time of the analysis, the 2002 data was the last available data; the 2003 and 2004 surveys data are not yet accessible to the researchers. Also let us mention that the SAS software was used for the merger of both data banks (employers and employees), for the recoding of the information and the elaboration of the composite variables as well as for the univariate and bi-variate statistical analyses which are presented here. . 5. During the presentation of the results, we do not present the coefficients nor the degrees of signification considering that the number of survey respondents, once the sample balanced, exceeds 11 millions.. 3. The results of the analysis. 4. As mentioned above, this analysis was done with our colleagues Renaud Paquet and Elmustapha Najem. Some results were published in French in Tremblay, Paquet and Najem (2005); the article is quoted in the bibliography at the end of paper.. 5. The results were carefully revised to assure us on one hand, that the constraints imposed by Statistics Canada were respected (No dissemination of data where there are less than 5 respondents in a given cell of a table.) and on the other hand, that errors had not slipped during the programming or the compilation.
(12) 12 In the light of the questions highlighted above, we shall present in this section the analyses allowing to verify if working schedules vary according to age, and if the categories considered critical from the point of view of work-family balance (35 – 44-year-old) have longer or shorter schedules than others. We shall then analyze the aspirations relating to working time according to the age group as well as the motives that can explain the interest for a reduced working time, including family obligations. Finally, we shall examine the incidence of the flexible working time measures, among which the reduced or compressed workweek, a measure known as favouring a certain work-family balance. Let us now go on to present the results of our analysis. Working schedules according to the age group6. Tables 1 and 2 present the hours usually worked according to the age group in 1999 and 2002. The most important change is in the group of 24 years old and younger which passed from 30,91 to 37,10 hours usually worked, while the group of 55 years and older reduced a little its hours from 36,26 to 35,67 hours. We also noted a decrease in unpaid overtime, notably in the category of the 35-44 years which passed from 2,22 to 1,46 hours, while the group of 45-54 passed from 2,38 to 2,18 hours. Other age groups show less overtime than these previous two groups, which are however most likely to have family and parental responsibilities. We notice a reduction of the volume of paid overtime, although not as considerable as unpaid hours. At the same time, it is interesting to note that the number of working days a week increased in all groups between 1999 and 2002. In summary, the working time did not really decrease, except for supplementary hours. However, the blocks of spare time are reduced due to an increase in the number of days over which the work is done.. We also observed from the data of tables 1 and 2 an increase in working hours at home for all age groups. We also note that this practice is more common with older workers, which confirms the fact that working from home, or telework, is often appreciated by older workers (Tremblay, 2001; Tremblay, Renaud, Najem, 2006).. Working at home is sometimes perceived as a way of. conciliating family and professional responsibilities (Tremblay, 2002), but it can also however contribute to making it more difficult to draw the line between working time and the.
(13) 13 personal/family time; which could be perceived as a negative work intrusion in the private life (Baines and Gelder, 2003).. Table 1 Working schedules according to the age group in 1999, in number of hours. Usual work hours Unpaid overtime Paid overtime Nbr of workdays per week Weekly hours worked at home. Less than 24 years. 25-34 yrs. 35-44 yrs. 45-54 yrs. 55 and +. 30,91. 37,41. 37,65. 36,97. 36,26. 0,60. 2,10. 2,22. 2,38. 2,02. 1,02. 1,35. 1,16. 0,73. 0,78. 3,93. 4,35. 4,32. 4,37. 4,37. 3,98. 4,91. 5,27. 6,06. 7,54. Table 2 Working schedules according to the age group in 2002, in number of hours. Usual work hours Unpaid overtime Paid overtime Nbr of workdays per week Weekly hours worked at home 6. Less than 24 years. 25-34 yrs. 35-44 yrs. 45-54 yrs. 55 and +. 37,10. 37,09. 37,86. 37,20. 35,67. 0,66. 1,27. 1,46. 2,18. 0,91. 0,09. 0,70. 0,79. 0,94. 0,17. 4,30. 4,74. 4,85. 4,82. 4,77. 2,92. 5,19. 5,49. 7,19. 7,85. Let us note again that the data analysis was done with Elmustapha Najem and REnaud Paquet and the results were first published in French in a journal called Lien social et politique , in 2005.
(14) 14. Some working arrangements can be source of additional difficulties. The shift schedules as well as the changing hours or workdays can also present difficulties for the employees trying to reconcile their personal and family obligations. In this respect, the data of table 3 and 4 indicate that the shift schedules are in progress in all the age groups, except for the 55 and older, where this schedule is less frequent. Also, it seems that increasing percentages of individuals, in each group, work the same hours every day and the same days every week. However, by reversing the percentages on the subject, we realize that in 2002 between 25 and 30 % of individuals still did not work the same hours every day and 30 to 35 % did not work the same days every week.. Table 3 Diversified working schedules according to the age group in 1999, in percentage (%). Rotating shifts schedule Same hours every day Same days every week. Less than 24 years. 25-34 yrs. 35-44 yrs. 45-54 yrs. 55 and +. 23,72. 42,75. 38,68. 50,79. 34,95. 58,34. 54,24. 61,19. 60,37. 54,01. 60,84. 58,80. 60,82. 57,18. 59,93. Table 4 Diversified working schedules according to the age group in 2002, in percentage (%). Rotating shifts schedule Same hours every day Same days every. Less than 24 years. 25-34 yrs. 35-44 yrs. 45-54 yrs. 55 and +. 30,85. 59,40. 52,91. 48,04. 33,22. 75,86. 72,92. 70,65. 68,23. 74,55.
(15) 15 week. 77,12. 64,82. 66,09. 65,47. 71,48. Aspirations in matters of working time The employees' aspirations in working time were often debated in Quebec and Canada. A survey conducted by Human Resources and Social Development Canada in the 1990s indicated that only 6 % of the population expressed their desire to reduce their working time (HRDC-DRHC, 1997). However, if they received a partial wage compensation for the incurred losses, 66% of the members of the Centrale de l’Enseignement du Québec (CEQ) were favorable to a reduction of their working time as mentioned in a survey conducted by the CEQ in the 1990s (FTQ-CEQCSN, 1995). Finally, 48,8 % of the respondents of a survey conducted by the F.T.Q. would agree to reduce their working time without compensation or with a partial compensation of their salary (FTQ-CEQ-CSN, 1995). Since these last surveys were performed on small samples not representative of the population in general, we wanted to analyze the question from the data of the WES, especially since it explains the motives justifying such a reduced workweek (RWW).. The data of tables 5 and 6 highlight the link between the age and the desire to increase or reduce the working hours. The youngest aspire to longer hours, while the categories the most susceptible to have family responsibilities (25-34; 35-44 and 45-54) are those who are the most interested in a reduced workweek. The people of 55 years of age and older were also interested in a reduced workweek in 1999, but not as many in 2002. However, it is necessary to note that the majority of employees are satisfied with their working hours, since only a minority wishes to change them.. Moreover, the data of 1999 and 2002 indicate that the family obligations and the desire to get more leisure time are the most mentioned motives among the minority wishing to reduce their hours (from 0,64 % to 11,67 %). Thus, in 2002, more than 45 % of the group of 25-34 years, wish to reduce their hours for family obligations while this number exceeds 60 % for the 35-44 years and 50 % for the 45-54 age group. The percentage gradually reduces for the following age.
(16) 16 groups. In the case of these last age groups, it is especially the desire to have more leisure time that explains the interest for the RWW..
(17) 17 Table 5. Aspirations in matters of working time according to the age group in 1999 Less than 24 years. 25-34 yrs. 35-44 yrs. 45-54 yrs. 55 and +. 37,72. 22,76. 16,73. 14,68. 10,15. 2,34. 8,55. 11,67. 11,17. 10,01. 55,38. 41,47. 54,04. 34,91. 10,81. 22,93. 18,80. 18,38. 19,48. 8,56. 23,70. 49,80. 51,30. 60,66. 65,78. Wants additional hours Wants reduced hours Reduce for family obligations Reduce for stress related to work Reduce for more leisure time. Table 6 Aspirations in matters of working time according to the age group in 2002 Less than 24 years. 25-34 yrs. 35-44 yrs. 45-54 yrs. 55 and +. 39,70. 24,28. 18,53. 14,55. 11,87. 0,64. 7,27. 8,56. 10,64. 6,62. 43,06. 46,00. 60,38. 53,05. 21,77. 22,26. 23,54. 26,76. 42,65. 22,08. 50,07. 56,75. 54,71. 65,33. 63,24. Wants additional hours Wants reduced hours Reduce for family obligations Reduce for stress related to work Reduce for more leisure time. Working time arrangements We mentioned above that working at home is sometimes perceived as a way of reconciling family and professional responsibilities (Tremblay, 2002), but that it can also be perceived as a negative work intrusion in personal life (Baines and Gelder, 2003). We observed (see tables 1 and.
(18) 18 2) an increase of working hours at home for all age groups and noted that this practice gains more popularity as we get older. Tables 7 and 87 provide additional information on the subject and indicate that work requirements explain why the individuals sometimes work at home. We also observe that this practice decreased or remained stable in all age groups; while we cannot claim that working at home is a developing practice, at least for this recent period, the number of hours worked from home is still important (around 6 hours per week) and this is generally because of work requirements.. Family obligations are not a predominant reason for working at home but it is interesting to note the relatively high percentage of respondents who work at home for other reasons, including aiming for better working conditions, hoping to get more spare time and saving money. This latest result confirms in part those based on researches on telework (CEFRIO, 2001) which indicated that time and money saving were the primary motives of choosing this type of work. Also, other analyses of the data show that workers with children more often work at home for family reasons, the percentage being in the range of 6 to 7 %.. With regards to the working time arrangements, we note that the compressed workweek is more accessible to the young employees (younger than 24 years) and to the 55-year-old and over in 2002, compared to 1999, when other groups benefited more from this opportunity. However, this measure is not frequently used, the percentage being always lower than 10 %, except for the 2534- year-old in 1999. The reduced workweek on the grounds of a special agreement with the employer also diminished in all the age groups, but particularly in the 25-34, 35-44 and 45-54 groups, so we can deduct that this measure does not seem to be favoured by the employees. Finally, as for the flexible time, the younger groups seem to prefer this option (less than 24 year olds and 25-34); the other age groups demonstrate less interest, the percentage decreasing from 1999 till 2002. 4. Tables 7 and 8 present the mention “NA" in relation to the family obligations motive for the work at home. This mention is to indicate that the number of the respondents in one of the cells of this line was under 5 and that due to Statistics Canada regulations, we cannot use the data in this case. It is probably in the 24 and under group that there are less than 5 cases. As for the motive "other reasons" of these same tables, it includes looking for better work conditions, gaining time and saving money..
(19) 19 Table 7 The time management measures according to the age group in 1999. Work at home Work at home for work requirements Work at home for family obligations Work at home for other reasons Compressed workweek Reduced workweek Flexible time. Less than 24 years. 25-34 yrs. 35-44 yrs. 45-54 yrs. 55 and +. 8,83. 26,91. 30,48. 28,24. 28,37. 63,83. 66,05. 65,66. 66,35. 63,75. NA. NA. NA. NA. NA. 30,41. 27,28. 29,85. 31,11. 36,05. 4,92 17,68. 11,22 14,59. 9,95 11,73. 9,43 13,84. 5,14 10,90. 45,06. 40,28. 40,08. 36,21. 39,65. NA= Data not available. Table 8 The time management measures according to the age group in 2002. Work at home Work at home for work requirements Work at home for family obligations Work at home for other reasons Compressed workweek Reduced workweek Flexible time. NA= Data not available.. Less than 24 years. 25-34 yrs. 35-44 yrs. 45-54 yrs. 55 and +. 9,16. 22,03. 29,12. 29,76. 25,40. 45,31. 65,51. 72,07. 56,55. 57,89. NA. NA. NA. NA. NA. 54,16. 26,97. 22,06. 36,79. 40,37. 8,97 14,60. 6,55 6,78. 5,78 6,36. 6,64 6,29. 6,93 10,50. 50,43. 40,66. 38,83. 33,49. 29,29.
(20) 20 Discussion The data presented in this article indicates in general that the progress observed as regards to the social debate on work-family balance was not necessarily translated by an important improvement of the facilitating conditions of the work environments, whether it be for parents or for aging workers. Moreover, in some respects, there was even some decline, making conflicting work-family balance requirements even more difficult.. Concerning our preoccupation with aging and activity rates, it is difficult to conclude that aging workers want reduced working time, since there are even more who wish an increase in their working time. In fact, about one fifth of workers aged 55 and over actually work part time in Canada, so it may be that many of them would want to work more hours, while another percentage would want reduced hours.. As concerns working hours in general, there was no one-way for the movements of the four years studied. We note however an insignificant increase of the working hours for the younger than 24year-old, most likely signifying an improvement of the conditions of the labour market. We also note that the groups which are most susceptible to face difficulties in the reconciliation of their different needs do not report any decrease of working hours, including the most pressurized group of 35-44-year-old.. In opposition, there was a reduction of supplementary hours, but this gain of time is largely compensated by a loss of personal flexibility caused by the average number of days worked per week which is on the increase among all age groups. It is the same scenario for the working hours at home, except for the less than 24 year olds. Indeed, this last indicator could be perceived as an indication of greater flexibility for the employees. However, the data demonstrates that the situation is quite different in the sense that people do not work at home to better reconciliate their obligations, but rather because of the work requirements. Conclusively, we witness here a work overflow on the personal life instead of a practice offering more flexibility to the individual in his time management. Furthermore, this overflow was more important in 2002 than in 1999 for the three groups of 35 years and older. Some qualitative research may be needed to determine to what.
(21) 21 extent aging workers are satisfied and want to work at home, as previous research had indicated (Cefrio, 2001).. Between 1999 and 2002, the degree of stability of working hours increased in both cases of regularity of the daily working schedules and worked weekdays.. On the other hand, in. comparison, we notice an increase of the percentage of the workers among the three age groups of 44-year-old and younger who work on shift schedules. The improvement of the stability seen above is then invalidated and this is surely not a positive element to try to convince people to work longer, as was shown in some analysis of nurses in Québec, who tend to leave hospitals for private care in order to be rid of shift schedules (David, 2007).. Regarding working time arrangements, it is difficult to draw any conclusion about flexible time. However, we notice movements in both directions on the incidence of this type of schedule. Concerning the incidence of the reduced workweek, data shows a decrease of this practice. It seems indeed more difficult than before to reduce working hours. As for the compressed workweek, its incidence increases for the groups younger than 25 years and older than 55 years, but decreases in a substantial way for the other three groups, which are the most susceptible to meet difficulties with the reconciliation of work/family obligations. It is however clear that aging workers appreciate to have more time as was shown in other research (Tremblay, 2004).. Compared to what we observed in other writings, the data show that, no matter the age groups, there is a larger number of Canadians wanting to increase their working hours rather than reduce them. This phenomenon, instead of decreasing in 2002, increases compared to 1999. Among the group wanting to reduce their hours, we notice that it is especially to increase their leisure time, except for the group of 35 – 44-year-old, who would prefer this reduction mainly to better meet their family responsibilities. From 25 to 54 years there is also an important percentage wanting to reduce its hours for family obligations. This difference in comparison with higher percentages mentioned earlier could possibly be explained by the fact that Quebeckers are more sensitive to the questions of reduced working time than their Canadian colleagues, being closer to the European and French debates on such issues, but we should also note that the survey conducted.
(22) 22 here does not concern exclusively the parents, which was the case of other surveys stating the parents' interest for the reduced workweek, notably the parents of young children.. Although the analyzed data does not allow to take into account the underlying influences in the key trends, we believe that, in the current context, the economic pressures appeared to slow down social progress on work-life balance issues and the challenge of the aging population might bring working time arrangements to the top of the agenda in coming years. Certainly, at the macrosocial level, some labour market actors, especially unions, wish that the work environments would take into account aging workers needs as well as allow a better work-family balance with the adoption of facilitating and innovating practices. However, from the company stand point, the changes do not seem to be made to this day. It is undoubtedly because the flexibility in the management of the employee's working time often represents an increased rigidity for the employer in its capacity to use workers when he considers it convenient for operational motives. In a context of increased competition between firms, it is not thus surprising to see that the volunteerism or laissez-faire attitude does not lead to much progress. Considering the challenges related to aging as well as difficulties of work-family balancing stated above, the State will without any doubt have to impose standards or offer incentives to firms who develop programs to allow workers to have more options as concerns work organization and working time, as it was the case these last few years in certain European countries. A policy on work-life balance throughout the life course would surely be a welcome innovation..
(23) 23 Références bibliographiques Baines, S. et Gelder, U. (2003). What is family friendly about the workplace in the home? The case of self-employed parents and their children. Technology, Work and Employment, 18(3), 223-234. Bellemare, D. L. Poulin Simon et Diane-Gabrielle Tremblay (1998). Le paradoxe de l’âgisme dans une société vieillissante; enjeux et défis de gestion. Montréal: Ed. St-Martin. 265 p.. Carlson, Dawn S. ; Kaemar, Michele K. et Williams, Larry J. (2000). « Construction and Initial Validation of a Multidimensional Measure of Work-Family Conflict », Journal of Vocational Behavior, 56 : 249-276. David, H. (2007, forthcoming). Quand la gestion des âges est inapplicable : la précarité d’emploi d’infirmières en soutien à domicile. In Halte à la retraite ! d’une culture de la retraite à une gestion des âges. In Diane-Gabrielle Tremblay, editor. Québec : Presses de l’université du Québec. Guillemard, AM. (2007, à paraître), Vers un nouveau management des âges et des temps sociaux en réponse au vieillissement de la population. Une perspective internationale. Dans Halte à la retraite ! d’une culture de la retraite à une gestion des âges. Sous la direction de Diane-Gabrielle Tremblay. Québec : Presses de l’université du Québec. Sortie prévue vers septembre 2007. Tremblay, D.-G., Renaud Paquet et Elmustapha Najem (2006). Telework: a way to balance work and family or an increase in work-family conflict ? Canadian Journal of communication. Vol. 31 no 2. octobre. 2006. Duxbury, Linda Elizabeth; Higgins, Christopher Alan et Lee, C. (1993). « The Impact of Job Type and Family Type on Work-Family Conflict and Perceived Stress : A Comparative Analysis », Ressources humaines, ASAC’93, 14(9) : 21-29. Fagnani, Jeanne (2000). Un travail et des enfants. Petits arbitrages et grands dilemmes, Paris: Bayard. 2000. Fagnani, J. et Letablier, M.-T. (2001), Famille et travail : contraintes et arbitrages, Problémes politiques et sociaux, n° 858, juin 2001. Families and Work Institute (1997). 1997 National Study of the Changing Workforce, New York : Families and Work Institute. http://www.familiesandwork.org Families and Work Institute (1998). 1998 Business Work-Life Study. Families and Work Institute http://www.familiesandwork.org Flipo, Anne et Régnier-Loilier, Arnaud (2002) , Articuler vie familiale et vie professionnelle en France : un choix complexe, Données sociales 2002-2003, Paris : INSEE..
(24) 24 FTQ-CEQ-CSN (1995). Du travail pour tout le monde. Document de travail de la FTQ, CEQ et CSN. 1er mai 1995. Gosselin, Eric; Paquet, Renaud et Marcoux, Brenda (2005). « Influence des étapes de carrière sur les fluctuations des attitudes au travail », Carriérologie (forthcoming). Guérin, Gilles; St-Onge, Sylvie; Chevalier, Laure; Denault, Kathy et Deschamps, Martine (1997). Le conflit emploi-famille : ses causes et ses conséquences : Résultats d’enquête, Montréal : Université de Montréal, École de relations industrielles, 23 pages. Guérin, Gilles; St-Onge, Sylvie; Trottier, Renée; Haines, Victor et Simard, Manon (1994). «Les pratiques organisationnelles d'aide à la gestion de l'équilibre travail-famille: la situation au Québec», Gestion, 19(2), p. 74-82. Guillemard, Anne-Marie (2007). presentation at the Political economy association conference, Montreal, Nov. 2007.Vers un nouveau management des ages et des temps sociaux en réponse au vieillissement de la population. Perspectives internationales. Forthcoming in Tremblay, DianeGabrielle (2007). Halte à la retraite ! De la conciliation employ-famille à une gestion des âges. Québec : Presses de l’université du Québec HRDC-DRHC (1997). Les Canadiens veulent travailler davantage et non moins. La recherche appliquée. Bulletin, vol. 3, no 1. pp. 11-13. Matte, B. presentation at the Political economy association conference, Montreal, Nov. 2007. Emploi et niveau de vie dans un contexte de vieillissement et de précarité des finances publiques. Forthcoming in Tremblay, Diane-Gabrielle (2007). Halte à la retraite ! De la conciliation employ-famille à une gestion des âges. Québec : Presses de l’université du Québec Nelson, Debra L. et Quick, James C. (1985). « Professional Women : Are Distress and Disease Inevitable? », Academy of Management Review, 19(2) : 206-218. Pronovost, G. (2005). La conciliation famille-travail et l’aménagement du temps. In Tremblay, D.-G. (2005, dir). De la conciliation emploi-famille à une politique des temps sociaux. Québec : Presses de l’université du Québec. Statistique Canada (2004). Guide pour l’analyse de l’enquête sur le milieu de travail et les employés. www.statcan.ca:8096/bsolc/francais/bsolc?catno=71-221-G&CHROPG=1 St-Amour, Nathalie. (2005). La conciliation travail famille et la santé; une recension des écrits. Dans Tremblay, Diane-Gabrielle (2005, sous la dir.). De la conciliation emploi-famille à une politique des temps sociaux! Québec : Presses de l’université du Québec. Collection Économie politique. 287 p.. Tessier, J. Beaudry et G. Savoie, Influence des facteurs psycho-sociaux associés au double statut des mères-travailleuses sur leur santé physique et leur bien-être psychologique, rapport final, UQAM, 1992, p. 103. Tremblay, Diane-Gabrielle (2005, sous la dir.). De la conciliation emploi-famille à une politique des temps sociaux! Québec : Presses de l’université du Québec. Collection Économie politique. 287 p..
(25) 25. Tremblay, D.-G. (2005a). Conciliation emploi-famille et temps de travail; Que faire pour faciliter la gestion de carrière des mères et des pères ? Canadian Journal of Counselling/Revue canadienne de counselling. Vol 39, no 2, Pp. 168-186. Tremblay, Diane-Gabrielle (2005b). Articulation emploi-famille : Les sources de difficultés et les perspectives de solution dans les secteurs de l’éducation, de la santé et des services sociaux. Revue multidisciplinaire sur l’emploi, le syndicalisme et le travail.26 pages http://www.remest.ca/documents/REMESTTremblayvol1no105.pdf. Tremblay, D.-G., Renaud Paquet et Elmustapha Najem (2005). Les âges de la vie et les aspirations en matière de temps de travail. Lien social et politique, No 54, pp. 125-134. Tremblay, Diane-Gabrielle (2004a). Conciliation emploi-famille et temps sociaux. Québec-Toulouse : Presses de l’Université du Québec et Octares. 340 p. Tremblay, D.-G. (2004b). Articulation emploi-famille et temps de travail: Les usages différenciés du temps chez les pères et les mères. Nouvelles pratiques sociales. Vol. 16 no 1. pp. 76-93. Tremblay, D.-G. (2003a). Articulation emploi-famille : Comment les pères voient-ils les choses ? Politiques sociales. Bruxelles et Madrid. Vol. 63, no 3-4. Automne 2003. Pp.70-86.. Tremblay, D.-G. (2002). Balancing Work and Family with Telework? Organizational Issues and Challenges for Women and Managers. In Women in Management. Manchester: MCB Press. Volume 17 issue 3/4. pp157-170. Vandelac, Louise ; Prévost, Johanne; Garon, Suzanne ; Méthot, Andrée-Lise ; Tissot, France et Gingras, Carole (1995). Concilier travail et maternité: une expression piégée? Dans Ré/conciliation famille-travail: Les enjeux de la recherche, sous la direction de F. Descarries et C. Corbeil. Montréal: Université du Québec. Vandelac, Louise, et Tissot, France (1999). Des congés d'abord à la charge des parents en emploi: Rapport de recherche sur les congés de maternité, de paternité, d'adoption et les congés parentaux. Montréal: Fédération des travailleurs et travailleuses du Québec..
(26)
Figure


Documents relatifs
Family work days with at least a long work day are on the contrary associated with the highest conjugal time: long work days are indeed generally quite
“culture of discipline” in macroeconomic management, that led to the implementation of restrictive rules on monetary and fiscal policy; the contemporary European “commitment to
Cultures examined after 72 h showed that the growth of this mutant on isomaltose was restored with a plasmid carrying any one of the genes, even if quantitative analysis of A 600
Previous studies have established that expression of TC10 Q75L produces numerous peripheral filopodial extensions and a re- duction in the level of stress fibers, a phenotype
In particular, distinct peptides, such as the common and atypical SSII isoforms of teleosts, that derive from paralogous genes, have received the same designation (Su et al.,
Thirty year Inter annual variability of Rainfall and NDVI showed over six selected sites in the Sahel region ((a) Burkina Faso and (b) Niger), the Sudanian Savannah region ((c)
As we are aiming at dihedral monodromy, a natural idea to prove Theorem A is to define a family of rank one logarithmic flat connections over X with infinite monodromy around D \ ∆
T he College of Family Physicians of Canada (CFPC) has endorsed the recommendation from the Section of Teachers’ Working Group on Postgraduate Curriculum Review that
![[PDF] Cours java : undo redo notions de base | Cours java](data:image/gif;base64,R0lGODlhAQABAIAAAP///wAAACH5BAEAAAAALAAAAAABAAEAAAICRAEAOw==)