Observing the Strategies Subjects Identify from Choice Data in a Repeated Prisoner's Dilemma
22
0
0
Texte intégral
(2) CIRANO Le CIRANO est un organisme sans but lucratif constitué en vertu de la Loi des compagnies du Québec. Le financement de son infrastructure et de ses activités de recherche provient des cotisations de ses organisations-membres, d’une subvention d’infrastructure du Ministère du Développement économique et régional et de la Recherche, de même que des subventions et mandats obtenus par ses équipes de recherche. CIRANO is a private non-profit organization incorporated under the Québec Companies Act. Its infrastructure and research activities are funded through fees paid by member organizations, an infrastructure grant from the Ministère du Développement économique et régional et de la Recherche, and grants and research mandates obtained by its research teams. Les partenaires du CIRANO Partenaire majeur Ministère de l'Enseignement supérieur, de la Recherche, de la Science et de la Technologie Partenaires corporatifs Autorité des marchés financiers Banque de développement du Canada Banque du Canada Banque Laurentienne du Canada Banque Nationale du Canada Banque Scotia Bell Canada BMO Groupe financier Caisse de dépôt et placement du Québec Fédération des caisses Desjardins du Québec Financière Sun Life, Québec Gaz Métro Hydro-Québec Industrie Canada Investissements PSP Ministère des Finances et de l’Économie Power Corporation du Canada Rio Tinto Alcan State Street Global Advisors Transat A.T. Ville de Montréal Partenaires universitaires École Polytechnique de Montréal École de technologie supérieure (ÉTS) HEC Montréal Institut national de la recherche scientifique (INRS) McGill University Université Concordia Université de Montréal Université de Sherbrooke Université du Québec Université du Québec à Montréal Université Laval Le CIRANO collabore avec de nombreux centres et chaires de recherche universitaires dont on peut consulter la liste sur son site web. Les cahiers de la série scientifique (CS) visent à rendre accessibles des résultats de recherche effectuée au CIRANO afin de susciter échanges et commentaires. Ces cahiers sont écrits dans le style des publications scientifiques. Les idées et les opinions émises sont sous l’unique responsabilité des auteurs et ne représentent pas nécessairement les positions du CIRANO ou de ses partenaires. This paper presents research carried out at CIRANO and aims at encouraging discussion and comment. The observations and viewpoints expressed are the sole responsibility of the authors. They do not necessarily represent positions of CIRANO or its partners.. ISSN 1198-8177. Partenaire financier.
(3) Observing the Strategies Subjects Identify from Choice Data in a Repeated Prisoner's Dilemma* Tobie Cusson †, Jim Engle-Warnick ‡. Résumé / Abstract We experimentally test the ability of subjects to identify repeated-game strategies from prisoner's dilemma choice data. In the experiments, subjects use a finite state grammar to build models to fit game histories. The histories are designed to distinguish between strategies with empirical and theoretical validity. We find that subjects successfully identify unconditional, punishment, and counting strategies. When data are observationally equivalent among different strategies, punishment strategies tend to be inferred. When inferred strategies do not fit the data, they tend to be more complex than necessary and to contain positive reciprocity and forgiveness. Our experiment provides an empirical basis for repeated-game strategies and sheds new light on play in repeated games. Mots clés : Repeated game, prisoner's dilemma, finite automata, strategies. Codes JEL: C90, C73, D03. *. We acknowledgethe the Social Science and Humanities Research Council for funding. CIRANO. ‡ Corresponding author. McGill University and CIRANO, jim.engle-warnick@mcgill.ca †.
(4) 1. Introduction. The foundations of cooperative behavior have long interested social scientists, evolutionists, and biologists. Explanations for cooperative behavior focus on individual behavior, which develops according to evolutionary selection on individuals, or prosocial behavior, which develps according to evolutionary selection in groups. (Richerson, et al., 2003). Rational choice, which assumes that individuals maximize according to their preferences, is often used to model cooperative behavior. In this paradigm, cooperation can be sustained by reputational concerns in a repeated relationship. The workhorse rational choice model for cooperation is the prisoner’s dilemma. Axelrod (1984), exploring the circumstances that permit cooperation in groups of agents playing the repeated prisoner’s dilemma, invited a group of experts to submit strategies, which he then submitted to a tournament. “Tit-for-tat”, which cooperates in the first round and then forever mimics the most recent choice of the opponent, won the tournament. Axelrod showed that “tit-for-tat” has many qualities that make it a desirable strategy in such an environment, and contributed methodologically to a large literature on the repeated prisoner’s dilemma. This bounded rationality approach has been widely utilitzed in empirical (Engle-Warnick and Slonim, 2006), computational (Axelrod, 1987; Miller, 1996), and theoretical (Rubenstein, 1986; Binmore and Samuelson, 1992) studies of repeated games. Generally these studies restrict the strategy space, which is very large in a repeated game, and note the effect of the restriction (1) on the the strategies subjects appear to use in a game, (2) on the evolution of strategies over time in the game, or (3) on the effect on equilibrium solutions. Imposing a restricted structure on strategies can help solve the game, but where do these repeated-game strategies come from? In order to formulate a strategy, an agent must be able to mentalize all possible opponent strategies and form a belief about their likelihood of being played. At the extreme, common knowledge means that all players know each others’.
(5) equilibrium strategies. Such “mind reading”, which has parallels in psychology (Singer, 2006), is far less directly tested empirically; only choices are typically observed. It is one thing to say that a subject chose a particular strategy. It is another to claim that the subject had full knowledge of her opponent’s strategy. How does one come to know opponents’ strategies? After all, when playing a game, choices are observable but strategies are not, and theory has little to say on this issue. Presumably it is necessary to be able to infer opponents’ strategies from choice data. Given a history of such inference, and a strategy choice rule, forming beliefs about opponent strategies becomes possible. However, it is safe to say that little is known about the ability of real agents to infer explicit repeated-game strategies from the choices of their opponents. In this study subjects identify repeated-game strategies from repeated prisoner’s dilemma choice data. We present the subjects with a variety of game histories, and provide them with a computer interface to draw a strategic plan that they think most likely generated the choices. The game histories are designed to distinguish between different types of well-known or “base” strategies from theory or past evidence. However, the only restriction placed on the subjects’ inference is the general form of the strategy. We provide the subjects with a finite state grammar to design their strategies. The grammar’s primitives consists of states, actions (an action is specified in each state), and transitions between states conditional on the opponent’s most recent past action. The grammar ensures that there is an initial state; that out of each states are two transitions, one for each possible opponent action (cooperate or defect); and that each transition goes to a valid state. The grammar properly applied results in a Moore Machine (Moore, 1956). Moore machines, while technically not repeated-game strategies (because they do not condition on their own behavior), have a variety of advantages for this task. First, they are behaviorally interpretable and make possible virtually any conceivable desirable deterministic strategic plan in a repeated game. Second, there is a base of economic theory designed with. 2.
(6) them. Third, The grammar itself has been found to be recognizable by experimental subjects, minimizing learning issues in the laboratory (Fitch and Hauser, 2004). Finally, the finite state grammar that defines them is applicable in many other areas including switching theory, pattern recognition, distributed systems, and linguistics. Thus the abilities for humans to recognize certain representations within the grammar may have spillover implications to other domains. We report several main results. First, all base strategies are well-recognized by the subjects, with unconditional cooperative and uncooperative strategies overwhelmingly identified. Second, in the presence of observational equivalence between harsh punishment, light punishment, and counting strategies that take an action after a specific number of rounds of play, harsh punishments are inferred the majority of the time. Third, when noise is included in the game history, none of these three strategies is inferred more often than any other, and all are inferred less often than they were in the absence of noise. Fourth, in a test between harsh and light punishments they both are inferred at roughly equal rates. When strategies are constructed that are not in the set of base strategies, they tend to overfit the data (containing more states than necessary), and to exhibit positive reciprocity and forgiveness.. 2. Experimental Design. The experimental design provides subjects a method to fit choice data with their own model of the strategy they think most likely generated the data. We provided a computer interface that permits subjects to graphically illustrate and test their model. The interface produces a primitive with a mouse click. The primitives consist of (1) a set of states, (2) a set of actions, cooperate (C) or defect (D), one of which must be taken in each state, (3) a transition for each opponent action (C or D) out of each state and into a valid state, (4) a starting state. A grammar ensures that the primitives connect together into a strategic plan that is complete.. 3.
(7) 2.1. Base Strategies. Figures 1, 2, and 3 depict the theoretical and empirically-known strategies (hereafter referred to as “base strategies”) that form the basis of our study. In the figures, states are represented by circles, the starting state is identified with a start arrow, and transitions between states are identified by arrows. The arrows labelled with the most recent opponent action, which generates the transition to the next state. Figure 1 contains conditionally and unconditionally cooperative strategies, Figure 2 contains counting strategies, and Figure 3 contains conditionally and unconditionally uncooperative strategies. For example, in Figure 1 the strategy at the top is “always cooperate”. It consists of a single state, which specifies the action cooperate, and has two transition arrows back to the same state regardless of whether the opponent plays C or D. The strategy will always cooperate regardless of opponents’ choices. In the same figure, the middle strategy is “grim”. It consists of two states. “Grim” cooperates to start the game. The starting state contains a transition back to itself if the opponent cooperates, and a transition to a defect state when the opponent defects. The defect state unconditionally transitions back to itself (i.e., an absorbing state). Thus grim begins the game cooperating; cooperates as long as the opponent cooperates; and defects forever if the opponent ever defects. “Grim’ is a finite-state version of the trigger strategy used to prove the existence of cooperative repeated-game equilibria (Fudenberg and Maskin, 1986). It is the harshest possible punishment for defection. The bottom strategy in Figure 1 is the empirically relevant “tit-for-tat” (Axelrod, 1984). It cooperates initially, and then always mimics the opponent’s most recent action.. Figure 1: Cooperate, Tit for Tat, and Grim Trigger Strategies. 4.
(8) C. start. 1:C. D. C,D. C D start. 1:C. 2:D. C. D D. start. 1:C. 2:D C. Figure 2 depicts the counting strategies. Top strategy in the figure cooperates three times and then defects forever (“count three”). The bottom strategy cooperates four times before defecting (“count four”). Finally, Figure 3 depicts the uncooperative strategies. The top strategy in this figure is identical to “tit-for-tat” except that it defects in its starting state (“defect tit-for-tat”). The bottom strategy is “always defect”, which differs from “always cooperate” only by the action specified in its lone state.. 5.
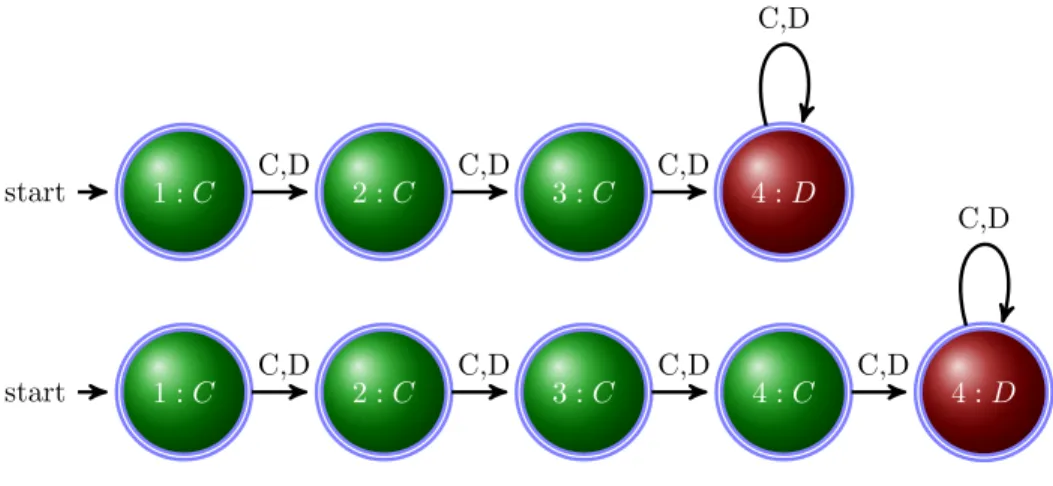
(9) Figure 2: Counting Strategies: Count Three and Count Four C,D. C,D start. 1:C. C,D 2:C. C,D start. 1:C. C,D 3:C. C,D 2:C. 4:D. C,D. C,D. C,D. 3:C. 4:C. 4:D. Figure 3: Defect Tit for Tat, and Always Defect Strategies D. C C. start. 1:D. 2:C D. C,D. start. 2.2. 1:D. Game Histories. We constructed nine game histories to test subjects’ abilities to identify the seven base strategies from choice data, and to test which strategies are more salient when game histories are observationally equivalent with respect to two or more strategies. We selected these particular strategies for our study because they are either an important basis of theory (such as 6.
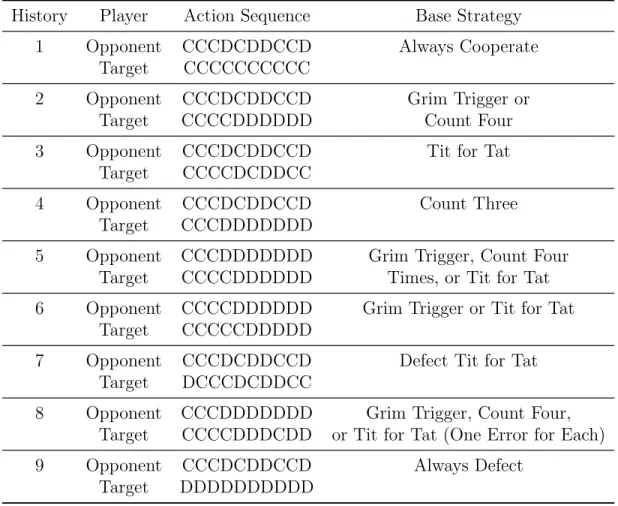
(10) “grim”), have been identified empirically (“tit-for-tat” and the counting strategies), or represent fundamental unconditional altruistic or self-interested behavior (“always cooperate” and“always defect”). We presented subjects with nine different sequences of two-player 10-round repeated prisoner’s dilemma game histories. Table 1 shows the histories presented to the subjects. The table is divided into nine horizontal sections, one for each history. Each history contains two sequences of actions: one for “opponent” and one for “target”. For example, in History 1, “opponent” made choices (C for cooperate, D for defect) CCCDCDDCCD in the ten rounds of the game, while the “target” chose C in all ten rounds. The task was to design a strategy that most likely generated the choices of “target”. The right-hand column in Table 1 contains the base strategies that fit the target’s actions. For example, in History 1, the lone strategy of the seven base strategies that fits the target’s actions is “always cooperate”, i.e., cooperate every period unconditionally. The remaining eight histories are read the same way. We designed the game history sequences to test whether subjects would identify strategies expected from either theory or past empirical evidence. Several sequences est whether any of these expected strategies are more salient than the others through observational equivalence with respect to two or more strategies. Referring back to Table 1, History 1 is a test of recognizing a history generated by “always cooperate”. This strategy can be interpreted as an altruistic strategy, as well as a naive one. History 2 tests whether subjects are more likely to recognize “grim”, which is a permanent, harsh punishment, or “count 4”, which is either a limit on the willingness to cooperate, or possibly an opportunistic strategy that entices the opponent to cooperate before defecting. History 3 is a straight test of the ability to recognize “tit-for-tat”, which is the well-known strategy in the Axelrod tournament. History 4 is a test of the identification of “count 3”: if the subjects do not choose a counting strategy over the punishment strategies in the joint test, we still would like to know. 7.
(11) Table 1: Game Histories History. Player. Action Sequence. Base Strategy. 1. Opponent Target. CCCDCDDCCD CCCCCCCCCC. Always Cooperate. 2. Opponent Target. CCCDCDDCCD CCCCDDDDDD. Grim Trigger or Count Four. 3. Opponent Target. CCCDCDDCCD CCCCDCDDCC. Tit for Tat. 4. Opponent Target. CCCDCDDCCD CCCDDDDDDD. Count Three. 5. Opponent Target. CCCDDDDDDD CCCCDDDDDD. Grim Trigger, Count Four Times, or Tit for Tat. 6. Opponent Target. CCCCDDDDDD CCCCCDDDDD. Grim Trigger or Tit for Tat. 7. Opponent Target. CCCDCDDCCD DCCCDCDDCC. Defect Tit for Tat. 8. Opponent Target. CCCDDDDDDD CCCCDDDCDD. Grim Trigger, Count Four, or Tit for Tat (One Error for Each). 9. Opponent Target. CCCDCDDCCD DDDDDDDDDD. Always Defect. if they can recognize a counting strategy by itself. History 5 tests between “grim” (harsh punishment), “tit-for-tat” (light punishment) or “count 4” (no punishment). History 6 distinguishes between “grim” and “tit-for-tat”, with the counting strategy excluded, making it a test of the harshness of the strategy inferred. History 7 tests whether subjects can recognize “tit-for-tat” when it begins with defect rather than cooperate. In History 8, “grim”, “tit-for-tat” and “count 4” all fit the sequence equally well, but they all make one prediction error. A large literature exists detailing the effect of imperfect private monitoring on equlibria in repeated games (Kandori, 2002), and in particular finite automata are used to prove existence in the prisoner’s dilemma (Ely and Valimaki, 2003). Intuitively we might infer a less harsh punishment in the presence of noise, since a defect 8.
(12) signal might not really be a defection. History 9 ends the experiment with a sequence most simply explained by “always defect”, a self-interested strategy.. 3. Experimental Procedures. This experiment utilized a computer interface for drawing finite state machines. The screen displayed the current game history to be fit and a pallette upon which to construct a machine to fit the target data. Subjects pointed and clicked on the pallette to create a state, and dragged arrows between states for state transitions. Subjects added labels to transition arrows by selecting from a pull-down menu on the arrow. The software allowed the subjects to test whether the machine was complete (i.e., if it could generate a decision for any game history), and to test how well it fit the data. Subjects were permitted to test the machine as many times as they wished before submitting their final machine. Before participating in the data fitting exercise, subjects were required to pass a test in which they successfully designed a complete five-state machine. Note that five states were the maximum allowed by the software. We enforced this restriction because a Moore machine can perfectly fit data simply by constructing one state for each round, mimicking the action taken each round in its corresponding state, and transitioning unconditionally sequentially through the machine. The five-state restriction forces subjects to think about conditioning behavior rather than simple pattern replication. Subjects were paid $2 in cash for each round of data in the sequence their machine fit, with one sequence randomly chosen for pay. They were paid an extra $5 if their machine exactly matched the machine of another subject in the room. This additional coordination incentive forced the subjects to trade off salience for complexity when designing their machines (Mehta, Starmer and Sugden, 1992). Forty-six subjects participated in the experiment earning an average of approximately $31 for participating in the two-hour sessions, including a $10. 9.
(13) show-up fee.. 4. Experimental Results. 4.1. Base Strategies. Table 2 presents an overview of the number of times a base strategy was reported for each game history. The rows of the table represent each of the nine game history sequences, and the columns represent the base strategies. The cells of the table present the number of strategies in the data that match a base strategy. Entries in blue correspond to a base strategy that perfectly fit the target actions. For example, “always cooperate” was constructed forty times in the data to fit target actions in History 1, and it fits the data perfectly. “Always defect” was submitted 1 time for History 4, but it does not perfectly fit the data. Table 2: Base Strategy Reporting Counts History 1 2 3 4 5 6 7 8 9. Always Always Grim Cooperate Defect Trigger 40 1 5 1 1 2 0 1 0. 0 0 0 1 1 0 0 0 39. 0 23 0 12 21 18 0 7 0. Tit-for-Tat. Count (3 or 4). Defect Tit-for-Tat. 1 1 23 1 11 12 1 6 0. 0 4 0 17 1 0 0 0 0. 0 2 0 0 1 0 24 0 0. Beginning with the histories for which a single base strategy perfectly fit the data (recall that Table 1 presents the histories and corresponding base strategies), subjects were successful with the simplest game histories: Table 2 shows that 40 out of 46 strategies submitted were “always cooperate” in History 1, while similarly, “always defect” was submitted 39 out. 10.
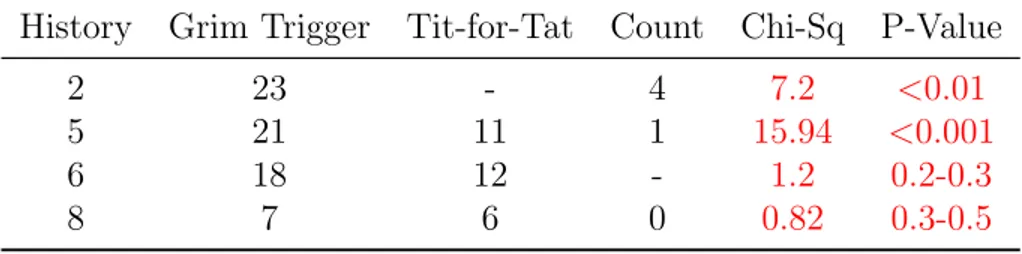
(14) of 46 times for History 9. History 3 tested for “tit-for-tat”: 23 subjects correctly identified this strategy in the data. “Count three”’ was inferred 17 times in History 4, and “defect tit-for-tat” was submitted 24 times for History 7. Apparently subjects can identify the more complex strategies from data roughly equally well, with the counting strategy possibly being a bit more difficult to identify than the one-state and conditional strategies. Turning our attention now to histories that tested multiple strategies, in a test between “grim” and “count four” (History 2), “grim” was submitted more often by a count of 23 times to 4. For History 3, 23 of the subjects constructed “tit-for-tat”, while 17 identified “count three”. Thus when given a choice between the harsh punishment and the counting strategy, the punishment dominates subjects’ identification, but this is not the case when the punishment is not harsh. History 5 is the test between three types of strategies: a harsh punishment, a light punishment, and a counting strategy. Here, “grim” occurs twice as often as “tit-for-tat”, and count occurs far less often than either. In a horse race between “grim” and “tit-for-tat” (History 6), “grim” was inferred 18 times to 12; neither appears to dominate the other when they are the only two perfectly fitting strategies. Finally, History 8 tested whether subjects would infer one of three strategies allowing for a less than perfect fit; in this case, “grim” and “tit-for-tat” were submitted 7 and 6 times respectively; apparently subjects worked to perfectly fit the data, but among those who allowed for a noisy error, neither strategy was inferred at a higher rate than the other. Table 3 presents the counts and chi-square test results for the sequences that admitted more than one strategy. The rows, again, represent game histories while the the middle columns present counts for each of the three types of base strategies. The right-most two columns of the table present results from a chi-square test, which has as its null hypothesis that there is no statistical difference in frequency between the different base strategies. The table reveals two statistically significant results. First, “grim” is identified significantly more often than “count four”. Second, when “tit-for-tat” is added to these two. 11.
(15) Table 3: Testing for Uniform Distribution across Base Strategies History. Grim Trigger. Tit-for-Tat. Count. Chi-Sq. P-Value. 2 5 6 8. 23 21 18 7. 11 12 6. 4 1 0. 7.2 15.94 1.2 0.82. <0.01 <0.001 0.2-0.3 0.3-0.5. strategies, “grim” is still inferred most often. Finally, when only “grim” and “tit-for-tat” are relevant, we cannot conclude one is statistically dominant over the other. And these two strategies are also equally chosen (though less often) with a small amount of noise in the data, while the counting strategy is never chosen to fit noisy data.. 4.2. Non-base Strategies. In this section we describe reported strategies that did not come from the strategy set we had in mind for generating the game histories (hereafter referred to as “non-base” strategies). 4.2.1. Strategy Component Properties. The average properties of the non-base strategies are displayed in Table 4 by history. The two components, from left to right at the top of the table, are actions and number of machine states. Average machine actions are presented by computing the propotion of states in each machine that contain either cooperate or defect, and then averaging the proportion over all non-base machines reported for the history. The number of states in the machine in its minimal state representation and in the representation submitted by the subjects (machines can contain redundant states) is reported immediately to the right of the actions. Note that the number of states in a machine can be a crude proxy of its complexity (Kalai annd Stanford, 1988). The right-most column in the table notes the number of non-base strategies submitted for each game history.. 12.
(16) The table reveals that, in game histories 1-7, there were on average more cooperate than defect states in the machines. Only when the target history consisted of nothing but defect (History 9), and when the history was noisy (History 8) did the machines consist of more defect than cooperate states. Perhaps the most interesting statistic in the table concerns the number of states of these non-base strategies: the history that induced the maximum number of states was History 8, i.e., the noisy history. This suggests that these machines were designed to over-fit the data. Further evidence of attempts to overfit can be found simply in the average number of minimal state machines for every history: not a single machine was smaller than 2.856 minimal states on average, despite the fact that most of the histories can be fit with one or two state machines. Table 4: Properties of Non-base Strategies by Sequence History. 4.2.2. Action Cooperate Defect. # of States # of Strategies Minimal Reachable Observed. 1 2 3 4 5 6 7 8 9. 0.594 0.598 0.714 0.558 0.576 0.671 0.505 0.447 0.414. 0.406 0.402 0.269 0.442 0.424 0.329 0.495 0.554 0.586. 3.167 2.947 3.391 2.656 2.769 3 3.318 3.97 2.856. 3.167 3.211 3.609 2.9 3.154 3.313 3.364 4.152 2.856. 6 19 23 29 13 16 22 33 7. Random. 0.501. 0.499. 3.380. 3.950. 87000. Strategy Component Behaviors. The average proportion of behaviors occurring across the non-base machines is displayed in Tables 5 and 6. These statistics are computed precisely the same way as average actions were computed in the previous table. From left to right across the table the behaviors of reciprocity, anti-reciprocity, unconditional transitions, and absorbing transitions are repre13.
(17) sented. Reciprocity consists of positive reciprocity (responding to cooperate with cooperate) and negative reciprocity (responding to defect with defect). This behavior has been well documented and a subject of much behavioral economics research.1 Anti-reciprocal behavior consists of forgiveness (responding to defect with cooperate) and betrayal (responding to cooperate with defect). Thus anti-reciprocal behavior can be either pro- or anti-social. Unconditional behavior tranisitions from a state unconditionally to cooperate or defect. Such transitions could suggest counting. And absorbing states, which can specifiy either cooperate or defect, transition always to themselves. A defect absorbing state could indicate a harsh punishment, while a cooperative absorbing state indicates the willingness (indeed the commitment) to cooperate unconditionally forever. Punishment, for which evidence can be found in both negative reciprocity and absorbing states that play defect, has been observed in public goods games (which are multi-player prisoner’s dilemmas), thus it seems possible that this behavior is known to the subjects (de Quervain et al., 2004). A striking result in the table is the fact that there is more positive than negative reciprocity on average for every history except History 9 (i.e., the history with every action defect) in the non-base strategies; this difference is statistically significant at least at the 10% level in Histories 1, 3, 4 and 6. Perhaps relatedly, the same is true for forgiveness. Note that both forgiveness and betrayal occur in meaningful levels in nearly every history. And whenever there is a statistically significant difference between the occurance of forgiveness and betrayal (Histories 3, 4, and 6), forgiveness always occurs more often than betrayal. While positive reciprocity does exist in many predicted strategies, neither forgiveness nor betrayal was meant to be induced by the game histories. Apparently subjects see and are able to report these pro-social behaviors in nearly every history. While positive reciprocity and forgiveness tend to dominate their behavioral counterparts 1. Rabin (1993) notes that people like to help those who help them, and hurt those who hurt them, and Fehr et al. (1997) provide a classic illustration of the effect of reciprocity on contract peformance.. 14.
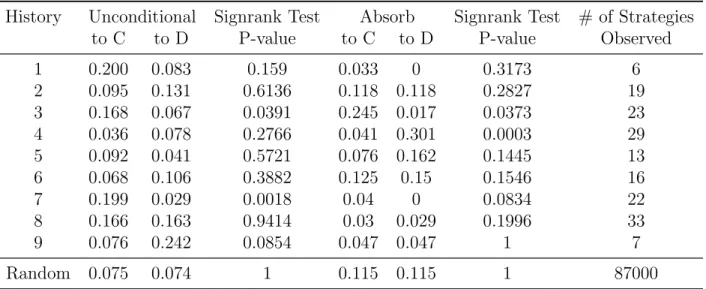
(18) History. Table 5: Behaviours of Non-base Strategies by History Reciprocity Signrank Test Non-reciprocal Signrank Test + P-value Forgive Betray P-value. # of Strategies Observed. 1 2 3 4 5 6 7 8 9. 0.477 0.392 0.331 0.427 0.448 0.497 0.55 0.487 0.119. 0.322 0.369 0.218 0.34 0.351 0.277 0.478 0.463 0.195. 0.0874 0.6519 0.005 0.0483 0.2816 0.0032 0.2655 0.5509 0.1585. 0.361 0.192 0.257 0.201 0.275 0.272 0.251 0.147 0.39. 0.205 0.143 0.161 0.114 0.178 0.052 0.179 0.123 0.466. 0.0874 0.3343 0.0187 0.0497 0.2644 0.003 0.2508 0.5509 0.1585. 6 19 23 29 13 16 22 33 7. Random. 0.310. 0.309. 1. 0.311. 0.310. 1. 87000. Table 6: Behaviours of Non-base Strategies by History (continued) History. Unconditional to C to D. Signrank Test P-value. Absorb to C to D. Signrank Test P-value. # of Strategies Observed. 1 2 3 4 5 6 7 8 9. 0.200 0.095 0.168 0.036 0.092 0.068 0.199 0.166 0.076. 0.083 0.131 0.067 0.078 0.041 0.106 0.029 0.163 0.242. 0.159 0.6136 0.0391 0.2766 0.5721 0.3882 0.0018 0.9414 0.0854. 0.033 0.118 0.245 0.041 0.076 0.125 0.04 0.03 0.047. 0 0.118 0.017 0.301 0.162 0.15 0 0.029 0.047. 0.3173 0.2827 0.0373 0.0003 0.1445 0.1546 0.0834 0.1996 1. 6 19 23 29 13 16 22 33 7. Random. 0.075. 0.074. 1. 0.115. 0.115. 1. 87000. nearly across the board, we see no such pattern with regard to unconditional and absorbing behavior. Table 6 shows no obvious dominance or pattern of unconditional transitions to cooperate vs. defect, and the same is true of the absorbing states. Statistically significant results fail to reveal any pattern of induced behaviors by the different histories as well. The clearest result from Table 6 is that Histories 1 and 7 and the noisy History 8 rarely induce absorbing states in the reported non-base strategies.. 15.
(19) In summary: behavior conditional on opponent’s action is consistently reported in the non-base strategies. In particular, positive reciprocity and forgiveness occur systematically more often than negative reciprocity and betrayal, results that are consistent with a long line of experimental results. Unconditional and absorbing behavior are reported in a less systematic, noisier manner.. 5. Conclusions. Our experiment makes possible the graphical design of computational models to fit experimental choice data. It makes observable the strategies subjects beleive are likely to have generated choice data. It provides a foundation for the empirical validity of these strategies. There are several results to summarize. First, all base strategies are well-recognized by the subjects on their own (Histories 1, 3, 4, 7, and 9), with unconditional cooperative and uncooperative strategies overwhelmingly identified. Second, in the presence of observational equivalence between harsh punishment, light punishment, and counting, harsh punishments are inferred the majority of the time (History 5). Third, when noise is included in the game histories, none of these three strategies is inferred more often than any other, and all are inferred less often (History 8). Fourth, in a test beetween harsh and light punishments, both are inferred at roughly equal rates (History 6). With regard to strategies that were constructed that do not comform to past theory or empirical evidence, several interesting regularities apply. First, the minimal state representations of these strategies suggest that they are more complex than necessary to fit the data, and overfitting seems likely in History 8 with noise. Second, cooperative states dominate defect states except with noise or when the best fitting strategy is always defect. Third, positive reciprocity and forgiveness occur systematically more often than negative reciprocity and betrayal. Fourth, while conditional transitons showed clear patterns, un-. 16.
(20) conditional transtions did not: they are equally likely transitioning to cooperate or defect states.. 17.
(21) References Axelrod, R. (1984). “The Evolution of Cooperation”. Basic Books. Binmore, K. and L. Samuelson (1992). “Evolutionary Stability in Repeated Games Played by Finite Automata”. Journal of Economic Theory 57:278-305. de Quervain, D., U. Fischbacher, V. Treyer, M. Schellhammer, U. Schnyder, A. Buck, and E. Fehr (2004). “The Neural Basis of Altruistic Punishment”, Science 305:5688:12541258. Ely, J. and J. Valimaki (2003). “A Robust Folk Theorem for the Prisoner’s Dilemma”. Journal of Economic Theory 102:84-105. Engle-Warnick, J. and R. Slonim (2006). “Inferring Repeated-Game Strategies from Actions: Evidence from Trust Game Experiments”. Economic Theory 28:603-632. Fehr, E., S. Gachter, and G. Kirchsteiger (1997). “Reciprocity as a Contract Enforcing Device: Experimental Evidence”, Econometrica 65:833-860. Fitch, W. and D. Hauser (2004). “Compuational Constraints on Syntactic Processin in a Nonhuman Primate”. Science 303, 377-380. Fudenberg, D. and E. Maskin (1986). “The Folk Theorem in Repeated Games with Discounting or with Incomplete Information”. Econometrica 54:3:533-554. Holland, J. (1992). “Genetic Algorithms”. Scientific American July, 1992: 44-50. Kalai, E. and W. Stanford (1988). “Finite Rationality and Interpersonal Complexity in Repeated Games”. Econometrica 56:397-410. Kandori, M. (2002). “Introduction to Repeated Games with Private Monitoring”. Journal of Economic Theory 102:1-15. Mehta, J., C. Starmer, and R. Sugden (1992). “The nature of salience: an experimental investigation of pure coordination games”, American Economic Review 84, 658-673. Miller, J. (1996). “The Coevolution of Automata in the Repeated Prisoner’s Dilemma Game”. Journal of Economic Behavior and Organization 29: 87-112. Moore, E. F. (1956). “Gedanken-experiments on Sequential Machines”. Autonoma Studies, Annals of Mathematical Studies 34:129-153. Rabin, M. (1993). “Incorporating Fairness into Game Theory and Economics”. American Economic Review 83:1281-1302.. 18.
(22) Richerson, P., R. Boyd, and J. Henrich (2003). “Cultural Evolution of Human Cooperation”, in P. Hammerstein, ed. Genetic and Cultural Evolution of Cooperation, MIT Press. Rubenstein, A. (1986). “Finite Automata in the Repeated Prisoner’s Dilemma”. Journal of Economic Theory 39:83-96. Singer, T. (2006). “The Neuronal Basis and Onogeny of Empathy and Mind Reading: Review of Literature and Implications for Further Research”. Biobehavioral Review 30:855-863.. 19.
(23)
Figure


+4

Documents relatifs
Complete classes of strategies for the classical iterated prisoner’s dilemma. The effect of memory size on the evolutionary stability of strategies in iterated
A parameter denoted p’ is identified and interpreted; It is correlated with the success of the strategies and seems therefore to provide an efficient cri- terion for predicting
The objective of the ATReC (Atlantic THORPEX Regional Campaign) was to test the hypothesis that short term forecast errors over Europe and the Eastern seaboard of the USA can be
Dans cette thèse, le dimensionnement, le contrôle et la gestion d'énergie optimale de Microgrid sont proposées dans les deux modes: mode îloté et mode connecté au réseau..
That is, we provide a recursive formula for the values of the dual games, from which we deduce the computation of explicit optimal strategies for the players in the repeated game
A simulation study of NH listeners measured syllable recognition in a noisy environment, using both Fixed-Channel and Channel-Picking coding schemes. The results were also compared
Within the harmonic approxi- mation the potential energy surface has a simple analytical form, so with this model, it is possible to directly separate the contributions of the
We have generated the radical cation of cyclobutenedione, 1 •+ , by X-irradiation of an Ar matrix containing 1, and observed its spontaneous decay to the radical cation of bisketene
