HAL Id: hal-01185075
https://hal.archives-ouvertes.fr/hal-01185075
Submitted on 19 Aug 2015
HAL is a multi-disciplinary open access
archive for the deposit and dissemination of
sci-entific research documents, whether they are
pub-lished or not. The documents may come from
teaching and research institutions in France or
abroad, or from public or private research centers.
L’archive ouverte pluridisciplinaire HAL, est
destinée au dépôt et à la diffusion de documents
scientifiques de niveau recherche, publiés ou non,
émanant des établissements d’enseignement et de
recherche français ou étrangers, des laboratoires
publics ou privés.
YouTube Live and Twitch: A Tour of User-Generated
Live Streaming Systems
Karine Pires, Gwendal Simon
To cite this version:
Karine Pires, Gwendal Simon. YouTube Live and Twitch: A Tour of User-Generated Live Streaming
Systems. MMSys 2015 : 6th ACM Multimedia Systems Conference, Mar 2015, Portland, United
States. pp.225 - 230. �hal-01185075�
YouTube Live and Twitch: A Tour of User-Generated Live
Streaming Systems
Karine Pires
Telecom Bretagne Francekarine.pires@telecom-bretagne.eu
Gwendal Simon
Telecom Bretagne Francegwendal.simon@telecom-bretagne.eu
ABSTRACT
User-Generated live video streaming systems are services that allow anybody to broadcast a video stream over the Internet. These Over-The-Top services have recently gained popularity, in particular with e-sport, and can now be seen as competitors of the traditional cable TV. In this paper, we present a dataset for further works on these systems. This dataset contains data on the two main user-generated live streaming systems: Twitch and the live service of YouTube. We got three months of traces of these services from January to April 2014. Our dataset includes, at every five minutes, the identifier of the online broadcaster, the number of people watching the stream, and various other media information. In this paper, we introduce the dataset and we make a pre-liminary study to show the size of the dataset and its poten-tials. We first show that both systems generate a significant traffic with frequent peaks at more than 1 Tbps. Thanks to more than a million unique uploaders, Twitch is in par-ticular able to offer a rich service at anytime. Our second main observation is that the popularity of these channels is more heterogeneous than what have been observed in other services gathering user-generated content.
Keywords
Live streaming; popularity analysis; user-generated content
Categories and Subject Descriptors
C.2.3 [Computer-Communication Networks]: Network Operations—Network monitoring ; C.4 [Performance of Systems]: Design studies; Measurement techniques;
1.
INTRODUCTION
Anybody can become a TV provider. This promise has been floating in the air for almost ten years but the popular-ity of User Generated Content (UGC) live streaming aggre-gators has however not grown as fast as some expected. Yet, the last couple of years has seen a surge of interest for UGC Permission to make digital or hard copies of all or part of this work for personal or classroom use is granted without fee provided that copies are not made or distributed for profit or commercial advantage and that copies bear this notice and the full cita-tion on the first page. Copyrights for components of this work owned by others than ACM must be honored. Abstracting with credit is permitted. To copy otherwise, or re-publish, to post on servers or to redistribute to lists, requires prior specific permission and/or a fee. Request permissions from Permissions@acm.org.
MMSys’15,March 18 - 20 2015, Portland, OR, USA. Copyright 2015 ACM 978-1-4503-3351-1/15/03 ...$15.00. http://dx.doi.org/10.1145/2713168.2713195.
live streaming services, epitomized by the release of the live version of YouTube [19]. In the meantime, the leader in this sector, namely Twitch [11], has identified a promising niche: gamecasting and video game competition (also known as e-sport ). The market of e-sport has been boosted by the rise of online live streaming platforms [5]. Every month in 2013, around one million gamers have broadcasted them-selves playing games live, and more than 40 millions of peo-ple have watched these gameplay video channels [6]. With this popularity, Twitch became the fourth largest source of US peak Internet traffic in February 2014 [8].
Even if YouTube Live does not specifically focus on e-sport, the services that are today offered by both Twitch and YouTube share a lot of similarities. We distinguish up-loaders and viewers. The upup-loaders are registered users, who are in charge of one channel. We will interchangeably use the terms channel and uploader hereafter. A channel can be either online at a given time, which means that the up-loader is broadcasting a live video, or offline when the user in charge is not uploading video on this channel. A chan-nel can alternatively switch from offline to online and vice versa. When a channel is online, we say that it corresponds to a session. The number of viewers watching a session can change over the time of the session. Between consecutive sessions, we will speak of inter-session time. We illustrate in Figure 1 the evolution of the popularity of one given chan-nel over time, this chanchan-nel containing two sessions.
online
online
nb. of viewers
time t1 t01 t2 t02
session 1 session 2 Figure 1: A life in a channel
In this paper, we present a dataset for three months of traces of both Twitch and YouTube, from January, 6th 2014 to April, 6th, 2014. Our dataset can provide the basis for multiple research either on live streaming systems, or on the specific case of live e-sport. The dataset, containing more than five millions sessions, is available on a public website.1 The main contribution of this paper is thus the overall de-scription of this dataset in Section 2.
We will then show some preliminary studies on this dataset. Our goal is to depict the size of these live streaming sys-tems. These services are still frequently under-estimated, epitomized by the lack of studies in the academic world. We provide here the “status” of these systems, including the number of channels, the number of viewers and the evolution of these numbers over time. We highlight among other find-ings that Twitch and YouTube experience frequent traffic peaks at more than 1 Tbps. We also go deeper by studying whether these services are really 24/7. Finally, we study the popularity of channels. We confirm that, as often in UGC services, channel popularity follows a Zipf law. More inter-estingly, we highlight that the popularity of channels is one of the most heterogeneous among UGC services.
2.
DATASET
2.1
Data Retrieval
Both Twitch and YouTube provides a REST API that al-lows anybody to fetch information about the state of the sys-tem at anytime. We used a set of synchronized computers, which allowed us to obtain a global view of the system every five minutes.2 We fetched information about the global
pop-ularity (the total number of viewers in the system), the total number of concurrent sessions, the session popularity (the number of viewers by session) and some channels metadata. Note also that the YouTube API does not contain as many fields as the Twitch one. We summarized in Table 1 the information that we fetched from both API.
Twitch YouTube channel id yes yes
session id yes yes nb. of viewers yes yes video bitrate yes no video resolution yes no uploader country yes no Table 1: Summary of the API information
We used various database tools and programing languages to store, access and parse the data, including PHP, Python, R, SQLite and MySQL. The data as well as the parsing scripts are available on the public website.1
2.2
Filtering Out the Actual Uploaders
We observed in our measurements that a significant num-ber of channels were typical from an uploader who tests the service. We identified two main behaviors. The first one is an uploader who launched a channel for only one session with a duration less than ten minutes overall in the three months, referenced as “10 min. channels” in Table 2. In
1T
http://dash.ipv6.enstb.fr/dataset/live-sessions/
2
this delay of 5 minutes is imposed by Twitch API.
other words, we have only one occurrence of this channel over the whole set of traces. The second type of “tester” is the one whose channel has remained with no viewer at all during the three months, identified as “no viewers” in Table 2. Twitch YouTube total nb. of channels 1,536,492 236,957 total nb. of sessions 6,242,609 737,233 10 min. channels 25% 27% no viewers 11% 40% filtered nb. of channels 1,068,138 (69%) 120,097 (51%) filtered nb. of sessions 5,221,208 (83%) 527,677 (71%)
Table 2: Filtering testers from the traces
As shown in Table 2, testers represent a significant part of both Twitch and YouTube uploaders with almost half of the registered users. These testers impact the transcoding infrastructure of the services but they harm the delivery infrastructure only on the uplink since no viewers request these channels.
In the following, we discarded the testers from our mea-surements in order to keep attention on the actual uploaders. Nonetheless, the ability of UGC live streaming systems to prevent testers to harm the service, especially at activity peaks, is a concern that deserves further studies.
3.
STATUS OF TWITCH AND YOUTUBE
3.1
How Big are the Systems?
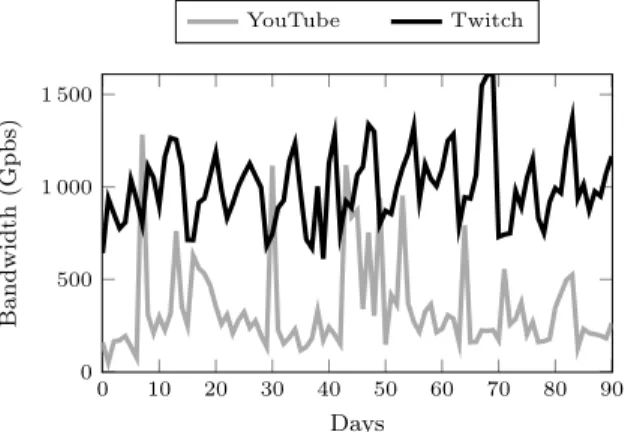
We first evaluate the overall bandwidth used by each of the systems. We considered they both are regular Over-The-Top (OTT) services with unicast transmission to viewers, so we sum up the bitrates of each session multiplied by the number of viewers for this session. In the case of YouTube, where the bitrates are not available, we choose the value of 2 Mbps for bitrate of all channels. To decide this value, we simply observe that the average bit-rate of sessions in Twitch is around 2 Mbps on most of our snapshot.
0 10 20 30 40 50 60 70 80 90 0 500 1 000 1 500 Days Ban dwi dth (Gpb s) YouTube Twitch
Figure 2: Bandwidth usage for live video delivery We see in Figure 2 that both services experience peaks of bandwidth of more than 1 Tbps. On Twitch we detect that peaks near and over 1 Tbps are frequent with an overall peak at more than 1.6 Tbps. Such a volume of bandwidth matters for the live streaming services themselves, of course,
0 10 20 30 40 50 60 70 80 90 0 2 000 4 000 6 000 Days N b. o f C han nels YouTube Twitch
Figure 3: Number of simultaneous online channels
0 10 20 30 40 50 60 70 80 0 200 000 400 000 600 000 800 000 Days Ch ann els YouTube Twitch
Figure 4: Cumulative number of unique channels
but also for ISP and operators, which need to deliver this huge amount of information to end users. We remind the reader that this content is live, and therefore can not be pre-fetched or cached.
The number of simultaneously online channels is a key statistics of the “liveness” of these services because it rep-resents the offer at a given time. We show in Figure 5 the number of concurrent sessions. While YouTube ranges from 300 to 700 channels, Twitch counts with one order of mag-nitude more, with always more than 6,000 channels. Note that YouTube is still in its infancy, and the number of con-current channels is growing, but the release of YouTube had no impact on Twitch, which somehow confirms that Twitch targets a different population related to gaming.
To end this first set of data analysis, we focus on the num-ber of different channels that we have seen over the three months. It is another key statistics of the liveness of the services because it indicates the size of the population of uploaders. We represent in Figure 4 the evolution over time of the total number of different channels found (unique chan-nel ids). As can be inferred from previous results, Twitch have far more unique channels than YouTube.
3.2
Are they 24/7 Services?
We have to recall that live video streaming essentially dif-fers from other UGC services like Video on Demand (VoD) in the sense that the service depends on the activity of up-loaders at every moment in time. Fortunately, we will show that both services have loyal uploaders, who manage to be more consistently active (here online) than on other typical UGC platforms. It thus guarantees service continuity.
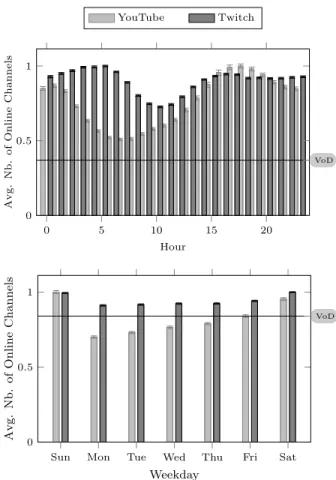
We measured the number of simultaneous online channels over the collected data. We then computed the average
num-0 5 10 15 20 0 0.5 1 VoD Hour Av g. N b . o f O n li n e Ch a n n e ls YouTube Twitch
Sun Mon Tue Wed Thu Fri Sat 0 0.5 1 VoD Weekday A v g. N b. o f O nlin e Cha nne ls
Figure 5: Average number and confidence interval of simul-taneous online channels by hour and weekday
bers per hour of a day (respectively per day of the week). With these values we are able to measure diurnal (respec-tively weekly) patterns. We show our results in Figure 5. In both figures, we normalize the results so that the peak of the number of online channels is equal to 1.
Our first observation is that Twitch is less sensitive to both diurnal and weekly patterns than YouTube. For the weekdays, the difference between the lowest number of on-line channels (0.9) and the peak (1) is not significant on Twitch (we note it 0.90 : 1). At least two explanations can be advanced. First the uploaders come from a wider number of countries spanning the whole planet, because the service is older. The release of YouTube live service was in 2013, and the full availability was in late December. Second, the fact that many Twitch channels are related to e-sport can have an impact too. Indeed, e-sport is especially popular in Asia. Since both Twitch and YouTube are already pop-ular in Europe and America, all continents are covered by engaged uploaders.
We now compare the patterns globally. The main point to notice in Figure 5 is that the diurnal pattern is weaker than what has been observed on other UGC platforms. We indicate with a horizontal line the lowest number of new uploaded videos as it was measured for the YouTube VoD service (discussed in [3] and [4]). The diurnal difference on Twitch is 0.65 : 1 although it is as low as 0.37 : 1 on YouTube VoD.
3.3
What is the Zipf in UGC Live Streaming?
The distribution of popularity found on UGC systems and VoD typically follows the Zipf’s law. We first need to check on our traces whether live videos follow it as well. We pro-duced an approximation of the Zipf parameters using a fit-ting curve process on the R software. We validate the results of the approximation by calculating the Normalized Root-Mean-Square Deviation (NRMSD) between the real data and the fitted curve. The mean NRMSD value obtained for YouTube was 0.0365 and the 95% confidence interval between 0.0362 and 0.0368, meaning less than 4% error in our fittings. For Twitch NRMSD value obtained was 0.0095 with confidence intervals of 0.0094 and 0.0096, i.e. less than 1% error.
We then analyzed the value of the α parameter, which ba-sically says how much heterogeneous is the popularity. The larger is α, the more heterogeneous is the service. Figure 6 shows the results obtained for the Zipf α coefficient. The horizontal line indicates the value found on classic VoD [9].
0 10 20 30 40 50 60 70 80 0 1 2 VoD Days Zip f α co e fficie n t YouTube Twitch
Figure 6: Zipf α coefficient evolution over time Figure 6 reveals an interesting point: YouTube channels popularity are very heterogeneous and peak hours have a big influence on it. While other UGC services ranges from 0.5 to 2 and often less than one, the Zipf α coefficient for YouTube is frequently over 2, characterizing a sharper dif-ference between channel popularity and a shorter tail. Al-though Twitch has also a high coefficient value (over 1), the α parameter is more constant over time. This result confirms again the maturity of Twitch system, with a larger range of channels and a more constant popularity distribution. Also, we must recall that uploaders are less affected by day light patterns on Twitch, which increases the homogeneity of the popularity distribution.
4.
DATASET USAGE
This dataset with live sessions of two real service providers can be used to evaluate different challenges induced by large-scale live streaming systems. Any scientist can re-create the live systems load by replaying the live sessions as input of an evaluation scenario. Furthermore results produced with this dataset are consistent with real data traces, which con-tributes to more credibility on the work. An interesting property of this dataset is that both services have different properties and studies based on them can comply with dif-ferent scenarios, possibly avoiding bias due to the traces.
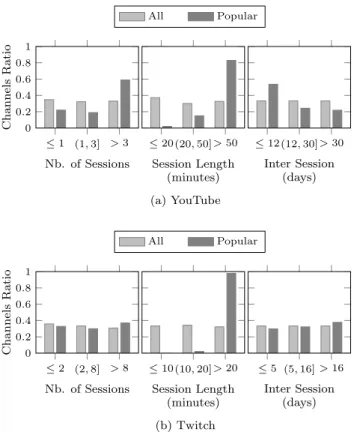
≤ 1 (1, 3] > 3 0 0.2 0.4 0.6 0.8 1 Nb. of Sessions Ch ann els R atio All Popular ≤ 20 (20, 50] > 50 Session Length (minutes) ≤ 12 (12, 30] > 30 Inter Session (days) (a) YouTube ≤ 2 (2, 8] > 8 0 0.2 0.4 0.6 0.8 1 Nb. of Sessions Ch ann els R atio All Popular ≤ 10 (10, 20] > 20 Session Length (minutes) ≤ 5 (5, 16] > 16 Inter Session (days) (b) Twitch
Figure 7: Channels ratio by characteristic partition
We highlight in this following three main usages but others can be studied nevertheless.
An usage of the dataset is the forecast of popular ses-sions. By identifying the most popular sessions as early as possible, it is possible for example to adjust the capacity of the system infrastructure. We present hereafter a very preliminary, but not fully convincing, study that exploits our dataset. We selected some channels characteristics: the length of their sessions, the interval between sessions and the number of sessions. We evaluate how the channels are distributed along these characteristics. We compare the dis-tribution for all channels and the disdis-tribution of the 1% most popular channels. The first remark on Figure 7 is that YouTube and Twitch popular channels characteristics are not identical. While YouTube popular channels have influ-ence of all the characteristics, Twitch popular group remains equally distributed regarding number of sessions and inter-session length. Another point is that popular channels on YouTube are more frequent and longer than the full group of channels. Popular channels of Twitch differentiate from the full group by having longer sessions. An extension of the study could lead to useful developments.
A second usage of this dataset is the study of delivery methods on live streaming services. In [15] an initial evalu-ation on the implementevalu-ation of Dynamic Adaptive Stream-ing over HTTP (DASH) on Twitch was made. We use the three months of traces provided by this dataset. We moti-vate the need for an adoption of adaptive bitrate streaming on Twitch platform to reduce the delivery bandwidth cost and to increase QoE of viewers. We show that a naive imple-mentation requires the reservation of a large amount of com-puting resources for transcoding purposes. To address the
trade-off between benefits and costs, we formulate a man-agement problem and we design two strategies for deciding which online channels should be delivered by adaptive bi-trate streaming. In this work our evaluations based on real traces show that these strategies can reduce the overall in-frastructure cost by 40% in comparison to an implementa-tion without adaptive streaming. This is an example of how we use the dataset to thoroughly analyse and evaluate a technical solution for these systems. Another example is [2], where the dataset is used to simulate the need of transcoding jobs in a data-center.
A last usage example of the dataset is the evaluation of scenarios that are based on different service providers competitors. For example in [14] the traces were applied to conceive a scenario where two content providers deliver their contents through an unique Content Delivery Network (CDN). This work characterizes the impact of revenue-oriented CDN management policies on the fairness of the competition among two content providers that use CDN ser-vices to deliver contents. With the data of YouTube and Twitch, we can show that an CDN remains a relatively neu-tral actor even when one of the content providers it serves tries to monopolize the CDN storage space by implementing an aggressive policy to harm its competitors.
5.
RELATED WORK
We identified three types of works that are related to the study we describe in this paper.
User Generated Content. Many measurement campaigns have been conducted to understand the motivations of con-tributors to user-generated content (UGC) platforms. How-ever, to the best of our knowledge, only three papers have addressed user-generated live videos. Two of them deal with “gamecasting”, i.e. gamers capturing and broadcasting their activity within a game. In the first one [13], professional players broadcasting in Twitch.tv (a branch of Twitch ex-clusively for gaming) are analyzed. This study is restricted to a very small number of uploaders although we are in-terested in the present paper in capturing usages from a broad population of uploaders. The second paper [16] stud-ies XFire, which is a social network for gamers featuring live video sharing. The authors focus on analyzing the sim-ilarities between the activity of gamers in XFire and their activity in the actual games. The third paper dealing with live video sharing is [17]. The authors analyzed 28 days of data from two channels associated with a popular Brazilian TV program that aired in 2002. Our work differs fundamen-tally since we evaluated several thousands of channels in a quantitative manner.
UGC in P2P Systems. The other line of research dealing with user-generated live streaming is peer-to-peer systems. A survey is given in [20]. Many papers claim to own traces from popular live streaming systems, for instance PPLive and PPStream, but none of them make a thorough study of these traces. In most cases, authors cannot have an accurate view of channel popularity due to the distributed nature of these systems. These measurements, typically for PPLive, are also limited to a small number of channels (320 in [10]) although our work characterizes thousands of channels.
Fi-nally, many works focus on characterizing the peer-to-peer topologies and the behaviors of peers in terms of bandwidth contribution [18], but such studies are not relevant in the case of the YouTube and Twitch platform.
Video Content Measurement Studies. Many papers have studied video consumption over the Internet. In par-ticular, the authors of [12] have dealt with over five years of users web traffic data to examine different characteristics of Internet usage. They highlighted in particular the increas-ing importance of video content. In [7], YouTube traffic generated by mobile devices is compared to traffic gener-ated by regular PCs. Their results showed access patterns, which are similar across the sources of traffic. In [21] the total amount of YouTube videos allow the authors to draw conclusion about the bounds of total bandwidth and stor-age space that is necessary for YouTube to run. This study emphasizes the critical needs of resources for VoD systems. The video traffic generated by YouTube is analyzed from the standpoint of an Internet Service Provider (ISP) in [1] and [9]. Overall, these studies have emphasized the impor-tance of services like YouTube over the whole Internet traffic and the exploding needs of resources to serve the population. In the present paper, we utilize similar techniques to ana-lyze the behavior of people who contribute to a live video service as well as the bounds of total bandwidth usage for live videos delivery.
6.
CONCLUSION
We have presented in this paper a dataset, which can help scientists to better understand and study the behavior of UGC live streaming videos systems. We have compared two largely used systems. We have brought some prelim-inary, hopefully useful, insights on what can be expected from massive UGC live streaming video services. We have showed that these systems experience peaks at more than 1 Tbps of bandwidth. We have also pointed out differences between YouTube and Twitch, especially regarding the up-loader behavior and the maturity of Twitch environment.
We hope that this dataset can bring a light on the specific characteristics of live streaming video services and help the community and providers to improve the systems accord-ingly. We have also higlighted some open problems, includ-ing an open problem which is to identify the most popular sessions as early as possible. We showed there is no trivial ways to identify popular channels except about their length and their video quality.
7.
REFERENCES
[1] V. K. Adhikari, S. Jain, and Z.-L. Zhang. Youtube traffic dynamics and its interplay with a tier-1 ISP: an ISP perspective. In IMC. ACM, 2010.
[2] R. Aparicio-Pardo, K. Pires, G. Simon, and A. Blanc. Transcoding live adaptive video streams at a massive scale in the cloud. In ACM MMSys, 2015.
[3] M. Cha, H. Kwak, P. Rodriguez, Y.-Y. Ahn, and S. B. Moon. Analyzing the video popularity characteristics of large-scale user generated content systems. IEEE/ACM Trans. Netw., 17(5):1357–1370, 2009.
[4] G. Chatzopoulou, C. Sheng, and M. Faloutsos. A first step towards understanding popularity in youtube. In IEEE INFOCOM Workshops, 2010.
[5] D. Cryan. eSports video: A cross platform growth story. Technical report, IHS Tech., June 2014.
http://is.gd/NHVdfi.
[6] M. DiPietro. Twitch.tv: 2013 retrospective. Twitch Blog, Jan. 2014.http://twitch.tv/year/2013. [7] A. Finamore, M. Mellia, M. M. Munaf`o, R. Torres,
and S. G. Rao. Youtube everywhere: impact of device and infrastructure synergies on user experience. In IMC. ACM, 2011.
[8] D. Fitzgerald and D. Wakabayashi. Apple Quietly Builds New Networks. Wall Street Journal, Feb. 2014.
http://is.gd/MXc2b7.
[9] F. Guillemin, B. Kauffmann, S. Moteau, and A. Simonian. Experimental analysis of caching efficiency for youtube traffic in an isp network. In IEEE ITC, 2013.
[10] X. Hei, C. Liang, J. Liang, Y. Liu, and K. W. Ross. A measurement study of a large-scale p2p iptv system. IEEE Transactions on Multimedia, 9(8):1672–1687, 2007.
[11] T. Hoff. Gone fishin’: Justin.tv’s live video
broadcasting architecture. High Scalability blog, Nov. 2012.http://is.gd/5ocNz2.
[12] S. Ihm and V. S. Pai. Towards understanding modern web traffic. In IMC. ACM, 2011.
[13] M. Kaytoue, A. Silva, L. Cerf, W. M. Jr., and C. Ra¨ıssi. Watch me playing, i am a professional: a first study on video game live streaming. In ACM WWW Conf., 2012.
[14] P. Maill´e, K. Pires, G. Simon, and B. Tuffin. How neutral is a cdn? an economic approach. In CNSM. IEEE, 2014.
[15] K. Pires and G. Simon. Dash in twitch: Adaptive bitrate streaming in live game streaming platforms. In VideoNext CoNEXT Workshop. ACM, 2014.
[16] S. Shen and A. Iosup. XFire online meta-gaming network: Observation and high-level analysis. In MMVE Workshop, 2011.
[17] E. Veloso, V. A. F. Almeida, W. M. Jr., A. Bestavros, and S. Jin. A hierarchical characterization of a live streaming media workload. IEEE/ACM Trans. Netw., 14(1):133–146, 2006.
[18] A. B. Vieira, P. Gomes, J. A. M. Nacif, R. Mantini, J. M. Almeida, and S. V. A. Campos. Characterizing sopcast client behavior. Computer Communications, 35(8):1004–1016, 2012.
[19] YouTube. Youtube live introduction. YouTube Live Streaming Guide, Dec. 2013.http://is.gd/Aw0yAx. [20] X. Zhang and H. S. Hassanein. A survey of
peer-to-peer live video streaming schemes - an algorithmic perspective. Computer Networks, 56(15):3548–3579, 2012.
[21] J. Zhou, Y. Li, V. K. Adhikari, and Z.-L. Zhang. Counting youtube videos via random prefix sampling. In IMC. ACM, 2011.