ÉCOLE DE TECHNOLOGIE SUPÉRIEURE UNIVERSITÉ DU QUÉBEC
MANUSCRIPT-BASED THESIS PRESENTED TO
ÉCOLE DE TECHNOLOGIE SUPÉRIEURE
IN PARTIAL FULFILLEMENT OF THE REQUIREMENTS FOR THE DEGREE OF DOCTOR OF PHILOSOPHY
PH. D.
BY
Mehdi SABOORI
MATERIAL MODELING FOR MULTISTAGE TUBE HYDROFORMING PROCESS SIMULATION
MONTREAL, JANUARY 08 2015 © Copyright 2015 reserved by Mehdi Saboori
© Copyright
Reproduction, saving or sharing of the content of this document, in whole or in part, is prohibited. A reader who wishes to print this document or save it on any medium must first obtain the author’s permission.
BOARD OF EXAMINERS
THIS THESIS HAS BEEN EVALUATED BY THE FOLLOWING BOARD OF EXAMINERS
Prof. Natalia Nuño, ETS, présidente
Département de génie de la production automatisée, École de technologie supérieure Prof. Henri Champliaud, ETS, directeur de thèse
Département de génie mécanique, École de technologie supérieure Dr. Javad Gholipour Baradari, CNRC, codirecteur de thèse
National Research Council, Institute for Aerospace Research, Aerospace Manufacturing Technologies Center
Prof. Augustin Gakwaya, Université Laval, co-directeur de thèse Département de génie mécanique, univertisté Laval
Prof. Ngan Van Lê, ETS, membre du jury
Département de génie mécanique, École de technologie supérieure Prof. Philippe Bocher, ETS, membre du jury
Département de génie mécanique, École de technologie supérieure Prof. Zengtao Chen, University of Alberta, Membre externe independent Department of Mechanical Engineering, university of Alberta
THIS THESIS WAS PRENSENTED AND DEFENDED
IN THE PRESENCE OF A BOARD OF EXAMINERS AND PUBLIC
NOVEMBER 28 2014
This dissertation is dedicated to my loving parents and my beloved spouse For their love, endless supports and encouragement
ACKNOWLEDGMENT
I would like to express my sincere gratitude to my supervisor Prof. Henri Champliaud for guiding me and helping me reach my potential. Prof. Champliaud has both the personal and professional attributes that I strive for, and I will always consider it a tremendous honor to have studied under his guidance.
I would like to extend my special thanks to my co-supervisor Dr. Javad Gholipour Baradari from National Research Council of Canada (NRC)-Aerospace, who supported me at every important moment of my PhD experience at NRC. Without his thrust, guidance, patience and supports, my research would not have been successful. Undoubtedly, he was one of the most influential person during my Ph.D.
Also, I would like to thank my co-supervisor Prof. Agustin Gakwaya from Laval University in a special way, I express my heartfelt gratefulness for his guide and support that I believed I learned from the best.
I also sincerely thank to Dr. Jean Savoie from Pratt & Whitney Canada for his enthusiastic support and pertinent suggestions all along the Project. This dissertation would not have been possible without the financial support of Pratt & Whitney Canada, NRC-Aerospace, Natural Sciences and Engineering Research Council of Canada (NSERC) and Consortium de recherche et d'innovation en aérospatiale au Québec (CRIAQ). A partially financial support by Fonds Québécois de la Recherche sur la Nature et les Technologies (FQRNT) is gratefully acknowledged.
I would also like to give thanks and a special acknowledgement to Dr. Priti Wanajara for providing valuable comments supporting me at writing stages of all my publication.
A very special acknowledgement goes to my wife Somayeh, who loved and supported me during the final, critical months of my dissertation, and made me feel like anything was possible. I love you, Somayeh. I would also like to acknowledge my parents, as well as my
wife’s parents, for their unwavering supports, kind words, well-wishing and patience for abiding by my absence.
I am particularly grateful to my friends and colleagues who put up with me during the hard and the joyful times.
Finally, Thank you my God for many beautiful thinks cannot be seen our touched, they are left within the heart. What you have done for me is one of them. And thank you from the bottom of my heart.
MATERIAL MODELING FOR MULTISTAGE TUBE HYDROFORMING PROCESS SIMULATION
Mehdi SABOORI ABSTRACT
The Aerospace industries of the 21st century demand the use of cutting edge materials and manufacturing technology. New manufacturing methods such as hydroforming are relatively new and are being used to produce commercial vehicles. This process allows for part consolidation and reducing the number of parts in an assembly compared to conventional methods such as stamping, press forming and welding of multiple components. Hydroforming in particular, provides an endless opportunity to achieve multiple cross-sectional shapes in a single tube. A single tube can be pre-bent and subsequently hydroformed to create an entire component assembly instead of welding many smaller sheet metal sections together. The knowledge of tube hydroforming for aerospace materials is not well developed yet, thus new methods are required to predict and study the formability, and the critical forming limits for aerospace materials.
In order to have a better understanding of the formability and the mechanical properties of aerospace materials, a novel online measurement approach based on free expansion test is developed using a 3D automated deformation measurement system (Aramis®) to extract the coordinates of the bulge profile during the test. These coordinates are used to calculate the circumferential and longitudinal curvatures, which are utilized to determine the effective stresses and effective strains at different stages of the tube hydroforming process.
In the second step, two different methods, a weighted average method and a new hardening function are utilized to define accurately the true stress-strain curve for post-necking regime of different aerospace alloys, such as inconel 718 (IN 718), stainless steel 321 (SS 321) and titanium (Ti6Al4V). The flow curves are employed in the simulation of the dome height test, which is utilized for generating the forming limit diagrams (FLDs).
Then, the effect of stress triaxiality, the stress concentration factor and the effective plastic strain on the nucleation, growth and coalescence of voids are investigated through a new user material for burst prediction during tube hydroforming. A numerical procedure for both plasticity and fracture is developed and implemented into 3D explicit commercial finite
element software (LS-DYNA) through a new user material subroutine. The FLDs and
predicted bursting pressure results are compared to the experimental data to validate the models.
Finally, the new user material model is used to predict the bursting point of some real tube hydroforming parts such as round to square and round to V parts. Then, the predicted
bursting pressure results are compared to the experimental data to validate the models in real and multistep tube hydroforming processes.
Keywords: Hydroforming, Forming Limit Diagram, Stress triaxiality, Inconel, Stainless steel
MATERIAL MODELING FOR MULTISTAGE TUBE HYDROFORMING PROCESS SIMULATION
Mehdi SABOORI RÉSUMÉ
L’industrie aéronautique du 21e siècle est en forte demande de technologie de fabrication et de matériaux de pointe. Des méthodes avancées de fabrication telles que l’hydroformage sont relativement nouvelle et actuellement utilisée pour produire des véhicules commerciaux. Ce procédé permet à travers la consolidation de pièces de réduire le nombre de pièces dans un assemblage comparativement aux méthodes conventionnelles de mise en forme du métal en feuille comme l’emboutissage, la mise en forme par presse et soudage de multiple composantes. Un simple tube peut être pré-déformé par pliage ou écrasé puis hydroformé pour créer un assemblage de composants en lieu et place d’une pièce constituée de plusieurs petites sections de métal soudées ensemble. Les connaissances sur l’hydroformage de tubes en alliages aéronautiques ne sont pas encore très développées. Ainsi, Il est nécessaire de mettre en place de nouvelles méthodes pour prédire et étudier la formabilité et les limites critiques de mise en forme des matériaux aéronautiques.
Afin de mieux comprendre la formabilité et les propriétés mécaniques des matériaux aéronautiques, une approche novatrice de mesure en ligne basée sur des essais d’expansion libre a été développée. Elle utilise un système automatique 3D de mesure de déformation (Aramis®) pour extraire les coordonnées du profil de gonflement du tube pendant l’essai. Ces coordonnées sont utilisées pour calculer les courbures circonférentiel et longitudinale, qui elles servent à déterminer les contraintes et déformations effectives à différentes étapes du procédé d’hydroformage de tube.
Dans un deuxième temps, deux différentes méthodes : une méthode de moyenne pondérée et une nouvelle fonction de durcissement ont été utilisés pour définir avec précision la courbe contrainte vraie-déformation vraie pour la section après striction de différents alliages aéronautiques, tels que l’inconel 718 (IN 718), l’acier inoxydable 321 (SS 321) et le titane (Ti6Al14V). Les courbes d’écoulement ont été employées dans la simulation du test de hauteur de dôme qui sert à générer les diagrammes de limites de mise en forme (FLDs). Ensuite, les effets de la triaxialité de contraintes, du facteur de concentration de contraintes et de la déformation plastique effective sur la nucléation, la croissance et la coalescence des cavités sont étudiés à travers un nouveau matériel pour la prédiction de la rupture pendant un essai d’hydroformage de tube. Une procédure numérique pour, à la fois, la plasticité et la rupture a été développée et implémentée dans le logiciel d’éléments finis commercial 3D explicite (LS-DYNA) à travers une nouvelle matérielle sous-routine. Les FLDs ainsi que les prédictions de pression à la rupture sont comparés aux données expérimentales pour valider les modèles.
Enfin, le nouveau modèle matériau a été utilisé pour prédire le point de rupture de quelques pièces réelles hydroformées de type « ronde à carré » et « rond à V ». Puis, les résultats de
prédiction de la pression de rupture ont été comparés avec les résultats expérimentaux pour valider les modèles en procédés de mise en forme par hydroformage réel et multi-étapes. Mots-clés : Hydroformage, diagramme de mise en forme limite, triaxialité des contraintes, inconel, acier inoxyable
TABLE OF CONTENTS
Page
INTRODUCTION ...1
CHAPTER 1 LITERATURE REVIEW ...7
1.1 Introduction ... 7
1.2 Classification of tube hydroformed part ... 9
1.3 Tube hydroforming process parameters ... 10
1.3.1 Tube material ... 10
1.3.1.1 The tensile test Tube material ... 11
1.3.1.2 The tube bulge test ... 12
1.3.2 Loading path ... 13
1.3.3 The geometry and the tube dimensions ... 14
1.3.4 Tribological aspects in tube hydroforming ... 15
1.4 Formability in hydroforming ... 16
1.4.1 Strain hardening ... 16
1.4.2 Anisotropy... 17
1.4.3 Damage accumulation ... 18
1.4.3.1 Damage Criteria using Empirical and Semiempirical Models .. 18
1.4.3.2 Damage criteria using theoretical void coalescence and growth-decoupled damage ... 19
1.4.3.3 Coupled damage ... 24
1.4.4 Forming limit diagrams... 28
1.4.4.1 Forming limit diagram concept ... 29
1.4.4.2 Theoretical models for calculation LFD’s ... 33
1.4.4.3 Sensitivity of theoretical models for calculation LFD’s ... 38
1.4.4.4 Conclusion ... 40
1.4.4.5 Forming limit diagram for tube hydroforming ... 41
1.5 Conclusion of literature review and enlightening of problematic ... 45
CHAPTER 2 EVALUATING THE FLOW STRESS OF AEROSPACE ALLOYS FOR TUBE HYDROFORMING PROCESS BY FREE EXPANSION TESTING ...47
2.1 Introduction ... 48
2.2 Characterizing the flow stress of tubular materials in the THF process ... 51
2.3 Experimental procedure ... 55
2.3.1 Free expansion tests ... 55
2.3.2 Tensile tests ... 57
2.4 Results and discussion ... 58
2.5 Numerical validation ... 65
2.6 Conclusions ... 69
CHAPTER 3 EXTENSION OF FLOW STRESS-STRAIN CURVES OF AEROSPACE ALLOYS AFTER NECKING ...73
3.1 Introduction ... 73
3.2 Analytical Procedure ... 74
3.3 Weighted average method ... 74
3.3.1 New hardening function ... 80
3.4 Test Procedure to calculate α, C1 and C2 ... 81
3.5 Results and discussions ... 83
3.5.1 Weighted-average and new hardening methods ... 83
3.5.2 Validation of the new methodology ... 87
3.6 Conclusions ... 90
CHAPTER 4 BURSTING FAILURE LIMIT PREDICTION OF TUBE HYDROFORMING BASED ON A NEW DUCTILE FRACTURE CRITERION FOR AEROSPACE ALLOY...91
4.1 Introduction ... 91
4.2 Ductile Fracture Criteria ... 94
4.3 Development of a new criterion for ductile fracture of THF process ... 96
4.3.1 Void nucleation model ... 98
4.3.2 Void growth model ... 99
4.3.3 Void Coalescence model ... 99
4.3.4 New ductile fracture criterion ... 100
4.4 Material characterization and criteria calibration ... 101
4.5 Implementation for Fracture Prediction ... 103
4.6 Predicting of fracture forming limit curves in the THF process ... 107
4.6.1 Numerical approach using ductile fracture criterion ... 107
4.6.2 Experimental approach ... 109
4.7 Results and discussion ... 112
4.8 Conclusion ... 115
CHAPTER 5 CASE STUDY ...117
5.1 Case Studies ... 117
5.1.1 Round to square model (3D) ... 117
5.1.2 Round to V model (3D) ... 118
5.2 Damage constants calibration ... 119
5.3 Results ... 120
CHAPTER 6 THESIS SUMMARY ...123
6.1 Introduction ... 123
6.2 Material characterization for tube hydroforming ... 124
6.3 Work hardening laws ... 126
6.4 Study the material behavior after the onset of instability for ductile materials ... 126
6.5 Failure modeling of THF process for ductile materials ... 127
6.6 Key contributions and outcomes of the thesis ... 128
CONCLUSION ...131
FUTURE WORKS...135
APPENDIX I PREDICTION OF BURST PRESSURE USING DECOUPLED DUCTILE FRACTURE CRITERIA FOR TUBE HYDROFORMING OF AEROSPACE ALLOYS ...139
APPENDIX II STUDY OF TRUE STRESS-STRAIN CURVE AFTER NECKING FOR APPLICATION IN DUCTILE FRACTURE CRITERIA IN TUBE HYDROFORMING OFAEROSPACE MATERIAL ...141
APPENDIX III EFFECT OF MATERIAL MODEL ON FINITE ELEMENT MODELING OF AEROSPACE ALLOYS ...143
APPENDIX IV DEVELOPMENT OF AN INVERSE METHOD FOR MATERIAL CHARACTERIZATION ...145
LIST OF TABLES
Page
Table 1.1 Advantages of biaxial test over uniaxial test (Yadav, 2008). ...13
Table 2.1 Experimental conditions for the first and second set of the ...57
Table 2.2 True stress–true strain relations based on the free expansion test results using a spline profile. ...63
Table 2.3 True stress–true strain relations based on the tensile test results………...63
Table 2.4 True stress–true strain relations based on the free expansion test results using an elliptical profile. ...63
Table 2.5 Comparison of the predicted burst pressures calculated from the different material constants with the experimental data. ...67
Table 3.1 Mechanical properties for annealed materials. ...83
Table 3.2 Swift work hardening constants for ...83
Table 3.3 New extrapotation hardening constants for after necking for IN 718, TI6AL4V and SS 321 ...84
Table 3.4 Comparison of the punch-displacement for SS 321 and IN 718 ...89
Table 4.1 Average material constants in ductile fracture criteria………102
Table 4.2 True stress–strain relations (Saboori et al. 2014)………108
Table 4.3 Experimental conditions for the first and second set of the free expansion trials ...110
Table 4.4 Comparison of the predicted burst pressures for without end feeding condition. ...113
Table 5.1 Material constants for the new ductile fracture criterion. ...120
Table 5.2 Comparison of the predicted burst pressures for without end feeding condition. ...122
LIST OF FIGURES
Page Figure 0.1 Typical tube hydroforming process ...2 Figure 1.1 Typical hydroformed parts (Hartl 2005). ...8 Figure 1.2 The tube hydroforming system (Strano, Jirathearanat et al. 2004). ...8 Figure 1.3 Tube hydroformed part features (a) bent feature, (b) crushed feature, (c) bulgeed feature, (d) protrusion feature (referred as Y-shape), and (e) automotive hydroformed structural part (SPS, Germany) ...10 Figure 1.4 Schematic to show how tensile specimens are taken from a tube
(Saboori, Champliaud et al. 2014). ...11 Figure 1.5 Friction zones in tube hydroforming (Ngaile, Pax et al. 2006). ...15 Figure 1.6 Failure modes in tube hydroforming (a) wrinkling, (b) buckling, and (c) bursting (Koc and Altan 2002). ...16 Figure 1.7 Damaged RVE in a damaged body (Lemaitre, 1996). ...20 Figure 1.8 Damaged RVE in a damaged body (Lemaitre and Lippmann 1996). ...21 Figure 1.9 Stages in void nucleation, growth and coalescence in ductile metals
(Anderson 2005). ...24 Figure 1.10 Damage stages in a tensile specimen (Mariage 2003). ...25 Figure 1.11 CrackedAl3Ti-particlein a tensile test specimen
(Gänser, Werner et al. 1998). ...26 Figure 1.12 Two kinds of mechanisms for coalescence of voids (a) necking of inter-void ligaments; (b) shear-linking up of voids (Weck, Wilkinson et al. 2008) . ...28 Figure 1.13 Keeler-Goodwin forming limit diagram. ...30 Figure 1.14 A typical Forming Limit Diagrams (FLD) along with different strain states (Holmberg, Enquist et al. 2004). ...31 Figure 1.15 The forming window for forming of sheet (Hu, Marciniak et al. 2002). ...32
Figure 1.16 (a) Loading path in the THF forming window, (b) in-plane strain plot. ...32
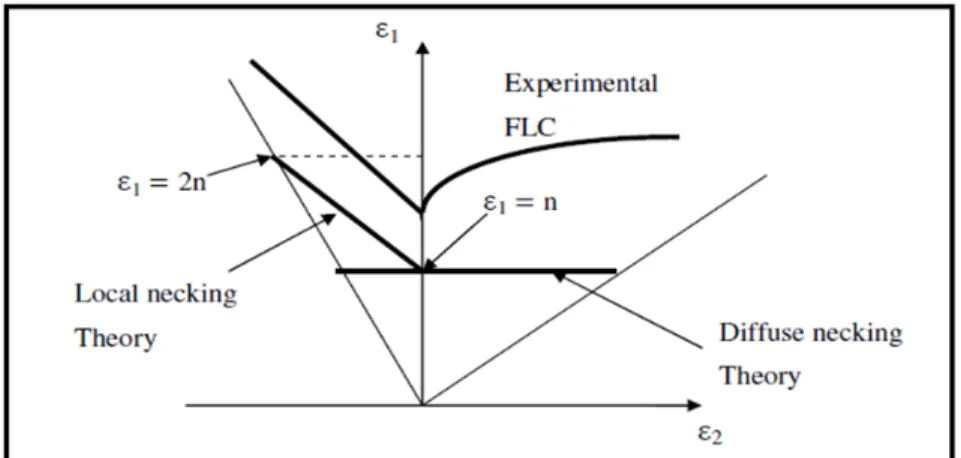
Figure 1.17 The Swift forming limit curve predicting the diffuse necking. ...34
Figure 1.18 A FLD predicted limits given from both the diffuse and local ...36
Figure 1.19 Schematic of sample with groove ‘b’ and uniform region ‘a’ (Graf and Hosford 1990). ...37
Figure 1.20 Forming limit diagram with characteristic regions (Chu, Xu et al. 2006). ...42
Figure 1.21 Tube specimens tested to obtain tube FLD (Groche 2004). ...42
Figure 1.22 1.4301 stainless steel sheet versus tube FLDs (Groche 2004). ...43
Figure 1.23 (a) analytically obtained aluminum sheet and tube FLDs; (b) experimental results for tube FLD (Chu, Xu et al. 2006). ...44
Figure 2.1 Schematic diagrams of (a) the tube free expansion tool and (b) the test setup with the 3D deformation measurement system. ...51
Figure 2.2 CAD of the die-set showing (1) the lower shoe, (2) the lower right cavity and (3) lower left cavity. ...56
Figure 2.3 Experimental setup for the free expansion tests. ...56
Figure 2.4 Location of the tensile specimens extracted from seam welded SS 304L. ...58
Figure 2.5 AA 6061-0, SS 321, IN 718, and SS 304L and tubes after free Expansion testing. ...59
Figure 2.6 Flow chart for determining the flow curves. ...60
Figure 2.7 Tube profile coordinates and 3rd order spline fitted at different pressures during the free expansion process. ...60
Figure 2.8 Comparison of the flow stress curves for (a) SS 321, 0.9 mm thickness, (b) SS 321, 1.2 mm thickness, (c) IN 718, 0.9 mm thickness, (d) IN 718, 1.2 mm thickness, (e) SS 304L, 1.6 mm thickness and (f) AA 6061-0, 3 mm thickness...64
Figure 2.9 Mesh used in the FE modeling. ...67 Figure 2.10 Maximum free expansion height versus internal pressure (a) SS 321, 0.9 mm thickness, (b) SS 321, 1.2 mm thickness, (c) IN 718, 0.9 mm thickness, (d) IN 718, 1.2 mm thickness,
(e) SS 304L, 1.6 mm thickness and (f) AA 6061-0, 3 mm thickness. ...78 Figure 3.1 True stress-true strain curve for Hollomon and Swift work-hardening extrapolations. ...77 Figure 3.2 Flowchart for the weighted average method (solid line) and the new hardening function (dotted line). ...79 Figure 3.3 An experimental apparatus for free expansion tests. ...82 Figure 3.4 Specimen used for uniaxial tensile testing and the mesh used for FE
modeling. ...82 Figure 3.5 Comparison of true stress-true strain curves for post-necking phases (a) IN 718, (b) 2 mm Ti6Al4V, (c) 0.9 mm SS 321, (d) 1.2 mm SS 321. ...85 Figure 3.6 Comparison of load-displacement curves for (a) IN 718, (b) Ti6Al4V, (c) 0.9 mm SS 321, (d) 1.2 mm SS 321. ...86 Figure 3.7 FE modeling of dome height test and deformed shapes of specimens of SS 321. ...88 Figure 4.1 Comparison of the fracture locus in the plane of equivalent fracture strain and stress triaxiality, (Luo and Wierzbicki 2010). ...97 Figure 4.2 SS 321 samples for damage constants evaluation (a) tensile specimens with various geometries, (b) Hourglass shapes. ...102 Figure 4.3 Flowchart for fracture prediction during free expansion process. ...107 Figure 4.4 Mesh used in the FE model. ...108 Figure 4.5 CAD of the die-set showing (1) the lower shoe, (2) the lower right cavity and (3) lower left cavity. ...109 Figure 4.6 Experimental setup for the free expansion tests. ...110 Figure 4.7 Different loading paths (a) 0.9 mm SS 321, (b) 1.2 mm SS 321 and (c) 0.9 mm IN 718. ...111 Figure 4.8 Free expansion test results with different loading paths for SS 321, 0.9 mm thickness. ...112 Figure 4.9 Comparison between FLDf (a) 0.9 mm SS 321, (b) 1.2 mm SS 321, (c) 0.9 mm IN 718. ...114
Figure 5.1 Round-to-square hydroforming process (a) schematic cross section (b) tube and die in the FEM (Mojarad Farimani, Champliaud et al. 2013). ...118 Figure 5.2 FE model of the preforming process (a) initial stage (b) final stage ...119 Figure 5.3 FE model of the hydroforming process (a) initial stage (b) final stage ...119 Figure 5.4 Results from numerical damage simulations of round to square
experiments using the 3D model (a) round to square 0.9 mm SS 321, (b) round to square 0.9 mm IN 718 (c) round to V 0.9 mm SS 321 and (d) round to V 0.9 mm IN 718. ...121 Figure 6.1 Main stages of the research objectives ...124
LIST OF ABREVIATIONS THF Tube Hydroforming FE Finite Element SS 321 Stainless Steel 321 SS 304L Stainless Steel 321 AA 6061 Aluminum Alloy 6061 IN 718 Inconel 718
n-value Strain Hardening Exponent r-value Material Anisotropy
FLD Failure Limit Diagram FLC Failure Limit Curve FLDf Forming Limit at Fracture FLDn Forming Limit at Necking
NRC National Research Council of Canada W Length of the Expansion Zone
r Die Radius
t0 Initial Thickness of the Tube p Internal Pressure
h Bulge Height
t Thickness at the Maximum Bulge Height rθ Bulge Circumferential Radius
rz Bulge Longitudinal Radius pi Internal Pressure at Time i
ti Wall Thickness at Stage i
σθ Circumferential Stress σz Longitudinal Stress
rθp Maximum Circumferential Radius rz Bulge Curvature or Longitudinal Radius
σ Effective Stress
εθ Strains in the Circumferential Direction εt Strains in the Thickness Direction
εz Strains in the Longitudinal Direction
ε0 Initial Plastic Strain
ε Effective Plastic Strain
k Strength Coefficient
n Strain Hardening
ns Strain Hardening for Swift
nh Strain Hardening for Hollomon
F Tensile Load
A Cross Sectional Area of the Sample at the Gauge Length σ Effective Stress at the Neck
ε Effective Strain at the Neck
α Weight Constant
δ Square Errors
σs Steady-State Flow Stress
σm Hydrostatic Stress
Triaxiality Stress Ratio
D Physical Property
σ∗ Maximum Principal Stress
σ∗
σ
Stress Concentration Factor ε Magnitude of Equivalent Strain C to C Material Constants
D Damage Accumulation Caused by Nucleation of the Voids D Damage Accumulation Caused by Growth of the Voids D Damage Cccumulation Caused by Coalescence of the Voids,
Δ Strain Increment
B Elasto-Plastic Constitutive Matrix σ ∗ Trial Stress Tensor
G, dε Plastic Shear Modulus
λ Lamé Modulus,
dε Incremental Hydrostatic Strain Y(ε ) True Stress–True Strain Curve
Kronecker Delta
INTRODUCTION
Cost saving and product improvement have always been important goals in advanced metal forming processes. To achieve to these goals, metal forming processes need to be optimized. Tube hydroforming (THF) is one of the most popular advanced metal forming processes that is widely used to produce various tubular components. The principle of tube hydroforming is displayed in Figure 0.1. The tube is first clamped between the two halves of the die as shown in (Figure 0.1.a). The tube ends are then sealed using two plungers, (Figure 0.1.b). Pressurized fluid is then introduced into the tube through the end plungers and, in this way, the tube is then forced to adopt the inner contour of the die by the application of internal pressure and axial forces (via plungers) simultaneously (Figure 0.1.c). With increasing internal pressure, expansion of the tube occurs and at its limit the tube bursts. For limited applications, the tube can be formed by the increasing internal pressure only. This means that the axial plungers do not feed more material into the expansion zone.
Establishment of this process goes back to 1939 when Grey et al (Gray, Devereaux and Parker, 1940) investigated manufacturing of seamless copper fittings with T and X branches using a combination of internal pressure and axial load. During the last decays THF process contributed to automobile industries and more recently this process was implemented in aerospace industry due to its capability of manufacturing complex shapes with a simpler procedure than traditional stamping and welding processes. Hydroforming also has some further advantages such as weight reduction through more efficient section design, improved structural strength, and lower tooling cost due to fewer die components (Hwang and Lin, 2002; Lang et al., 2004). Increasing acceptance and use of THF technology within the aerospace industry demands a comprehensive understanding of critical issues such as material characteristics, friction condition and hydroformability of the material. To fulfill these requirements the feasibility study of the THF in aerospace industry should be well understood and its parameters optimized. The reliable application of finite element (FE) modeling could be contributed to a well-designed feasibility study. More recently the possibility of coupling FE modeling to mathematical failure algorithms is offering an
opportunity to design/study more precisely instead of only feasible ones. Throughout intensive research works during the last decays, the knowledge on the mechanisms of forming stages, material behavior and failure modes is understood to a good extent, followed by introduction of integrated strategies for precise FE modeling of THF process. Despite of all achievements, there are still many challenges on understanding, precise study of THF process for aerospace materials, by means of FE modeling and consequently time reduction in feasibility and design study.
Figure 0.1: Typical tube hydroforming process (Guan, Pourboghrat and Yu, 2006).
Defining the problem
The application of the THF process in the aerospace sector is comparatively recent with many challenges due to the high strength and/or limited formability of aerospace materials. This is plagued with long lead times, which result from much iteration of tryouts either on trial-and-error based FE modeling or on expensive prototype tooling. To avoid these undesirable expenses, study precisely the hydroformability of aerospace material is a key factor. However, The hydroformability of tubular parts is affected by a large number of parameters such as mechanical properties (before and after onset on instability), tube
geometry, complex die-tube interface lubrication, and process parameters, i.e. loading paths (Ahmed and Hashmi, 1997; Koc and Altan, 2002; Vollertsen and Plancak, 2002). However it is a complicated task as formability is remarkably influenced by direct and interaction effects between process parameters.
The main concerns when dealing with hydroformability is mechanical properties and proper selection process to determine the true stress-true strain behavior of tube to implement in any finite element software. Generally, the mechanical response is defined by the stress-strain behavior that can be determined from tensile testing of the specimens extracted either from the sheet used for roll forming of the tubes or directly from the tubes. More recently, free expansion testing has been used to characterize the mechanical response of the material for hydroforming applications (Hwang and Lin, 2002; Hwang, Lin and Altan, 2007; Saboori et al., 2013b; Song, Kim and Kang, 2007; Song et al., 2010). The free expansion test can emulate process conditions similar to those found during THF, and, as such, can be used to obtain reliable and accurate information on the mechanical response/properties of the tubular material (Saboori et al., 2014a).
Among mechanical properties, in the case of large plastic deformations, determination of true stress-true strain curves is usually performed in the pre-necking phase of the tensile testing. The post necking phase is usually ignored as deformation occurs at a localized region, i.e. the uniform stress state vanishes after the neck. The material behavior up to the onset of necking has been determined by different constitutive models, but a good knowledge of the material behavior after necking has not been fully addressed yet. Knowing the material behavior after neck is essential for performing an accurate FE modeling of metal forming processes (Cooreman et al., 2007). A few studies (Bohme et al., 1992; Bridgman, 1952; Ling, 1996; Mirone, 2004; Zhang et al., 1999) on analytical and FE modeling of material behavior after onset of instability have been reported. Hence, most of the previous investigations have employed experimental or FE modeling approaches for round specimens, while in the THF, the mechanical properties of sheet is necessarily for FE modeling (Saboori et al., 2012a).
The correct prediction of possible damage and failures in the reliable numerical simulation of THF is of most significant. Although FE model to predict the deformation behavior of THF before failure are increasingly available, reliable prediction of failure remains still open. In order to effectively design and manufacture a hydroformed aerospace part, it is critical that a reliable failure criterion be used in this process. To evaluate the forming severity of THF process studies have been performed on two main important failures; (i) necking and (ii) ductile fracture. However, in practical cases, the necking criterion may not predict the forming limit in a wide range of hydroforming process. Especially, in some materials, such as austenitic stainless and high strength steel alloys where strain hardening constants are greater than 0.4 ductile fracture is more common mode than necking since these alloys fail with negligible thickness reduction ((Bressan and Williams, 1983) (Korhonen and Manninen, 2008); Lou et al. 2012) . Moreover, onset of the necking take place in tension while ductile fracture is observed not only in tension but also in shear and compression (Lou et al., 2012); (Lou and Huh, 2012). Various ductile fracture criteria
have been studied to gain the onset of fracture, (Lei, Kang and Kang, 2001). as well as (Lei,
Kim and Kang, 2002) developed ductile fracture criterions (DFCs) to predict the forming limit of simple stamping part. A DFC at various stress triaxialities was presented by (Michael et al., 2008) to study the effect of stress triaxiality on the onset and evolution of damage inductile metals. (Farzin et al., 2006) as well as (Yu et al., 2007) investigated the effects of various damage criterions on the blanking parameters. Bao and Wierzbicki (Bai and Wierzbicki, 2010; Bao and Wierzbicki, 2004), Ko (Ko et al., 2007), Lou (Lou et al., 2012),
and Lou and Huh (Lou and Huh, 2012) developed different phenomenological damage
models based on nucleation, growth and coalescence of microscopic voids.
Many researchers (Han and Kim, 2003); (Ozturk and Lee, 2004); (Liu et al., 2009); (Chen, Zhou and Chen, 2010); (Lou et al., 2012); (Lou and Huh, 2013) verified the applicability of the phenomenological damage models to predict the formability of sheet metals. Although many studies of ductile fracture have already been undertaken, these are not applicable to estimate bursting failure in THF and all attempts involved with bursting failure in hydroforming process are based on experiment and few basic criteria ductile
damage models, (Lei, Kim and Kang, 2002); (Kim et al., 2004b);(Song et al., 2005); Saboori et al., 2011).
Research objectives
The goal of this research project is to propose new strategies for understating and modeling material behavior of THF process for aerospace materials. The ultimate goal of this work is to implement the new formability and failure study in a real hydroformed part/ multistage hydroforming process.
The specific research objectives can be summarized as follows:
1. To investigate and validate the formability/mechanical response of aerospace alloys before the onset of necking by using new combined experimental-analytical free expansion process. 2. To study and validate the flow behavior of aerospace alloy after the onset of the instability. 3. To suggest and validate a new damage model to study of failure and forming limit diagram at fracture for FE modeling of THF process of aerospace alloys.
Structure of thesis
This thesis comprises 5 chapters. It starts with an introduction, followed by chapter one on literature review, three other chapters on various research tasks, and a chapter on summary of the work presented, which links the outcomes of each chapter to proposed research objectives.
The thesis is organized as follows:
Chapter 1 a literature review concerning tube hydroforming process, formability and bursting failure are presented. An overview of failure methods is presented, followed by a conclusion of the literature review.
Chapter 2 presents the first goal of this research. A set of analytical and experimental works to understand the hydroformability of austenitic stainless steel types 321 (SS 321), 304L (SS 304L), Inconel alloy 718 (IN 718) and aluminum alloy 6061 (Al 6061) in the annealed “0’’ temper condition (AA 6061-0) is presented. Detailed stress-strain behavior of the material during free expansion is carried out for selected aerospace alloys.
Chapter 3 presents the second goal of this research. A set of analytical, experimental and FE analysis works is carried out to understand the true stress-strain curve for post-necking regime of different aerospace alloys, such as SS 321, IN 718 and Titanium (Ti6Al4V). A new hardening model is also adopted and validated to predict the material behavior after onset of necking.
Chapter 4 presents a new decoupled damage model for THF process of ductile materials based on the effect of the stress thriaxiality and the concentration factor. A new user material is also developed and implemented in 3D commercial finite element software, Ls-Dyna.
Chapter 5 presents damage prediction in two real THF processes based on the new decoupled damage model that is developed in chapter 4.
Chapter 6 presents a summary of research work presented in chapters 2-5. It links the outcomes of this work and the previous studies, and helps clarifying certain aspects and shortcomings that were identified in the problematic and research objectives.
CHAPTER 1
LITERATURE REVIEW
Tube hydroforming (THF) is among the most advanced metal forming process. The application of THF in the aerospace industries is relatively new and substantially needs more study and knowledge compared to that of automobile alloys. Therefore, there is a growing need for generating databases for aerospace alloys. This chapter presents an overview of major various aspects of THF. When proper conditions such as mechanical properties, material behavior and failure behavior are used, the feasibility and the design steps of this forming process for any aerospace application will be acquired. First, the design parameters and process condition that affect the forming process is presented. After that, the failure modes that usually occur during the process and the technique to predict and avoid these failure modes are discussed.
Introduction
THF is a forming process in which by applying controlled pressure and axial feed. The shape of the tube material is changed to the desired shape applications of THF can be found in the automotive, the aircraft industries (Ahmetoglu et al., 2000). Figure 1.1 shows some typical hydroformed parts.
The main components and key issues of a complete THF system (Figure 1.2) can be listed as follows:
A. Quality and properties of incoming tube materials. B. Preforming design.
C. Die and tool design guidelines.
E. Mechanics of the different deformation zones. F. Equipment, press and environment related issues.
G. Specifications and requirement of the hydroformed part.
Figure 1.1: Typical hydroformed parts (Hartl, 2005).
Figure 1.2: The tube hydroforming system (Strano et al., 2004).
Use of hydrostatic pressure in metal forming processes, in particular, for bulging of tubular parts was first reported in the late 1960s (FUCHS, 1966; Ogura, 1970). In 1970s, research on different aspects of bulge forming continued both experimentally and theoretically, new shapes, materials, different tooling configurations and new machine concepts were introduced by various authors, whereas the fundamentals remained the same. Starting from 1980s, researchers in Japan concentrated on determining the material properties and their effects on tube bulging operations (Hashmi and Crampton, 1985). The process started to spread industrially in the late eighties, and a lot of work was conducted, based on the previous theoretical studies, along with real and new industrial applications of this technology (Dohmann and Hartl, 1997). Some of the advantages of the THF in comparison with conventional stamping technology are: part consolidation, weight reduction, higher part quality, fewer secondary operations, reduced dimensional variations, reduced scrap, less springback, and improved structural strength and stiffness. But this process has also some drawbacks, such as slow cycle time, expensive equipment and lack of extensive knowledge base for process and tool design (Ahmetoglu et al., 2000; Jirathearanat, Hartl and Altan, 2004). In order to increase the implementation of this technology in the stamping industry, some issues need to be addressed: the preparation of the tubes (material selection and quality of the incoming tube), pre-form design and production method, application of computer simulations, selection of effective lubricants and enhancement of the tribological performance, and improvement of the formability of the tube.
Classification of tube hydroformedpart
Nowadays, Hydroformed tubular parts vary over a wide range of shapes and materials. This variety goes from a simple bulged tube to complex shape such as an engine cradle with multiple part features. It is necessary to classify the THF parts into different categories with respect to characteristics that they have in order to manage the design process more efficiently. Mainly, as shown in Figure 1.3 THF parts have the following common features on them (Koc and Altan, 1998).
Bend: a tube is bent in order to obtain a designed spline geometry that accommodates alignment of the tube in the THF die cavity.
Crushing: a crushed shape is given into a tube in the pre-forming stage not only to
facilitate the tube alignment into the die but also to accumulate the tube material locally for the subsequence expansion process. Crushed geometries are found frequently in automotive structural parts.
Bulge: bulges are typically tube expansions, mostly axisymmetric about the tube axis.
Protrusion: protrusions are local expansions, stemmed out from the tube axis. They are normally manufactured as connectors, i.e. T-shapes and Y-shapes, used particularly in exhaust manifolds.
Figure 1.3: Tube hydroformed part features (a) bent feature, (b) crushed feature, (c) bulge feature, (d) protrusion feature (referred as Y-shape), and (e)
automotive hydroformed structural part (SPS, Germany).
Tube hydroforming process parameters 1.1.1 Tube material
The process variables introduced by the tube material are:
1) Mechanical properties: chemical composition, yield strength, ultimate tensile strength, percent elongation and flow characteristics.
2) Dimensions: tube diameter and wall thickness of the tube.
3) Quality of the raw tube and method of preparation of the tube, which can be welded or seamless.
All these variables are critical for the success of the THF process and must be determined based on the final part requirements (Ahmetoglu and Altan, 2000; Ahmetoglu et al., 2000; Carleer et al., 2000). There are several tests used in industry to determine the material properties. The most widely used test are:
1.1.1.1 The tensile test Tube material
One of the simplest methods to measure the formability of tube is to carry out tensile tests on specimens taken from the tube or sheet. The stress–strain curve and the mechanical properties (yield stress, tensile stress, strain hardening exponent, anisotropy can be determined. It is common to take sample specimens at certain positions around the tube such as 90°, 180° and 270° from the weld seam. Figure 1.4 shows tensile specimens generally machined according to the ASTM standard.
In conclusion, the flow stress of the tube specimen is most likely to be different from that of the sheet specimen from which the tube was manufactured (Saboori et al., 2014a; Saboori et al., 2012b)
Figure 1.4: Schematic to show how tensile specimens are taken from a tube (Saboori et al., 2014a).
1.1.1.2 The tube bulge test
In order to obtain reliable data on material properties of the tube, a test procedure should be used, that is as close as possible to the hydroforming process. Although the results of the tensile test can provide information about the stress-strain relationship and anisotropy parameters, they can hardly be used to evaluate formability of tubes for hydroforming, since the tensile test induces a uniaxial state of stress, while the THF process is mainly biaxial. In other words, a test generating a biaxial tensile stress state in the sample (such as a bulging test) would be closer to the real process conditions and this would insure a much more effective evaluation of formability (Hwang, Lin and Altan, 2007; Koç, Aue-u-lan and Altan, 2001; Saboori et al., 2014a).
Table 1.1 shows a comparison of two commonly tests used. The biaxial bulge test is increasingly being applied by the European automotive industry for obtaining sheet material flow stress data for process simulation. The principle of the bulge test is very simple: a metal tubular specimen is loaded with internal pressure (usually hydraulic) and expands, undergoing plastic deformation until bursting occurs. By measuring the internal pressure and the tube deformation at the crown of the tube, much information on its mechanical properties can be attained.
Koç, (Koç, Aue-u-lan and Altan, 2001) and Sokolowski (Sokolowski et al., 2000) determined stress-strain relations behavior based on isotropic assumption. Hwang (Hwang and Lin, 2002), Manabe (Manabe and Amino, 2002) studed the influence of different parameters on formability. The parameters that were studies included strain hardening coefficient (n), anisotropy parameter (r), initial thickness and length of the tube. In their study they found that n and r have impact on the shape of the bulged tube and on the strain distribution. Higher values for r and n result in more evenly distributed strain and will favour larger deformations.
Table 1.1: Advantages of biaxial test over uniaxial test (Yadav, 2008). Tensile test Hydraulic bulge test 1. State of stress Does not very close to stress
conditions in production.
Closer to biaxial stresses seen in production.
2. Flow stress data Flow stress data collection is limited by local necking of tensile specimen. For FE modeling, flow stress data is extrapolated to large strains.
Flow stress data is obtained for up to twice the strain range in tensile test. Thus, no
extrapolation is needed in FE modeling.
3. Formability 'n' values or strain-hardening exponent of the material (for materials that follow power law fit σ =kϵ ) is used as a measure of material formability.
Dome height/ bulge height at burst is a good measure of formability. This test is a quick-and-easy check on incoming sheet/tube quality.
1.1.2 Loading path
The formability of THF is not influenced only by the mechanical properties of the tube material, but also by the loading path and the tube size (Kang, Kim and Kang, 2005). An improper loading path condition will lead to failure. The most common modes of failure in THF are: bursting due to formation of a localized necking which leads to fracture, and wrinkling due to local buckling.
The axial feeding has to be coordinated with the internal pressure. If the internal pressure is applied with a high rate or rapidly and the axial feeding slowly, the process will fail, because there is not enough material to flow into the die cavities. However, if the internal pressure is applied slowly and the axial feeding rapidly, there will be wrinkling or bulking on the tube (Jansson, Nilsson and Simonsson, 2008; Yuan et al., 2007). The optimum
loading path (internal pressure and the axial feed) is very difficult to achieve via experiments. Therefore, finite element analysis is used to verify and optimize the initial design step before the real hard tooling is built.
The loading path for round to Square and round to v shape s was investigated through finite element simulations (Mojarad Farimani, 2013). The purpose of these simulations was to study the effect of the axial feed on thickness variation and internal pressure. The authors demonstrated that the forming process is very sensitive to the axial feeding. The results indicated a decrease in the thinning of the tube wall when the axial feeding distance was increased.
1.1.3 Tribological aspects in tube hydroforming
The frictional conditions have a significant influence on the THF process. Due to high contact pressures and large contact surfaces, high friction forces between the tube and the die will result. These forces will affect not only the process parameters but also the quality of the component, such as the wall-thickness distribution. Therefore, decreasing the friction and its negative influence in THF is very important (Ngaile et al., 2006; Plancak, Vollertsen and Woitschig, 2005; Vollertsen and Plancak, 2002). Their conclusion was that during the forming process, the surface micro geometry will change continuously and therefore the friction conditions will also be changed. Lubricant, material properties (yield strength), surface texture and the die surface finish, die hardness and die surface treatment, and coating are the main parameters that affect the friction condition in THF. The lubricant trapped between the asperities on the tube and die surfaces may provide better lubrication at the interface due to the potential for hydrostatic lubrication. Figure 1.5 presents the THF for T-shape. From the friction point of view it is possible to identify three different zones: guided, transition and expansion zones. Due to the difference in the material flow and the state of stress, these three zones exhibit different tribological conditions (Koç, 2003; Ngaile, Jaeger and Altan, 2004). Therefore the lubricants can perform differently, these zones have to be evaluated separately to determine the friction characteristics.
Figure 1.5: Friction zones in tube hydroforming (Ngaile et al., 2006).
1.1.4 Formability in sheet and tube metal forming
The sheet or tube metal formability is a measure of its ability to deform plastically during forming processes in order to produce a part with definite requirements on mechanics, dimension and appearance, being mainly limited by the occurrence of flow localization or instability. Formability strong dependence on both the constitutive properties of the sheet metal and the factors involved in a practical forming operation turned the correct choice of these parameters to be one of the main aims in modern industry. A good understanding of the deformation processes of the plastic flow localization and of the factors limiting the forming of the tube or sheet metal in of key importance in monitoring the formability issue (Xu, 2006).
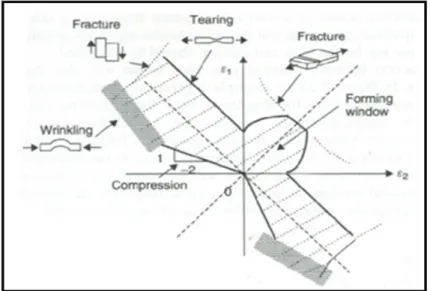
In THF, the instability modes are wrinkling, buckling and necking or bursting load (Chu and Xu, 2004; 2008; Kim et al., 2004a; 2005; Koc and Altan, 2002; Nefussi and Combescure, 2002), these instability shown schematically in Figure 1.6. Wrinkling and buckling occurs when the axial feeding (compressive stress) exceeds the strength of the material and the internal pressure is not high enough to produce expansion. Buckling is observed mostly in long tubes with thick walls, and wrinkling in short tubes with thin walls
with high end feeding condition. Bursting is a consequence of necking, which is due to large tensile stresses, when the plastic deformation reached a point at which the deformation will continue under a falling pressure.
Figure 1.6: Failure modes in tube hydroforming: (a) wrinkling, (b) buckling, and (c) bursting
(Koc and Altan, 2002).
Formability in hydroforming
It has been a well known fact that material and some external parameters are important factors that affect formability in hydroforming. Most of the studies in the literature will be presented next.
1.1.5 Strain hardening
Strain hardening or work hardening is the ability of materials to strengthen or harden with increasing strain level (Wagoner and Chenot, 1997). It is one of the most important properties influencing the formability of THF (Dohmann and Hartl, 1997; Manabe and Amino, 2002). When a material is cold worked, its strength and hardness increase because of
strain hardening. However, a consequence of that is also reducing of the remaining ductility. During metal forming (plastic deformation), a region undergoing thinning can resist further deformation because of strain hardening and can spread deformation to its neighboring regions, thus further deformation case uniform thinning. The parameter reflecting this behavior is strain hardening index, = ( )/ ( ) the uniform elongation (strain on the material until a neck forms) is mostly controlled by n. Thus a high n delays the onset of necking and improves formability. According to Considèred criterion, the end of uniform elongation occurs when the true work-hardening rate, equals the true strain (Chow and Yang, 2002; Saboori et al., 2012b). In order to obtain hydroformed parts with uniform wall thickness, the greater the strain-hardening of a tube, the better it performs in processes where there is considerable stretching as the straining will be more uniformly distributed and the tube will resist bursting (Manabe and Amino, 2002).
1.1.6 Anisotropy
Anisotropy in sheet and tube metal forming is the variation in its plastic behavior with orientation. It can be expressed by the normal anisotropy coefficient, = . Thus it is the ratio of plastic strain in the width direction to that in the thickness direction in the specimen (Zribi, Khalfallah and BelHadjSalah, 2013). The difference in properties for a tube aligned with the rolling, transverse (45 ) directions is referred to as planer anisotropy. If R is greater than unity, it indicates that the material has a high thinning resistance due to greater strength in the through-thickness direction. It also mean high strength in biaxial tension, while a low R-value indicates easy thinning and hence a low biaxial strength. In sheet metal forming, a high value of R allows deeper parts to be drawn and higher value reduces wrinkling (Manabe and Amino, 2002; Zribi, Khalfallah and BelHadjSalah, 2013).
1.1.7 Damage accumulation
The damage of materials is the progressive physical process by which they break. the mechanics of damage is the study of the following mechanisms when materials are subjected to loading (Lemaitre and Lippmann, 1996):
a) The accumulation of micro stresses in the neighborhood of defects or interfaces and the breaking of bonds, which both damage the material at the microscale level.
b) The growth and the coalescence of micro cracks or micro voids which together initiate one crack.
c) The growth of that crack at the macro scale level.
The first two stages may be studied by means of damage variables of the mechanics of continuous media. The third stage is usually studied using fracture mechanics.
Damage criteria can be divided into two:
a) Empirical and Semiempirical models and the damage criteria using theoretical void coalescence and growth (decoupled model).
This model taking into account a variable extern which predicts the damage when a critical value is reached (The damage calculated does not interact on the mechanical characteristics of the material).
b) Coupled model.
This model reports the decline of mechanical properties due to the development of the damage.
1.1.7.1 Damage Criteria using Empirical and Semiempirical Models
Most ductile fractures are usually based on combinations of stress with strain or strain rate, rather than on either of these quantities separately.
All the integrated stress–strain criteria based on empirical and semiempirical approach are versions of Freudenthal’s critical plastic work per unit of volume,
= (1.1)
where is the effective stress, is effective strain increment and ̅ is the effective strain at fracture. C , where i :1,2,... are critical damage values.
Cockcroft and Latham have suggested an alternative fracture criterion based on maximum principal stress (Cockcroft and Latham, 1968).
= (1.2)
where is the largest principal stress.
The normalized version of this criterion can be written as (Oh, Chen and Kobayashi, 1979a):
. =
(1.3)
Explicit dependence on the level of both the largest (tensile) principal stress, , and the hydrostatic stress , was proposed by Brozzo by means of an empirical modification of the above-mentioned criterion (Brozzo, Deluca and Rendina, 1972):
2
3( − ). =
(1.4)
1.1.7.2 Damage criteria using theoretical void coalescence and growth-decoupled damage
Metals are organized in crystals/ grains, a regular array of atoms except on many lines of dislocations where atoms are missing. If a shear stress is applied to the metallic materials,
the dislocations may move by the displacement of bonds, thus a plastic strain created by slipping.
Debonding is the first stage in the beginning of the damage process. If the dislocation is stopped by a micro defect concentration, it creates a constrained zone in which another dislocation may be stopped. This process occurs with debonding, where several arrests of dislocations nucleate a micro crack (Lemaitre and Lippmann, 1996).
Elasticity is one of the material properties that is directly influenced by the damage, since the number of atomic bonds responsible for elasticity decreases with damage. Plasticity is directly related to slips. In metals, slips occur by movement of dislocations. Damage influences plastic strains because the decrease in the elementary area of resistance, resulting from the decrease in the number of bonds, increases the effective stress.
Kachanov (Kachanov, 1986) explained the ‘one-dimensional surface damage variable’ by considering a damaged body and a representative volume element (RVE) at a point M oriented by a plane defined by its normal and its abscissa x along the direction (see Figure 1.7)
Figure 1.7: Damaged RVE in a damaged body (Lemaitre, 1996).
The value of the damage D (M, ,x) attached to the point M in the direction and the abscissa x is:
( , , ) = (1.5)
where, is the area of intersection of all the flaws with the plane defined by the normal and abscissa x; δS is the total area at the intersection plane.
For a simple one-dimensional case of homogeneous damage distribution of Figure 1.8, simple definition of damage as the effective surface density of microdefects is:
= (1.6)
Figure 1.8: Damaged RVE in a
damaged body (Lemaitre and Lippmann, 1996).
Damage D is bounded as:
0 ≤ ≤ 1 (1.7)
where = 0 represents the undamaged RVE material and = 1 represents fully broken RVE material in two parts. In fact, the failure occurs for < 1 through a process of instability, which suddenly induces the decohesion of atoms in the remaining resisting area. This rupture corresponds to a critical value of damage , which depends upon the material and the conditions of loading:
0 ≤ ≤ (1.8)
The most important methods to measure damage are classified as follows:
a) Direct measurements: This is done by observing microcrack pictures.
b) Variation of the elasticity modulus: This is an indirect measurement based on the influence of damage on elasticity:
=
(1 − ) (1.9)
This method requires accurate strain measurements. Strain gauges are commonly used and is most accurately measured during unloading. If = (1 − ) is considered as the effective elasticity modulus of the damaged material, the value of damage may be derived as:
= 1 − (1.10)
c) Variation of the microhardness: This is an indirect measurement based on the influence of damage on plasticity.
Rabotnov introduced the effective stress concept in 1968 as follows (Kachanov, 1986): If the RVE of Figure 1.8 is loaded by a force = , the effective stress is:
= (1.11)
If all microcracks or microcavities are represented by , it is convenient to introduce a definition for effective stress in tension state, related to the surface that effectively resists the load:
= −
(1.12)
Introducing the damage variable, , :
=
(1 − )
(1.13)
The fracture of ductile solids has been observed to result from the large growth and coalescence of microscopic voids. This dependence guided McClintock to assume that fracture is reached when the spacing between voids in a material reaches a critical value. The fracture criterion derived from this assumption can be written as follows (McClintock, 1968):
√3 2( − 1) ℎ √3(1 − ) 2 − +3 4 − ̅ = (1.14)
where the symbol n represents the strain-hardening coefficient of the Ludwik, Holomon, Voce or etc stress–strain relationship and , are the principal stresses in the direction of the greatest and smallest void deformation.
Most decoupled criterion were used for extrusion and forging (bulk forming), more recently (Chen, Zhou and Chen, 2010; Han and Kim, 2003; Korhonen and Manninen, 2008; Liu et al., 2009; Ozturk and Lee, 2007) developed these models for sheet forming and in some models they consider strain path, shear stress and etc.
1.1.7.3 Coupled damage
Ductile fracture is a mode of material failure in which voids, either already existing within the material or nucleated during deformation, grow until they link together, or coalesce, to form a continuous fracture path. The existence of distributed microscopic voids, cavities, or cracks of the size of crystal grains is referred as material damage, whereas the process of void nucleation, growth and coalescence, which initiates the macro cracks and causes progressive material degradation through strength and stiffness reduction, is called damage evolution. Figure 1.9 and Figure 1.10 shows the stages of damage.
Figure 1.9: Stages in void nucleation, growth and coalescence in ductile metals (Anderson, 2005).
Figure 1.10: Damage stages in a tensile specimen (Mariage, 2003).
In Figure 1.10 deformation decomposed into domains which connect with three stages of the ductile damage:
OA: homogeneous linear elastic deformation of the specimen.
AB: homogeneous plastic deformation of the specimen. In this stage void nucleation with small size could not modify the plastic response.
The curve ABB' is the homogeneous answer of the specimen if no defect developed.
BC: voids grow and their effect begins gradually be effected on the plastic and elastic response of the material. The internal constraints begin to decrease leading to indubitably the acceleration of the fall of the tangent module which reached zero the point C. In this stage voids growth and damage behavior cannot be any more neglected.
CD: the mechanism of coalescence of the voids begins in the point C, with the beginning of the localized plasticity. In fact the distance between voids is small, therefore, localization of the plastic flow occurs, this leads to the breaking of these bonds by instability plastic so connecting between them to cause a macroscopic crack in D.
OE: this stage corresponds to the distribution of the macroscopic crack leading to final break of sample.
Figure 1.11 gives some micro graph depicting the phenomenon of damage on micro scale.
Figure 1.11: CrackedAl3Ti-particlein a tensile test specimen (Gänser, Werner and Fischer, 1998).
Micro mechanics of damage can be divided into three phenomena: void nucleation, void growth and void coalescence.
a) Void Nucleation
It is well established at low temperatures plasticity dominates the phenomenon of nucleation and growth (Goods and Brown, 1979). At room temperature the cavities are nucleated either by second phase cracking or second phase debonding from matrix material (with the exception of titanium alloy), whereas in the case of creep (elevated temperatures), cavities can be nucleated at the grain boundaries as well (Goods and Brown, 1979).
Even if the material contains only one type of second-phase particle, void initiation will not occur simultaneously at all of the particles. Typically voids nucleate at the larger particles first. As the fracture process continues, voids nucleated at the larger particles grow while voids are nucleated at the smaller particles. The process becomes even more complicated for materials that contain several types of second-phase particles. In these materials, voids will
often nucleate first at a particular particle type, and then in the fracture process at another set of particles.
It is often the case that some of the particles may never initiate voids at all, but may affect the fracture process only indirectly by in fluencing the flow characteristics of the matrix (Needleman, 1987).
b) Void Growth
McClintock is the pioneer in modeling void growth for rigid non-hardening and linear hardening materials. McClintock obtained equations for growth of cylindrical voids under axisymmetric stress. The equations were based on the stress triaxiality. Then he formed equations for moderately hardening materials by interpolating between the two extremes (McClintock, 1963; 1968). Perra (Perra and Finnie, 2013) in his experiments on one hand found that the equations formed by McClintock underestimates the void growth and the other hand he confirmed the importance of stress triaxiality on void growth.
c) Void Coalescence
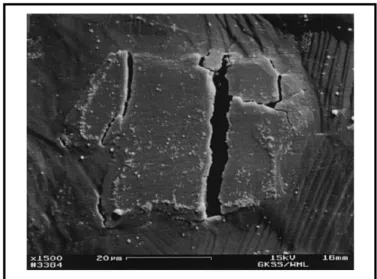
Void coalescence is the final stage in the failure mode of ductile materials. It consists in the localization of plastic deformation at the micro scale inside the inter void ligament between neighboring voids, with material outside the localization plane usually undergoing elastic unloading. As shown in Figure 1.12, two coalescence mechanisms were reported using model materials (Weck et al., 2008):
i) The necking of the ligaments between voids caused by the highest principal stress. ii) Shear-linking up of voids along the direction of the maximal shear stress.
These two mechanisms were also observed from the SEM fractographies of upsetting tests, shear tests, tensile tests of smooth and notched round bars (Bao and Wierzbicki, 2004; Li et al., 2011). The necking of the ligaments between voids is referred as dimple-dominant fracture while the linking up of voids is named as shear fracture (Li et al., 2011).
Figure 1.12: Two kinds of mechanisms for coalescence of voids: (a) necking of inter-void ligaments; (b) shear-linking up of voids
(Weck et al., 2008).
1.1.8 Forming limit diagrams
In sheet and tube metal forming operations, the amount of useful deformation is limited by the occurrence of unstable deformation, which mainly takes the form of localized necking, wrinkling and facture or bursting in hydroforming. Failure by wrinkling occurs when the dominant stresses are compressive, tending to cause material thickening. Localized necking occurs when the stress state leads to an increase in the surface area of the sheet while the thickness is reduced and it is a very important phenomenon in determining the amount of useful deformation that can be imposed on a specimen.
The forming limit diagram is a constructive concept for characterizing the formability of sheet or tube metals. It was proved to be an essential tool for material selection, design and try out of the tools for sheet and tube forming operations such as deep drawing and THF. Since the experimental determination of FLDs requires a wide range of sheet or tube forming tests, consequently a large variety of expensive equipment and tremendous experimental
effort, have been made to predict the FLDs, taking into account the theory of plasticity, material parameters and instability conditions.
1.1.8.1 Forming limit diagram concept
Stretch forming is a significant component in many sheet metal manufacturing processes. Simultaneously with the progressively thinning of a sheet, two models of plastic instability are possible, a diffuse necking followed by a localized necking.
A study of failure in biaxial stretching of sheets by Keeler and Backofen (Keeler and Backofen, 1963) showed the existence of what is known as forming limit diagrams (FLDs). The main discovery was that the largest principal strain before any localized thinning in a sheet increased as the degree of biaxiality increased. Later, Keeler (Keeler, 1965) found the material properties have great effect on the strain distribution in biaxial stretching of sheet metal. He point out for higher exponent of the material work hardening, n, the strain distribution will be relatively homogeneous. On the contrary, materials having lower n values develop sharp strain gradients and the deformation concentrates in a very small region, then causing earlier failure. A map in principal strain space ( , ), separates safe strain states that a material could provide. By definition, is the major principal strain, and is the minor principal strain. Therefore, FLDs show the combination of major and minor in-plane principal strains beyond which failure occurs. These strains can be represented as either engineering or true strains. With further development of the experimental techniques by Goodwin (Goodwin, 1968b), a FLD for mild steel was obtained. Figure 1.13 shows the Keeler-Goodwin diagram due of the contribution of both authors to the understanding of material formability.
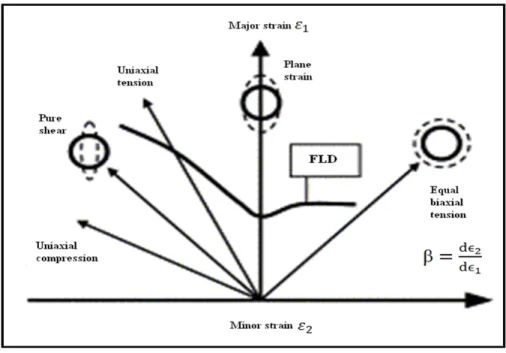
The FLDs represent a wide range of forming limit strains that are predicted when sheet material is deformed along linear strain paths. These strain paths range from uniaxial tension to plane strain to equi-biaxial tension, as illustrated in Figure 1.14, which shows an example of a theoretical FLD plotted in terms of true strains, rather than engineering strains
(Holmberg, Enquist and Thilderkvist, 2004). These linear strain paths can be described by the ratio of minor true strain( ) to major true strain( ) where:
= . A path where -0.5 < < 0 results in drawing of the sheet material. When 0 a condition of plane strain is achieved and when 0 < < 1 the material is stretched in biaxial tension.