HAL Id: hal-01065095
https://hal.archives-ouvertes.fr/hal-01065095
Preprint submitted on 17 Sep 2014HAL is a multi-disciplinary open access archive for the deposit and dissemination of sci-entific research documents, whether they are pub-lished or not. The documents may come from teaching and research institutions in France or
L’archive ouverte pluridisciplinaire HAL, est destinée au dépôt et à la diffusion de documents scientifiques de niveau recherche, publiés ou non, émanant des établissements d’enseignement et de recherche français ou étrangers, des laboratoires
The lifecycle deficit in France, 1979-2005
Hippolyte d’Albis, Carole Bonnet, Julien Navaux, Jacques Pelletan, Hector
Toubon, François-Charles Wolff
To cite this version:
Hippolyte d’Albis, Carole Bonnet, Julien Navaux, Jacques Pelletan, Hector Toubon, et al.. The lifecycle deficit in France, 1979-2005. 2014. �hal-01065095�
The
lifecycle deficit in France, 1979‐2005
#
Hippolyte
d’Albis
1,
Carole Bonnet
2,
Julien Navaux
3,
Jacques Pelletan
4,
Hector
Toubon
5,
François‐Charles Wolff
6Revised manuscript, Journal of the Economics of Ageing July 28th, 2014
Abstract: We use the National Transfer Accounts methodology to calculate the
lifecycle deficit in France for the years 1979‐2005. During this period, consumption
profiles were roughly constant over age, while labor income profiles shifted to
higher ages. The share of the aggregate lifecycle deficit in GDP rose sharply in the
1980s due to an increase in the mean age of the population. In contrast, the per
capita shares of the lifecycle deficit attributed to the population under 20 and over
60 varied little during this period, even though the relative weights of these two
age‐segments has shifted continuously in favor of the latter. # We thank M. Ben Jelloul, P.‐Y. Cusset, R. Lee, A. Mason, C. Patxot Cardoner and V. Wisnia‐Weil as well as four anonymous reviewers of the Journal and participants to the 2013 NTA meeting in
Barcelona for their comments and suggestions. Financial supports from the Commissariat
Général à la Stratégie et à la Prospective and from the European Community‘s Seventh
Framework Programme FP7/2007‐2011 under grant agreement no. 613247 are gratefully
acknowledged. H. d’Albis researches are supported by the European Research Council (ERC
Starting Grant DU 283953) and the French National Research Agency through the program
Investissements d’Avenir (ANR‐10‐LABX_93‐01). The usual disclaimer applies.
1 Paris School of Economics ‐ University Paris 1. Email: [email protected]
2 INED. Email: [email protected]
3 University Paris Dauphine, Chaire « transitions démographiques, transitions économiques ».
Email: [email protected]
4 University Paris 8. Email: jacques.pelletan@univ‐paris8.fr
5 University Paris Dauphine. Email: [email protected]
1.
Introduction
The intergenerational distributions of income and public resources are recurring issues in
national public debates. In France, the economic slowdown, growth of public debt, and
uncertainty regarding the long‐term sustainability of the pay‐as‐you‐go pension system take
center stage in intergenerational debates. Some authors suggested an increasing inequality
between generations over the last decades, articulating the emergence of so‐called "golden"
generations that benefited from economic growth between 1950 and 1970 and who did not
modify their consumption behaviors after the economic slowdown at the expense of later
generations (Chauvel, 1998; Kotlikoff and Burns, 2012). It is however difficult to compare the
situation of individuals of different ages as the entire lifecycle profile should be taken into
account. Moreover, the low income level of young workers compared to those of senior workers
or even retirees may be offset by, for instance, downward family transfers.
A detailed picture of the various economic flows between ages over the life course seems then
very useful to better ground this debate. To compare the welfare of successive generations,
Auerbach, Gokhale and Kotlikoff (1991) have originally proposed to study the inter‐temporal
government budget constraint. Generational accounting considers how much each generation,
on a per person basis, is expected to pay in future taxes net of transfer payments, over the life
course. Such exercise has been completed at the beginning of the 2000s in France. Bonnet
(2002) and Accardo (2002) conclude that if tax and social policies remained constant an
intergenerational imbalance would emerge. These studies also warned about the fact that the
magnitude of this imbalance is highly sensitive to the assumptions made.
The National Transfer Accounts (NTA) method of Lee and Mason (2011) provides a more
thorough accounting of age‐specific resource allocation. An informative index falling out of this
method is the lifecycle deficit, which is defined as the difference at each age between
consumption and labor income. When the deficit is positive, this means that labor resources are
not sufficient to cover consumption needs. Of special interest are the two ages at which the
consumption and income age profiles intersect. Once the lifecycle deficit is computed, the next
step is to assess the reallocation of resources between age groups and to investigate how the
over time is a powerful tool to highlight the potential imbalances between the various age groups. In this article, we present lifecycle deficit estimates for France according to NTA methodology. The originality of our study is the time window since we cover the period ranging from 1979 to 2005. This allows us to determine how the profiles have evolved over more than two decades as the result of both economic changes and changes in the age structure of the French population
with the advance of the baby‐boom generation. This time‐perspective is coupled with a
comparative approach to other countries for which NTA accounts have been implemented in
order to highlight any specifics in France.
The primary advantage of a study covering a long period is that it reveals the constants that
structure society. In particular, we find that the allocation of consumption between ages has
remained relatively unchanged over the period. The total consumption profile is relatively stable
after 17 years, although substitutions between private and public consumption take place at
different ages. Interestingly, the share of lifecycle deficit per capita in the GDP has held roughly
constant both for the young and the elderly during this period. These developments may reflect
a certain social preference for equality in terms of consumption between ages in France.
However, the gap between shares received by the elderly and by the young has steadily
increased, reflecting the increasingly predominant weight of the elderly in French society. This paper is presented as follows. Section 2 describes the methodology and data sources used to construct the consumption and income profiles by age. The results obtained for year 2005 are subject to a detailed analysis in Section 3, including an international comparative perspective. Section 4 explores the changes in both the income and consumption profiles between 1979 and 2005 and analyzes changes in the balance between large age groups. Section 5 provides some concluding remarks.
2.
Construction of consumption and income profiles by age
Consumption and labor income profiles for France were constructed following the NTA
based on the combination of two elements: survey data to determine the age profiles for the selected flows (i.e. private consumption, public consumption and labor income), and aggregates calculated from the national accounts to adjust the results from survey data so as to sum to the total flows in the economy for a given year. For private consumption, the age profiles are composed of three parts: education expenditure,
health expenditure, and other expenditures including imputed rents. These components are
obtained from the Family Budget surveys (Enquêtes Budget des Familles) which are conducted at
regular intervals in France (1978‐1979, 1984‐1985, 1989, 1994‐1995, 2000‐2001, and 2005‐
2006) on a sample of approximately 10,000 households. These surveys describe the structure of
household expenditures on the basis of similar questionnaires over the period, which ensures
comparability of our results between surveys.
Private education and health profiles are obtained by regression methods. For education,
household consumption is assumed to be a function of the number of enrolled household
members of each age ranging from 2 to 28. The regression coefficients are then used to allocate
the education expenditure to each member within the household (see NTA manual for further
details). Given data constraints, household health expenditure is assumed to be a function of the
number of household members in each five‐year age group7 , except for the first year of life (age
0) which is treated separately. Concerning other consumption, the allocation by age is
determined according to the piecewise linear profile suggested by Lee and Mason (2011, p. 62), which is based on age‐specific contributions within the household. The weight is 0.4 for young children till age 4, then it increases linearly from age 4 to age 20, and is equal to 1 for adults aged 20 and older. Public education consumption profiles are calculated for each year from the French Education Account (Compte de l’Éducation), a satellite of the national accounting system. The data used to determine the number of students at each age and level of education (primary, secondary and tertiary) are taken from the National Institute of Statistics (INSEE) and the Ministry of National Education (Ministère de l'Éducation Nationale). It is assumed that individual public consumption 7 This approach corresponds to the “simple regression approach” in the NTA manual. Indeed, there is no variable identifying which individuals are receiving health‐care services.
is the same for all students of a given level. Public health expenditure profiles are estimated using data from the French Permanent Sample of National Insurance Beneficiaries (Echantillon Permanent d’Assurés Sociaux), based on a sample of nearly 80,000 insured persons under the scheme for employees for the years 2000, 2002, 2004 and 2006. For the years 1992 and 1998, data are taken from Health and Social Protection Surveys (Enquêtes Santé et Protection Sociale), which are subsamples of the above sample. Those samples do include institutionalized persons. Other public consumption expenditures (defense, justice, etc.) are distributed uniformly over the population, resulting in an age profile that is then assumed to be constant.
Age profiles of labor income (sum of wages, self‐employed incomes and payroll taxes) are
constructed from the Family Budget Surveys.
Once calculated, each profile is smoothed across ages using the Friedman (1984) method
recommended in the NTA methodology (UN, 2014, Appendix B, p. 159‐164). Because not all
profiles are available for each year between 1979 and 2005, we interpolate the values for all
ages in missing years using polynomial functions. Specifically, we rely on cubic functions which are flexible enough to get accurate values for the missing indicators. The only exception is the age pattern of public health expenditures. Since no data are available before 1992, we take the age‐specific mean of the profiles computed for 1992 and 1998 for all years prior to 1992. For each year of the period considered, National Accounts data for France are used to calculate the NTA accounting identity, according to which the sum of consumption, saving and net transfer outflows is equal to the sum of labor income and asset income (UN, 2014, p. 29). The aggregate
counterpart for the income of the self‐employed is derived using the method proposed by
Askenazy, Cette and Sylvain (2011), which is based on decomposition by sectors. Within each
sector considered, this method assigns the average labor income observed among employees to
the self‐employed. The resulting breakdown of Gross Mixed Income differs from the 1/3 – 2/3
rule typically used in NTA to separate the share of capital and labor in total earnings. For the self‐
employed, we determined that the share of labor earnings fluctuated between 0.59 and 0.83
over the period considered in France. Finally, each age profile is readjusted based on the
corresponding aggregate.
3.
Consumption, labor income and lifecycle deficit in 2005
In this section we present a decomposition of the lifecycle deficit for the year 2005 in France.
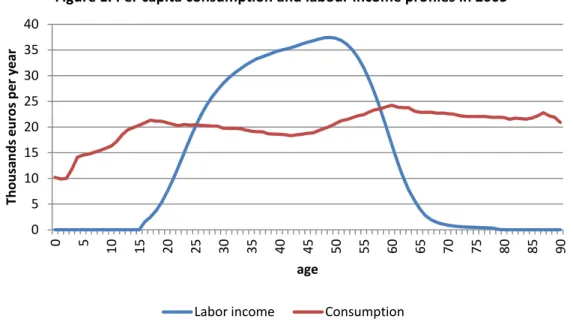
Figure 1 represents the per capita age profiles of total consumption, defined as the sum of
private and public consumption, and labor income.
Compared to the age profiles of the various countries examined by Tung (2011), the total
consumption profile for France shows a special feature: it appears relatively stable once
adulthood is reached, especially after retirement. Indeed, the French consumption increases
continuously until age 17, after which it stabilizes at between 18,000 and 24,000 Euros per year
until the highest ages. In this respect, France differs from the United States and many other
developed countries in which per capita consumption increases after age 60 or 65. A breakdown
of the various components of total consumption by age provides additional insights on the
French case.
3.1 Public and private consumption
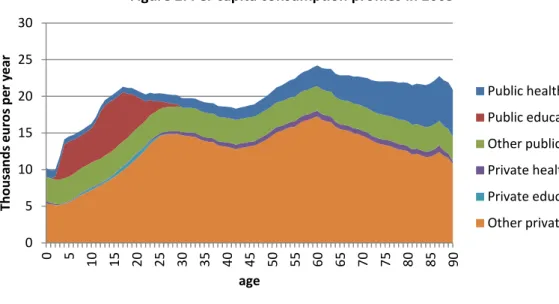
In Figure 2, we present the decomposition of total consumption by selected public and private
components. On the one hand, private consumption decreases significantly after age 60, by
0 5 10 15 20 25 30 35 40 0 5 10 15 20 25 30 35 40 45 50 55 60 65 70 75 80 85 90 Tho u sa nds eu ro s pe r ye ar age Figure 1. Per capita consumption and labour income profiles in 2005
approximately 25% at age 80. Clearly, the age profile of private consumption is essentially driven
by its “other” component since the contribution of the private health and private education
components remains very small. On the other hand, public consumption is significantly higher at
young and old age, respectively due to education and health. After 60, we note that health costs
strongly increases with age as one would expect.
In the case of France, it is interesting to note that these changes in private and public
consumption roughly balance each other, resulting in a profile which is remarkably stable
through older ages. This contrast with the situation observed in Germany, Japan, Sweden or the
United States, which are characterized by higher consumption at older ages. In these countries,
the most significant component of rising consumption at old ages is public consumption, due to
health care (Tung, 2011, p. 148‐149). In the United States, the consumption growth at old ages
over time is also due to the growth in private health care expenditures (Lee, Donehower and
Miller, 2011, p. 318). While we observe a strong rise in public health expenditures increase in France, we do not see any substantial private health expenditures in older age groups. The rise in public health expenditures is offset by a significant decline in private consumption. In France, public consumption accounts for 33.90% of total consumption (see Table 1). This is close to what is found in Finland (34.64% in 2004), but lower than in Sweden (42.37 % in 2003). However, it is substantially higher than in most other developed countries, Germany, Spain, the 0 5 10 15 20 25 30 0 5 10 15 20 25 30 35 40 45 50 55 60 65 70 75 80 85 90 Thousa nds eu ro s pe r ye ar age Figure 2. Per capita consumption profiles in 2005 Public health Public education Other public Private health Private education Other private
United States and Japan being all around 26%. Public and private education expenditure
represents 7.45%, which is rather in the average of high‐income countries (7.64% in Spain, 8.37%
in Austria, 7.43% in the United States). Health expenditure represents 12.29% of total
consumption in France, which is also very close to the average of high‐income countries: 10.18%
in Austria in 2000, 13.05% in Germany, 13.08% in Japan, but 16.04% in the US and even 18.52%
in Sweden. The significant contribution of other public expenditures at all ages is here an
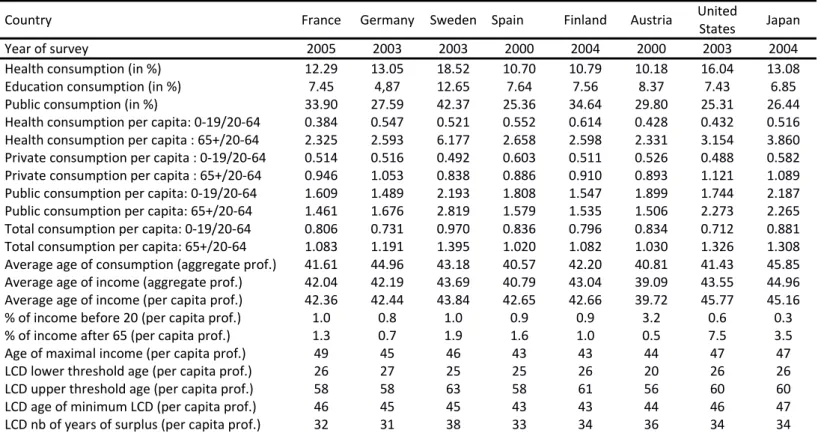
important result because it mechanically limits the growth of the contribution of public health consumption at older ages. We also note that in France, a large part of public expenses devoted to long‐term‐care is made of monetary transfers to dependent persons. As those transfers are of course not included in consumption, the profile turns to be flatter than of other countries. Table 1. NTA estimates: France compared to a selection of countries
Country France Germany Sweden Spain Finland Austria UnitedStates Japan
Year of survey 2005 2003 2003 2000 2004 2000 2003 2004 Health consumption (in %) 12.29 13.05 18.52 10.70 10.79 10.18 16.04 13.08 Education consumption (in %) 7.45 4,87 12.65 7.64 7.56 8.37 7.43 6.85 Public consumption (in %) 33.90 27.59 42.37 25.36 34.64 29.80 25.31 26.44 Health consumption per capita: 0‐19/20‐64 0.384 0.547 0.521 0.552 0.614 0.428 0.432 0.516 Health consumption per capita : 65+/20‐64 2.325 2.593 6.177 2.658 2.598 2.331 3.154 3.860 Private consumption per capita : 0‐19/20‐64 0.514 0.516 0.492 0.603 0.511 0.526 0.488 0.582 Private consumption per capita : 65+/20‐64 0.946 1.053 0.838 0.886 0.910 0.893 1.121 1.089 Public consumption per capita: 0‐19/20‐64 1.609 1.489 2.193 1.808 1.547 1.899 1.744 2.187 Public consumption per capita: 65+/20‐64 1.461 1.676 2.819 1.579 1.535 1.506 2.273 2.265 Total consumption per capita: 0‐19/20‐64 0.806 0.731 0.970 0.836 0.796 0.834 0.712 0.881 Total consumption per capita: 65+/20‐64 1.083 1.191 1.395 1.020 1.082 1.030 1.326 1.308 Average age of consumption (aggregate prof.) 41.61 44.96 43.18 40.57 42.20 40.81 41.43 45.85 Average age of income (aggregate prof.) 42.04 42.19 43.69 40.79 43.04 39.09 43.55 44.96 Average age of income (per capita prof.) 42.36 42.44 43.84 42.65 42.66 39.72 45.77 45.16 % of income before 20 (per capita prof.) 1.0 0.8 1.0 0.9 0.9 3.2 0.6 0.3 % of income after 65 (per capita prof.) 1.3 0.7 1.9 1.6 1.0 0.5 7.5 3.5 Age of maximal income (per capita prof.) 49 45 46 43 43 44 47 47 LCD lower threshold age (per capita prof.) 26 27 25 25 26 20 26 26 LCD upper threshold age (per capita prof.) 58 58 63 58 61 56 60 60 LCD age of minimum LCD (per capita prof.) 46 45 45 43 43 44 46 47 LCD nb of years of surplus (per capita prof.) 32 31 38 33 34 36 34 34 Source: authors’ calculations for France and NTA data for other countries (http://www.ntaccounts.org/) An alternative method to analyze the differences in consumption profiles between countries is
to calculate the population‐weighted mean age of consumption. The average age of an
∑ ∑ where v(x) is the per capita age profile and N(x) the population of age x. (see UN 2014, p. 108). It can be thought of as the average age at which one euro is consumed within the population. This age therefore depends both on the per capital age profile and on the age distribution of the population. In France, the average age at which one euro is consumed within the population is 41.61 years (see Table 1). This is quite close to the average of other high‐
income countries such as the United States (41.43 years) or Austria (40.81), but this age is
significantly higher in Sweden (43.18) and Germany (44.96).
However, the age‐distribution of consumption can vary greatly for the same mean age of
consumption. As emphasized in Tung (2011), it is revealing to compare the average consumption of the population under age 20 and the population aged at least 65 to that of persons aged 20‐ 64. Regarding private consumption, the average consumption of those less than 20 years relative to those aged 20‐64 is 0.514, while the average consumption of those aged at least 65 relative to those aged 20‐64 is 0.946. Those ratios correspond to the average of high‐income countries and are very close to those of Germany, Finland or Sweden). The same ratios calculated for health expenditures are 0.384 for those under 20 and 2.325 for those aged 65 and over. As is usually observed, the bulk of health expenditures accrue to the
elderly. This ratio for France tracks closely with most high‐income countries (Germany, Spain,
and Finland), even if a bit lower. For public consumption, the ratios are 1.609 and 1.461. While
these figures are close to those of countries like Finland and Austria, they are nonetheless lower
than those found for the United States (1.744 and 2.273), Sweden (2.193 and 2.819) and Japan
(2.187 and 2.265). Public expenditure is clearly an important component of lifecycle
consumption for both younger and older age groups. Finally, for total consumption, the ratios are 0.806 for the average consumption of the younger group and 1.083 for the elderly. This is largely explained by the fact that public consumption in France has an important weight relative to private consumption, which in general favors these age groups through education and health, respectively.
3.2 Labor income The average income age profile depends on several factors (Lee and Ogawa, 2011). Resources at each age depend on the employment rate, working hours, the effect of seniority on wages, and more generally on the institutional, social, and cultural factors that influence the functioning of the labor market. In particular graduation and retirement ages set the start and end of individual
labor income trajectories, respectively, such that the means of these two ages anchor the
bounds of average labor income profiles.
France is characterized by a small proportion of total lifecycle income earned by persons under
age 20 (1%) or ages 65 and over (1.3%). This is explained by a relatively long duration of
education on average and by a relatively low senior employment rate. As shown in Figure 1, the
income age profile may be divided into three main phases: a sharp increase from ages 20 to 35,
then a slow growth with a peak at age 49, and finally a sharp decline until around age 60.
Average labor income reaches its maximum at a higher age in France than in other high‐income countries. In the United States and Japan, countries also characterized by a relatively late peak, the maximum level of income is reached, on average, at around 47. Conversely, this threshold age equals 45 in Germany, 43 in Spain and even 44 in Austria. Does this mean that in France labor income is received later in the lifecycle? Paradoxically, this is not the case. For the hypothetical French person that would earn each year the average labor
income profile found for 2005, one euro would be earned at age 42.36 on average. In
comparison, the United States and Japan are characterized by significantly higher mean ages of 45.77 and 45.16, respectively. France is not really different from other European countries: 42.44 in Germany, 42.65 in Spain and 42.66 in Finland. If we consider instead the population‐weighted average profile of labor income (which gives the average age at which one euro is earned in the country instead of the average age at which an individual earns one euro), the conclusion is not modified. The average age of income is 42.04 in France.
Thus, it is not the age profile of average labor income that makes France unique, but rather the
higher age at which labor income reaches its maximum. Another important finding is the huge
decline in average income just after the peak, which is much faster in France than in other
European countries. An explanation is the relatively early exit age of older workers from the
labor market. According to Eurostat, the average exit age from the labor force was 59 in France in 2005. This is two years younger compared to the European average exit age (61 years). This kind of profile is not found in the other countries for which the NTA method has been applied. The average exit age from the labor force is for instance 63.6 in Sweden, 63.1 in Norway and 62.4 in Spain. The situation in France is more similar to that of Eastern European countries as Slovenia (58.5) or Hungary (59.8). 3.3 Lifecycle deficit The difference between labor income and consumption profiles provides the lifecycle deficit by age. The intersection points between the labor and consumption curves corresponds to the two age thresholds that characterize the passage between periods of deficit, during youth and old age when individuals consume more than they produce through labor, and periods of surplus during the working life when individuals produce more than they consume.
As shown by the per capita age profile presented in Figure 1, the ages at which the curves
intersect are 26 years and 58 years, respectively. This means that on average labor income was
higher than consumption during 32 years in 2005 in France. The duration of the surplus period
has to be compared to the length of the two periods of deficit: 25 years during youth and 22
years during old age (the life expectancy was 80 years in France in 2005), so that the period of
deficit includes 47 years. This means that for that specific year the number of years when people
were consuming more than they were producing was 47% higher than that when people were
producing more than they were consuming. Another result from Figure 2 is that the lifecycle
deficit reaches its minimum at age 46.
Although each country is characterized by a unique set of consumption and income profiles,
these threshold ages differ little in France from those of other countries surveyed. In general, the
characterized by early entry into the labor market, labor income exceeds both public and private
consumption at age 20. Conversely, this age is higher for Mexico and Brazil. In Senegal, surplus
does not occur until age 36 because of the great difficulty experienced by younger generations
to enter the labor market (Dramani and Ndiaye, 2012).
The second age threshold, 58 years in France, is again very similar to that found in other
countries with NTA accounts. The second period of deficit begins at ages between 53 and 59
depending on countries. However, some exceptions appear as in Sweden where the age is 63
years, which is explained by a higher average exit age from the labor force. Overall, the length of the period of surplus in France (32 years) exceeds that of Germany (31 years), but it is
substantially lower than that observed in the United States (34 years), Japan (34 years), Austria (36 years) and Sweden (38 years).
4.
Persistence and changes during the period 1979‐2005
4.1 Labor income, consumption, and lifecycle deficit To date, very few countries have applied NTA methodology to a time series, the United States(Lee, Donehower and Miller, 2011) and Sweden (Lindh, Oeberg and Sanchez‐Romero, 2011)
being noticeable exceptions. We now discuss results obtained from the whole sets of Family
Budget surveys, covering the period from 1979 to 2005. In a context characterized by many
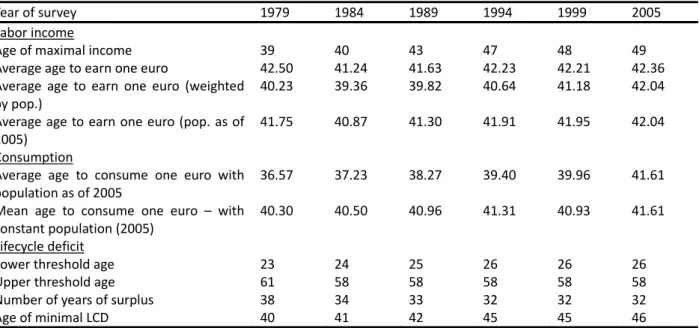
societal changes that are expected to influence the duration of the periods of surplus and deficit over the life course, such as significant gains in life expectancy and an increase in the average duration of studies, we expect that the earlier‐discussed threshold ages to have changed. In Table 2, we report key statistics summarizing the main characteristics of the age profiles for total consumption and income in France over the last three decades. In Figure 3, we present the
evolution of the labor income age profiles. As usual in NTA methodology, each profile is
normalized by dividing income at each age by the sum of income earned for ages 30‐49. The age
at which labor income reaches a peak shifts by 10 years during the period, from 39 years in 1979
1980s till the mid‐1990s, with a shift from 40 years to 47 years. During the whole period, the largest share of labor income has been increasingly captured by older workers as cohorts born after World War II were getting older. Table 2. Key statistics over the period 1979‐2005 Year of survey 1979 1984 1989 1994 1999 2005 Labor income Age of maximal income 39 40 43 47 48 49 Average age to earn one euro 42.50 41.24 41.63 42.23 42.21 42.36 Average age to earn one euro (weighted
by pop.) 40.23 39.36 39.82 40.64 41.18 42.04 Average age to earn one euro (pop. as of
2005)
41.75 40.87 41.30 41.91 41.95 42.04
Consumption
Average age to consume one euro with
population as of 2005 36.57 37.23 38.27 39.40 39.96 41.61 Mean age to consume one euro – with
constant population (2005) 40.30 40.50 40.96 41.31 40.93 41.61 Lifecycle deficit Lower threshold age 23 24 25 26 26 26 Upper threshold age 61 58 58 58 58 58 Number of years of surplus 38 34 33 32 32 32 Age of minimal LCD 40 41 42 45 45 46 Does this increase in the age when labor income is at its maximum have led to changes in the average age at which one euro is earned over the life course? Curiously, this average age has remained relatively stable over the period, from 42.5 years in 1979 to 42.36 in 2005 (table 2).
Two effects have to be taken into consideration to understand this paradox. Labor income
depends on both the fraction of the population in the labor market and on the income earned.
During the period, there has been a significant reduction in the share of employed senior
workers, particularly due to the various measures implemented for earlier retirement in the
early 1980s. This is why we first observe a decrease in the average age, from 42.50 years in 1979
to 41.24 years in 1984, and then an increase to 42.23 years in 1994. Since then, this age has
changed very little.
We have also calculated the average age at which one euro is earned in France in a given year. By
definition, the evolution of this age over time depends on both the age profiles and the age
structure of the population. To isolate the effect of changes in the age profile, we follow the
strategy suggested by Lee, Donehower and Miller (2011) which consists of weighting a given
labor income profile by a standard population age structure. We apply this method for France
using the 2005 population as reference.
Neutralization of the effect of the change in the demographic structure does not meaningfully
change the average age at which one euro is earned. Changes remain very small over the period,
from 41.75 years in 1979 to 42.04 in 2005. In comparison, the average age has increased by
nearly two years over the same period for the United States (Lee, Donehower and Miller, 2011).
From 1984 to 2005, the average age in France has increased by 1.17 years, still below that found
in the United States. At the same time, displacement of the age when income is at its maximum
is much more pronounced in France than in the United States where the movement is about five
years (half that observed in France). The stability in France may be seen as the result of the
decline in employment of older workers despite a sharp increase in the age when income
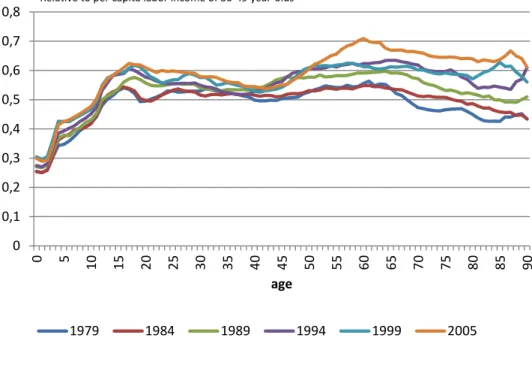
reaches a peak. 0 0,2 0,4 0,6 0,8 1 1,2 0 5 10 15 20 25 30 35 40 45 50 55 60 65 70 75 80 85 90 age Figure 3. Normalized per capita labor income by age 1979 1984 1989 1994 1999 2005 Relative to per capita labor income for ages 30‐49
Changes in the consumption age profile are not similar to those of the income age profile. Over
the period 1979‐2005, the consumption profile has remained relatively stable across ages. We
observe nevertheless a slight shift upward of the profile for people aged 60 and over compared
to the younger population. This is different from what is observed for the United States for
instance, which is instead characterized by a very strong growth in consumption of the elderly, driven primarily by public (and to a lesser extent private) health expenditure. At the same time, we find a global upward change in consumption curves over the period. This increase is related to the choice of normalizing the profile with the labor income earned by those aged 30‐49 since the ratio of aggregate consumption to aggregate labor income among ages 30‐49 has increased between 1979 and 2005. Again, we have calculated the average age at which one euro is consumed for each year, net of the role played by the population structure. In Table 2, we see that this age has remained rather
constant during the period. With the population of 2005 as reference, it has increased from
40.30 years in 1979 to 41.61 years in 2005. In comparison, the average age when one euro is consumed has increased by about one year in the United States during the same period. 0 0,1 0,2 0,3 0,4 0,5 0,6 0,7 0,8 0 5 10 15 20 25 30 35 40 45 50 55 60 65 70 75 80 85 90 age Figure 4. Normalized per capita consumption by age 1979 1984 1989 1994 1999 2005 Relative to per capita labor income of 30‐49 year‐olds
The change in the age profile of the lifecycle deficit results mechanically from the two trends
explained above. The displacement of the two age thresholds over time entails a shortening of
the period during which an individual is a net contributor (when the average level of labor
income exceeds the average level of consumption). As indicated in Table 2, the age at which the
average individual moves from a deficit to a surplus has increased early in the period, from 23
years in 1979 to 26 in 1994. Since 1994, the lower threshold age has not changed. This
postponement of when an individual produces more than he consumes must be linked to the
extension of studies period and difficulties in entering the labor market for young adults in
France.
At the same time, the age at which the average individual fell back into a deficit decreased from
61 in 1979 to 58 in 1984, due to the combined effects of decrease in the legal retirement age
from 65 to 60 years and an economic downturn. Since 1984, this threshold has remained
invariant. As a consequence, the period of surplus has strongly decreased between 1979 and
1989, from 37 to 32 years, but it has remained fairly constant since then. Our findings clearly
show a reduction of productive ages related to structural changes on the labor market. The
range of productive ages has tightened around the age where the minimum of the lifecycle
deficit is observed, which itself has moved significantly. The age corresponding to a maximum
surplus has increased from 40 years in 1979 to 46 in 2005. The movement observed over the
period is the result of both a stable profile of average total consumption and an increase in the
age when labor income is at its maximum.
These changes have also to be considered alongside the improvements in mortality observed
during this period. In France, life expectancy has increased from 78.3 years for women in 1979 (70.1 for men) to 83.9 years in 2005 (76.8 for men). For both males and females, much of this increase in life expectancy was due to mortality improvements in ages 60 and higher (52% for males and 68% for females). From 1994 to 2005, life expectancy at birth has increased by 2 years for women and 3.1 for men while the number of years of surplus has remained constant (at 32 years).
In summary, between 1979 and 2005 the length of the period of surplus has decreased while the
duration of the period of deficit has increased, with an increase in survival especially at old ages.
As a consequence, the reduction of the productive period and increases in life expectancy has
led to an increase in the aggregate lifecycle deficit, which takes the age structure of the
population into account. This aggregate value is obtained by summing the value of the lifecycle
deficit per capita obtained at each age by the number of people alive at each age within the
population. When comparing this value with the GDP of the same year, we find that in France the aggregate lifecycle deficit was only 0.47% of GDP in 1979, but 10.23% of GDP in 2005. This feature seems to be common to most high‐income countries (Mason and Lee, 2014), although the theoretical relationship between increased survival and deficit is not necessarily clear. 4.2 Resource allocation by age
Given the overall tightening of the income age profile and the shift of the age when income
reaches its maximum, the relative stability of the consumption age profile must therefore result
from redistribution between ages. Resources are expected to be redistributed from the baby
boomers (active during the period considered) to the young and the elderly age groups. As a
preliminary step, we calculate the total values of the deficit cumulated respectively for those
under aged 20 and for those aged at least 60. In Figure 5, we present these cumulated deficits as a fraction of GDP for each year of the period using the interpolated profiles. Our main finding is that while the relative weight of deficit to GDP has steadily increased over the period for the older age group (from 7.5% in 1979 to 14.5% in 2005), it has conversely slightly decreased for the young age group (from 16.5% in 1979 to 14.5% in 2005).
Then, we account for the size of the population and divide the previous ratios by the number of individuals within each age group. As shown in Figure 6, the relative magnitude of the lifecycle deficit compared to GDP net of the population structure has varied less over the period, except in the beginning of the period for those aged 60 and over. This reflects the fact that the increase of the relative importance of the deficit for those aged 60 and more came for an important part from the growth of their population. The fact that the trends found both for the young and old
age groups remain rather flat is remarkable given the significant political, economic and
demographic changes that France has experienced during the last decades. Nonetheless, the
increase in the ratio of the cumulated deficit per capita between the population aged 60 years and older and the younger ages (under 20) reflects the increasingly predominant political and social weight of the elderly in the French society. 0 0,02 0,04 0,06 0,08 0,1 0,12 0,14 0,16 0,18 0,2 1 979 1980 1981 1982 1983 1984 9851 1986 1987 1988 1989 1990 1991 9921 1993 1994 1995 1996 1997 1998 1999 2000 2001 2002 2003 2004 2005 Figure 5. Ratio of cumulated lifecycle deficit to GDP, by age group 60 + 20 ‐
5.
Conclusion
In this paper, we highlighted some aspects of the interplay between population structure,
lifecycle income and consumption in France between 1979 and 2005. We believe that
establishing time series for NTA is important as it permits to see whether age profiles change
over time and to reveal what phenomena are persistent in a given economy. The combination of
various data offers a first glimpse at some fundamental characteristics of the French population
and economy, which is of doubtless utility to the public debate on intergenerational welfare.
Although comparisons of the relative welfare between generations remain difficult, especially
because of the multidimensional aspects of this question, the use of total consumption (both
private and public) as a welfare indicator seems fruitful.
Implementation of the NTA methodology for France highlights both the relative equality of
consumption between ages and an increase in consumption profiles (normalized to labor income of ages 30‐49) over time, but the shift in favor of older persons does not seem as large as that observed in the United States. Moreover, the reduction in the period during which individuals consume less than they produce has not led to significant changes in reallocations that benefit the young and the elderly. Expressed as a percentage of GDP, the cumulative deficits for those respectively under age 20 and aged 60 and higher have remained roughly constant from 1979 till 0,8 0,9 1 1,1 1,2 1,3 1,4 1,5 197 9 198 0 198 1 198 2 198 3 198 4 198 5 198 6 198 7 198 8 198 9 199 0 199 1 199 2 199 3 199 4 199 5 199 6 199 7 199 8 199 9 200 0 200 1 200 2 200 3 200 4 200 5 Figure 6. Ratio of cumulated lifecycle deficit to GDP per capita, by age group (value for 1979 set to 1) 60 + 20 ‐ 60 + / 20 ‐
2005. However, a comparison of the trends for the young and the old age groups show that the
magnitude of the deficit has increased steadily for the latter. Updating our data thanks to the
2010‐2011 survey soon available will shed light on how the relative situation of the old has
evolved with the arrival of the baby boomers at retirement age since 2005. It could also give
some elements on the differential impact of the 2008 crisis on ages.
References
Accardo, J. (2002), “Une étude de comptabilité générationnelle pour la France en 1996”,
Économie et Prévision, n°154
Auerbach, A., Gokhale, J., and Kotlikoff, L. J. (1991), “Generational accounts: A meaningful
alternative to deficit accounting”, NBER Chapters, in: Tax Policy and the Economy, Volume 5, pp.
55‐110, National Bureau of Economic Research, Inc
Askenazy, P., Cette, G., and Sylvain, A. (2011), “Le partage de la valeur ajoutée”, Paris, La
Découverte
Bonnet, C . (2002), “Comptabilité générationnelle appliquée à la France : quelques facteurs
d’instabilité des résultats”, Économie et Prévision, n° 154 Chauvel, L. (1998), “Le destin des générations, structure sociale et cohortes en France au XXe siècle”, PUF, Paris Dramani, L., and Ndiaye, F. (2012), “Estimating the First Demographic Dividend in Senegal: The National Transfers Account Approach”, British Journal of Economics, Management & Trade, 2(2), pp. 39‐59
Friedman, J. H. (1984), “A variable span scatterplot smoother”, Laboratory for Computational
Statistics, Stanford University Technical Report No. 5
Kotlikoff, L. J, and Burns, S. (2012), “The clash of generations”, MIT Press
Lee, R.D., and Mason, A. (2011), “Population aging and the generational economy: A global
perspective”, Cheltenham, UK; Northampton, MA: Edward Elgar Publishing
Lee, S.H., and Ogawa, N. (2011), “Labor income over the lifecycle”. In R. D. Lee and A. Mason,
“Population aging and the generational economy: A global perspective”, Cheltenham, UK;
Northampton, MA: Edward Elgar Publishing
Lee R.D., Donehower, G., and Miller, T. (2011), “The changing shape of the economic lifecycle in
the United States, 1960 to 2003”. In R.D. Lee and A. Mason, “Population aging and the
generational economy: A global perspective”, Cheltenham, UK; Northampton, MA: Edward Elgar
Publishing
Lindh T., Oeberg G., Sanchez‐Romero M., (2011), “Backcasting National Transfer Accounts in
Sweden from 1800 to 2009”, mimeo, paper presented at the 4th EuroNTA Workshop, Budapest
Mason, A. and Lee, R.D. (2014), “Labor and consumption across the lifecycle”, Journal of the
Economics of Ageing, forthcoming
Tung, A.‐C. (2011), “Consumption over the lifecycle: an international comparison”. In R. D. Lee
and A. Mason, “Population aging and the generational economy: A global perspective”,
Cheltenham, UK; Northampton, MA: Edward Elgar Publishing
United Nations (2014), “National Transfer Accounts manual: Measuring and analysing the